SRVI@3
Download script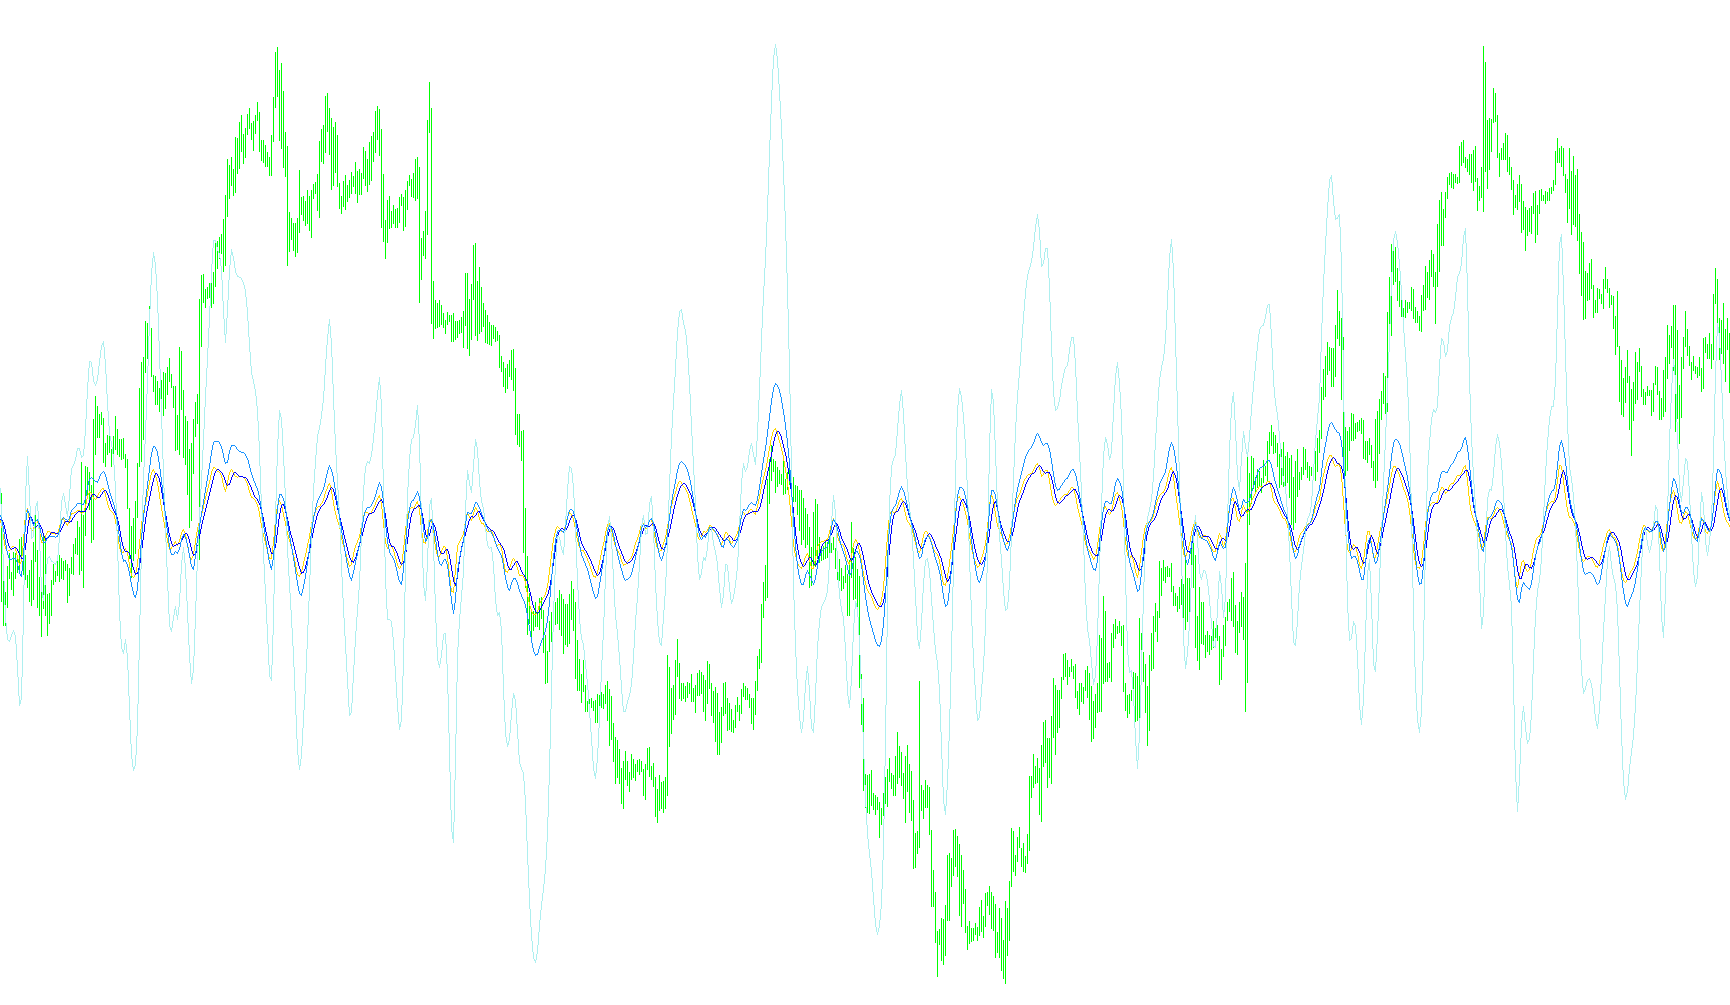
The Super Relative Vigor Index (RVI) is a technical analysis tool designed to help traders understand the strength and momentum of price movements. By analyzing specific price actions over a defined period, it provides a visual representation of whether a market trend is gaining strength or losing steam, helping users identify potential turning points in a trade.
Core Logic and Mechanics
The script functions by calculating two primary components: "Up" movement and "Down" movement. Instead of looking at just the current price, it performs a multi-step calculation that considers a sequence of recent candles to smooth out minor market noise.
1. Momentum Calculation To determine the vigor of the market, the script looks at the relationship between opening and closing prices (to measure "Up" movement) and high and low prices (to measure "Down" movement). It applies a weighted formula over several bars to ensure that the resulting data reflects a sustained trend rather than a momentary spike.
2. The Relative Vigor Index (RVI) The main indicator is created by dividing the total "Up" momentum by the total "Down" momentum. This creates a ratio:
- If the result is positive, it indicates that upward pressure is prevailing.
- If the result is negative, it suggests that downward pressure is dominating.
3. Signal Smoothing To make the data easier to read and to reduce "choppiness," the script generates a Signal Line. This is essentially a moving average of the main RVI. By comparing the main RVI line against this smoother signal line, traders can look for "cross-overs"—moments where the momentum shifts from one direction to another more decisively.
4. Dynamic Visual Aids (Value Lines) The script also calculates additional "Value" lines based on the relationship between the main indicator and the signal line. These values help highlight the distance or gap between the current price momentum and its smoothed average, providing an extra layer of perspective on how stretched or compressed the current market trend might be.
Visual Framework
When applied to a chart, the script automatically establishes a boundary framework:
- Reference Lines: It draws horizontal boundaries (Maximum and Minimum levels) to help the user identify "overbought" or "oversold" territory.
- Four Data Streams: The indicator populates four distinct lines on a separate window, allowing you to simultaneously track the raw RVI, the smoothed Signal line, and two calculated Value components to get a comprehensive view of market health at a glance.
//+------------------------------------------------------------------+
//|                                   Super Relative Vigor Index.mq4 |
//|                      Copyright © 2005, MetaQuotes Software Corp. |
//|                                       http://www.metaquotes.net/ |
//+------------------------------------------------------------------+
#property  copyright "Copyright © 2005, MetaQuotes Software Corp."
#property  link      "http://www.metaquotes.net/"
//---- indicator settings
#property  indicator_separate_window
#property  indicator_buffers 4
#property  indicator_color1  Black
#property  indicator_color2  Black
#property  indicator_color3  Yellow
#property  indicator_color4  Red
//---- indicator parameters
extern int ExtRVIPeriod=10;
//---- indicator buffers
double     ExtRVIBuffer[];
double     ExtRVISignalBuffer[];
double     ExtRVIValue[];
double     ExtRVIValue2[];
//-------------------------------------------------------------------------------------
double Rozdiel;
//-------------------------------------------------------------------------------------
//-------------------------------------------------------------------------------------
  int Window=1,TimePart=0; double MinValue=-0.007978,MaxValue=0.086278; int Color=Blue;
//int Window=1,TimePart=0; double MinValue=0.000331,MaxValue=0.086278;
//-------------------------------------------------------------------------------------

//+------------------------------------------------------------------+
//| Custom indicator initialization function                         |
//+------------------------------------------------------------------+
int init()
  {
//---- indicator buffers mapping
   SetIndexBuffer(0,ExtRVIBuffer);
   SetIndexBuffer(1,ExtRVISignalBuffer);
   SetIndexBuffer(2,ExtRVIValue);
   SetIndexBuffer(3,ExtRVIValue2);
//---- indicator line
   SetIndexStyle(0,DRAW_LINE);
   SetIndexStyle(1,DRAW_LINE);
   SetIndexStyle(2,DRAW_LINE);
   SetIndexStyle(3,DRAW_LINE);
//---- drawing settings
   SetIndexDrawBegin(0,ExtRVIPeriod+3);
   SetIndexDrawBegin(1,ExtRVIPeriod+7);
   SetIndexDrawBegin(2,ExtRVIPeriod);
   SetIndexDrawBegin(3,ExtRVIPeriod);
//---- name for DataWindow and indicator subwindow label
   IndicatorShortName("RVI("+ExtRVIPeriod+")");
   SetIndexLabel(0,"RVI");
   SetIndexLabel(1,"RVIS");
   SetIndexLabel(2,"Value");
   SetIndexLabel(3,"Value2");
//---- initialization done
   DrawBasic();
   return(0);
  }
//+------------------------------------------------------------------+
//| Relativ Vigor Index                                              |
//+------------------------------------------------------------------+
int start()
  {
   int i,j,nLimit,nCountedBars;
   double dValueUp,dValueDown,dNum,dDeNum;
//----
   if(Bars<=ExtRVIPeriod+8) return(0);
//----
   nCountedBars=IndicatorCounted();
//---- check for possible errors
   if(nCountedBars<0) return(-1);
//---- last counted bar will be recounted
   nLimit=Bars-ExtRVIPeriod-4;
   if(nCountedBars>ExtRVIPeriod+4)
      nLimit=Bars-nCountedBars;
//---- RVI counted in the 1-st buffer
   for(i=0; i<=nLimit; i++)
     {
      dNum=0.0;
      dDeNum=0.0;
      for(j=i; j<i+ExtRVIPeriod; j++)
        {
         dValueUp=((Close[j]-Open[j])+2*(Close[j+1]-Open[j+1])+2*(Close[j+2]-Open[j+2])+(Close[j+3]-Open[j+3]))/6;
         dValueDown=((High[j]-Low[j])+2*(High[j+1]-Low[j+1])+2*(High[j+2]-Low[j+2])+(High[j+3]-Low[j+3]))/6;
         dNum+=dValueUp;
         dDeNum+=dValueDown;
        }
      if(dDeNum!=0.0)
         ExtRVIBuffer[i]=dNum/dDeNum;
      else
         ExtRVIBuffer[i]=dNum;
      //==----==//
      ExtRVIValue[i]=ExtRVISignalBuffer[i]+ExtRVIBuffer[i]*4;
      if(ExtRVISignalBuffer[i]>ExtRVIBuffer[i])
       {
        Rozdiel=ExtRVISignalBuffer[i]-ExtRVIBuffer[i]/2;
        ExtRVIValue2[i]=ExtRVIBuffer[i]+Rozdiel;
       }
      if(ExtRVIBuffer[i]>ExtRVISignalBuffer[i])
       {
        Rozdiel=ExtRVIBuffer[i]-ExtRVISignalBuffer[i]/2;
        ExtRVIValue2[i]=ExtRVISignalBuffer[i]+Rozdiel;
       }
      //==----==//
     }
//---- signal line counted in the 2-nd buffer
   nLimit=Bars-ExtRVIPeriod-7;
   if(nCountedBars>ExtRVIPeriod+8)
      nLimit=Bars-nCountedBars+1;
   for(i=0; i<=nLimit; i++)
      ExtRVISignalBuffer[i]=(ExtRVIBuffer[i]+2*ExtRVIBuffer[i+1]+2*ExtRVIBuffer[i+2]+ExtRVIBuffer[i+3])/6;
      //==----==//
      ExtRVIValue[i]=ExtRVISignalBuffer[i]+ExtRVIBuffer[i]*4;
      if(ExtRVISignalBuffer[i]>ExtRVIBuffer[i])
       {
        Rozdiel=ExtRVISignalBuffer[i]-ExtRVIBuffer[i]/2;
        ExtRVIValue2[i]=ExtRVIBuffer[i]+Rozdiel;
       }
      if(ExtRVIBuffer[i]>ExtRVISignalBuffer[i])
       {
        Rozdiel=ExtRVIBuffer[i]-ExtRVISignalBuffer[i]/2;
        ExtRVIValue2[i]=ExtRVISignalBuffer[i]+Rozdiel;
       }
      //==----==//
//----
   return(0);
  }
//+------------------------------------------------------------------+
double DrawBasic()
  {
   ObjectDelete("MaxMiddle");
   ObjectDelete("MinMiddle");
   ObjectCreate("MaxMiddle",OBJ_HLINE,Window,TimePart,MaxValue);
   ObjectCreate("MinMiddle",OBJ_HLINE,Window,TimePart,MinValue);
   ObjectSet("MaxMiddle",OBJPROP_COLOR,Color);
   ObjectSet("MinMiddle",OBJPROP_COLOR,Color);
  }
//+------------------------------------------------------------------+
Comments