SRVI@2
Download script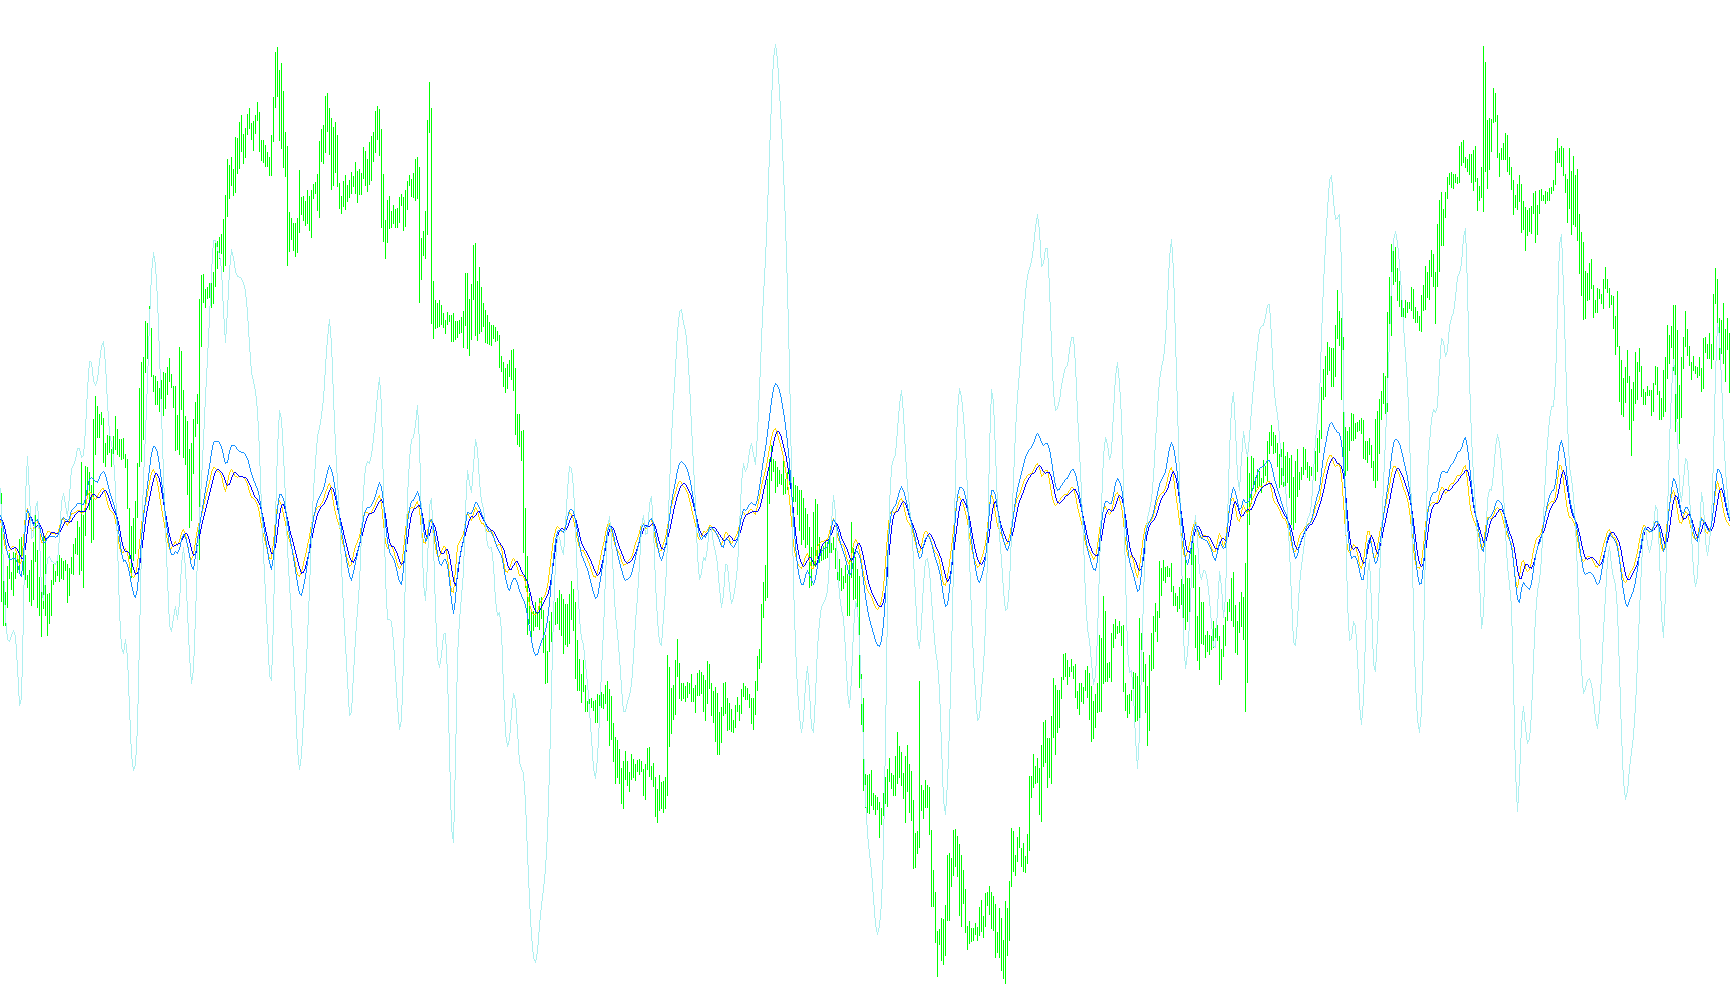
The Super Relativ Vigor Index (RVI) is a technical analysis tool designed to help traders gauge the momentum and strength of price movements by comparing the "vigor" of gains against the "vigor" of losses. Rather than simply looking at where the price is, this script analyzes how much energy is behind the current market trend over a specific period.
How the Logic Works
The core logic of this script relies on three primary steps: measuring movement, calculating the ratio, and generating signals.
1. Measuring Price Vigor The script examines two distinct types of price actions simultaneously:
- Upward Vigor: It calculates the difference between the closing price and the opening price. To ensure smoothness and reduce "noise," it applies a weighted calculation that factors in the results of the last few candles.
- Downward Vigor: It looks at the difference between the highest and lowest prices (the "range"). By comparing these high/low extremes over several periods, it determines how much potential volatility or downward pressure is present in the market.
2. Establishing the RVI Ratio Once the upward vigor and downward vigor are calculated, the script divides the total upward strength by the total downward strength. This produces the main RVI line.
- If the result is high, it suggests that bullish (upward) momentum is significantly stronger than bearish (downward) pressure.
- If the result is low, it suggests that the market is experiencing more significant downward volatility relative to its gains.
3. Signal Smoothing and Deviation To make the data easier for a human trader to interpret, the script performs two additional processing steps:
- Signal Line: It creates a smoothed "Signal" line by averaging the RVI values over a short window. This helps identify the overall direction of the momentum without reacting too quickly to minor price flickers.
- Value and Deviation Tracking: The script calculates secondary values (Value 1 and Value 2) that measure the distance or "gap" between the main RVI line and its Signal line. These act as indicators of divergence; when the gap between the price momentum and the signal becomes exaggerated, it can alert a trader to a potential change in trend.
Summary for the User
In simple terms, this script acts like a momentum speedometer. It looks at how hard the price is pushing in one direction versus the other, smooths out that data so it isn't jagged or confusing, and provides multiple lines that allow you to see not just where the price is going, but how much energy is backing that move.
//+------------------------------------------------------------------+
//|                                    Super Relativ Vigor Index.mq4 |
//|                      Copyright © 2005, MetaQuotes Software Corp. |
//|                                       http://www.metaquotes.net/ |
//+------------------------------------------------------------------+
#property  copyright "Copyright © 2005, MetaQuotes Software Corp."
#property  link      "http://www.metaquotes.net/"
//---- indicator settings
#property  indicator_separate_window
#property  indicator_buffers 4
#property  indicator_color1  Black
#property  indicator_color2  Black
#property  indicator_color3  Yellow
#property  indicator_color4  Red
//---- indicator parameters
extern int ExtRVIPeriod=10;
//---- indicator buffers
double     ExtRVIBuffer[];
double     ExtRVISignalBuffer[];
double     ExtRVIValue[];
double     ExtRVIValue2[];
//--------------------------------------------------------------------
double Rozdiel;
//--------------------------------------------------------------------
//+------------------------------------------------------------------+
//| Custom indicator initialization function                         |
//+------------------------------------------------------------------+
int init()
  {
//---- indicator buffers mapping
   SetIndexBuffer(0,ExtRVIBuffer);
   SetIndexBuffer(1,ExtRVISignalBuffer);
   SetIndexBuffer(2,ExtRVIValue);
   SetIndexBuffer(3,ExtRVIValue2);
//---- indicator line
   SetIndexStyle(0,DRAW_LINE);
   SetIndexStyle(1,DRAW_LINE);
   SetIndexStyle(2,DRAW_LINE);
   SetIndexStyle(3,DRAW_LINE);
//---- drawing settings
   SetIndexDrawBegin(0,ExtRVIPeriod+3);
   SetIndexDrawBegin(1,ExtRVIPeriod+7);
   SetIndexDrawBegin(2,ExtRVIPeriod);
   SetIndexDrawBegin(3,ExtRVIPeriod);
//---- name for DataWindow and indicator subwindow label
   IndicatorShortName("RVI("+ExtRVIPeriod+")");
   SetIndexLabel(0,"RVI");
   SetIndexLabel(1,"RVIS");
   SetIndexLabel(2,"Value");
   SetIndexLabel(3,"Value2");
//---- initialization done
   return(0);
  }
//+------------------------------------------------------------------+
//| Relativ Vigor Index                                              |
//+------------------------------------------------------------------+
int start()
  {
   int i,j,nLimit,nCountedBars;
   double dValueUp,dValueDown,dNum,dDeNum;
//----
   if(Bars<=ExtRVIPeriod+8) return(0);
//----
   nCountedBars=IndicatorCounted();
//---- check for possible errors
   if(nCountedBars<0) return(-1);
//---- last counted bar will be recounted
   nLimit=Bars-ExtRVIPeriod-4;
   if(nCountedBars>ExtRVIPeriod+4)
      nLimit=Bars-nCountedBars;
//---- RVI counted in the 1-st buffer
   for(i=0; i<=nLimit; i++)
     {
      dNum=0.0;
      dDeNum=0.0;
      for(j=i; j<i+ExtRVIPeriod; j++)
        {
         dValueUp=((Close[j]-Open[j])+2*(Close[j+1]-Open[j+1])+2*(Close[j+2]-Open[j+2])+(Close[j+3]-Open[j+3]))/6;
         dValueDown=((High[j]-Low[j])+2*(High[j+1]-Low[j+1])+2*(High[j+2]-Low[j+2])+(High[j+3]-Low[j+3]))/6;
         dNum+=dValueUp;
         dDeNum+=dValueDown;
        }
      if(dDeNum!=0.0)
         ExtRVIBuffer[i]=dNum/dDeNum;
      else
         ExtRVIBuffer[i]=dNum;
      //==----==//
      ExtRVIValue[i]=ExtRVISignalBuffer[i]+ExtRVIBuffer[i]*4;
      if(ExtRVISignalBuffer[i]>ExtRVIBuffer[i])
       {
        Rozdiel=ExtRVISignalBuffer[i]-ExtRVIBuffer[i]/2;
        ExtRVIValue2[i]=ExtRVIBuffer[i]+Rozdiel;
       }
      if(ExtRVIBuffer[i]>ExtRVISignalBuffer[i])
       {
        Rozdiel=ExtRVIBuffer[i]-ExtRVISignalBuffer[i]/2;
        ExtRVIValue2[i]=ExtRVISignalBuffer[i]+Rozdiel;
       }
      //==----==//
     }
//---- signal line counted in the 2-nd buffer
   nLimit=Bars-ExtRVIPeriod-7;
   if(nCountedBars>ExtRVIPeriod+8)
      nLimit=Bars-nCountedBars+1;
   for(i=0; i<=nLimit; i++)
      ExtRVISignalBuffer[i]=(ExtRVIBuffer[i]+2*ExtRVIBuffer[i+1]+2*ExtRVIBuffer[i+2]+ExtRVIBuffer[i+3])/6;
      //==----==//
      ExtRVIValue[i]=ExtRVISignalBuffer[i]+ExtRVIBuffer[i]*4;
      if(ExtRVISignalBuffer[i]>ExtRVIBuffer[i])
       {
        Rozdiel=ExtRVISignalBuffer[i]-ExtRVIBuffer[i]/2;
        ExtRVIValue2[i]=ExtRVIBuffer[i]+Rozdiel;
       }
      if(ExtRVIBuffer[i]>ExtRVISignalBuffer[i])
       {
        Rozdiel=ExtRVIBuffer[i]-ExtRVISignalBuffer[i]/2;
        ExtRVIValue2[i]=ExtRVISignalBuffer[i]+Rozdiel;
       }
      //==----==//
//----
   return(0);
  }
//+------------------------------------------------------------------+
Comments