SRCx2MA
Download script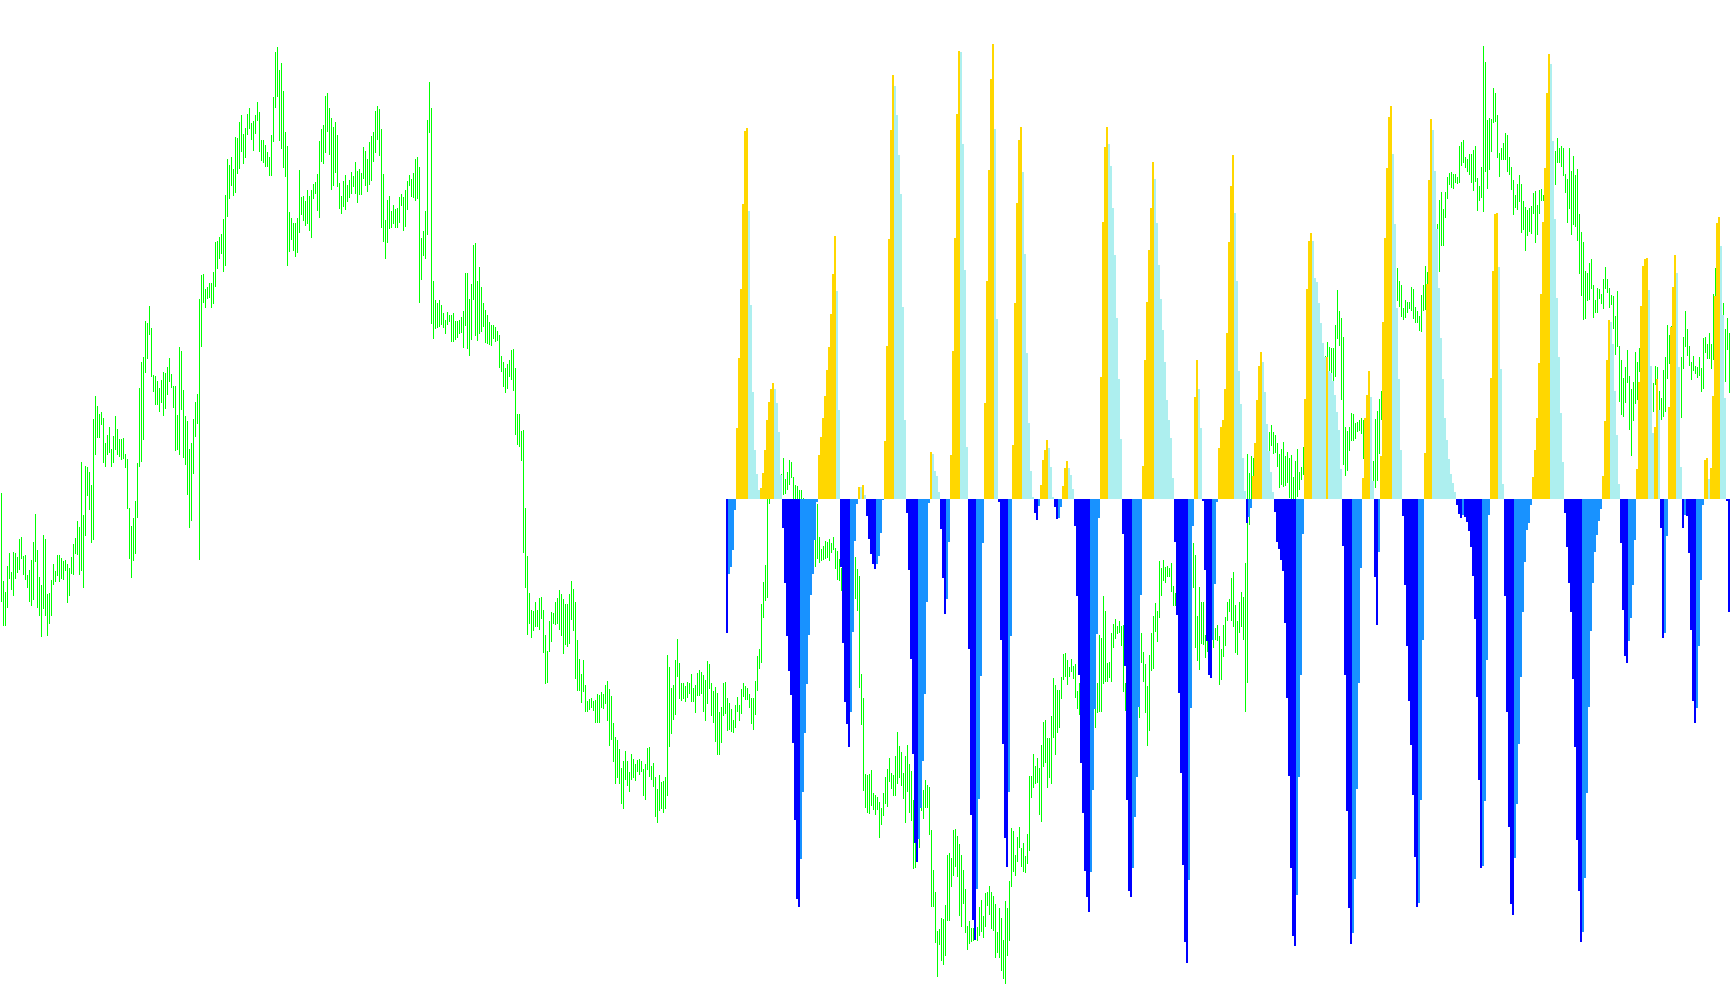
This script functions as a visual analytical tool designed to help traders identify momentum shifts and price trends by comparing two different moving average calculations simultaneously. Instead of looking at raw price action, it focuses on the "distance" or relationship between these averages to highlight where the market is gaining strength or losing steam.
Core Logic Breakdown
1. Data Integration The script relies on an external source (an indicator named "SRCma") to pull specific mathematical values. It takes two different sets of parameters from this source—essentially looking at short-term and medium-term trends—and calculates the difference between them. By subtracting one value from the other, the script creates a new data point that represents the "gap" or "velocity" between these two trends.
2. Smoothing the Signal To prevent the data from being too erratic or "noisy," the script applies an additional smoothing layer (a Simple Moving Average) to the calculated gap. This helps filter out minor price fluctuations, ensuring that the visual signals represent meaningful trend movements rather than temporary market hiccups.
3. Identifying Directional Momentum The final calculation determines the net momentum. The script then evaluates this momentum in two ways:
- Growth Check: It looks at whether the current momentum is higher or lower than it was in the previous moment (the previous candle).
- Directional Classification: If the momentum is positive, it focuses on identifying upward movement. If the momentum is negative, it focuses on downward movement.
4. Visual Representation The results are displayed as a histogram in a separate window below the main price chart. The logic distinguishes between different types of movements:
- It highlights when momentum is increasing in a specific direction (e.g., getting stronger).
- It highlights when momentum is decreasing or "fading" in that same direction (e.g., losing steam).
Summary for the User
Essentially, this tool acts as a momentum speedometer. Rather than just telling you if the price is going up or down, it visualizes the intensity of that movement. It helps traders see not only which way the "wind" is blowing but also whether that wind is picking up speed or beginning to die down, allowing for potentially more informed entries and exits based on the strength of the current trend.
//+------------------------------------------------------------------+
//|                                                      SRCx2MA.mq4 |
//+------------------------------------------------------------------+
//  Íåîáõîäèìî íàëè÷èå SRCma.mq4
//  Presence SRCma.mq4 is necessary
//+------------------------------------------------------------------+
#property copyright "Copyright © 2009, Bookkeeper"
#property link      "yuzefovich@gmail.com"
//----
#property  indicator_separate_window
#property  indicator_buffers 4
#property  indicator_color1  Aqua
#property  indicator_color2  Red
#property  indicator_color3  Blue
#property  indicator_color4  Maroon
//----
extern int IndPeriod1=3;
extern int IndPeriod2=10;
extern int CalculatedBars=500;
extern int rangeN=14;
extern int MAPeriod=13;

double   up_buffer1[];
double   dn_buffer1[];
double   up_buffer2[];
double   dn_buffer2[];
double   ind_buffer1[];
double   ind_buffer2[];
double   ind_buffer3[];

//+------------------------------------------------------------------+
int init()
{
   IndicatorBuffers(7);
   SetIndexStyle(0,DRAW_HISTOGRAM,EMPTY,2);
   SetIndexStyle(1,DRAW_HISTOGRAM,EMPTY,2);
   SetIndexStyle(2,DRAW_HISTOGRAM,EMPTY,2);
   SetIndexStyle(3,DRAW_HISTOGRAM,EMPTY,2);
   SetIndexBuffer(0,up_buffer1);
   SetIndexBuffer(1,dn_buffer1);
   SetIndexBuffer(2,up_buffer2);
   SetIndexBuffer(3,dn_buffer2);
   SetIndexBuffer(4,ind_buffer1);
   SetIndexBuffer(5,ind_buffer2);
   SetIndexBuffer(6,ind_buffer2);
   return(0);
}
//+------------------------------------------------------------------+
int deinit()
{
   return(0);
}
//+------------------------------------------------------------------+
int start()
{
   int  limit, i, counted_bars = IndicatorCounted();
   if(counted_bars < 0)
       return(-1);
   if(counted_bars > 0)
       counted_bars--;
   limit = Bars - counted_bars;
   if(CalculatedBars<500) CalculatedBars=500;
   if(limit>CalculatedBars) limit=CalculatedBars;
   for(i=limit;i>=0;i--)
   {
      double Ind1=iCustom(NULL,0,"SRCma",CalculatedBars+IndPeriod2+1,rangeN,IndPeriod1,1,i);
      double Ind2=iCustom(NULL,0,"SRCma",CalculatedBars+IndPeriod2+1,rangeN,IndPeriod2,1,i);
      ind_buffer2[i]=Ind1-Ind2;
      ind_buffer3[i]=iMAOnArray(ind_buffer2,0,MAPeriod,0,MODE_SMA,i);
      ind_buffer1[i]=ind_buffer2[i]-ind_buffer3[i];
      if(ind_buffer1[i]>0)
      {
         dn_buffer1[i]=0;
         dn_buffer2[i]=0;
         if(ind_buffer1[i]>=ind_buffer1[i+1])
         {
            up_buffer1[i]=ind_buffer1[i];
            up_buffer2[i]=0;
         }
         else
         {
           up_buffer1[i]=0;
           up_buffer2[i]=ind_buffer1[i];
         }
      }
      else
      {
         up_buffer1[i]=0;
         up_buffer2[i]=0;
         if(ind_buffer1[i]<=ind_buffer1[i+1])
         {
            dn_buffer1[i]=ind_buffer1[i];
            dn_buffer2[i]=0;
         }
         else
         {
            dn_buffer1[i]=0;
            dn_buffer2[i]=ind_buffer1[i];
         }
      }
   }
   return(0);
}
//+------------------------------------------------------------------+
Comments