SR_MTF_Eli
Download script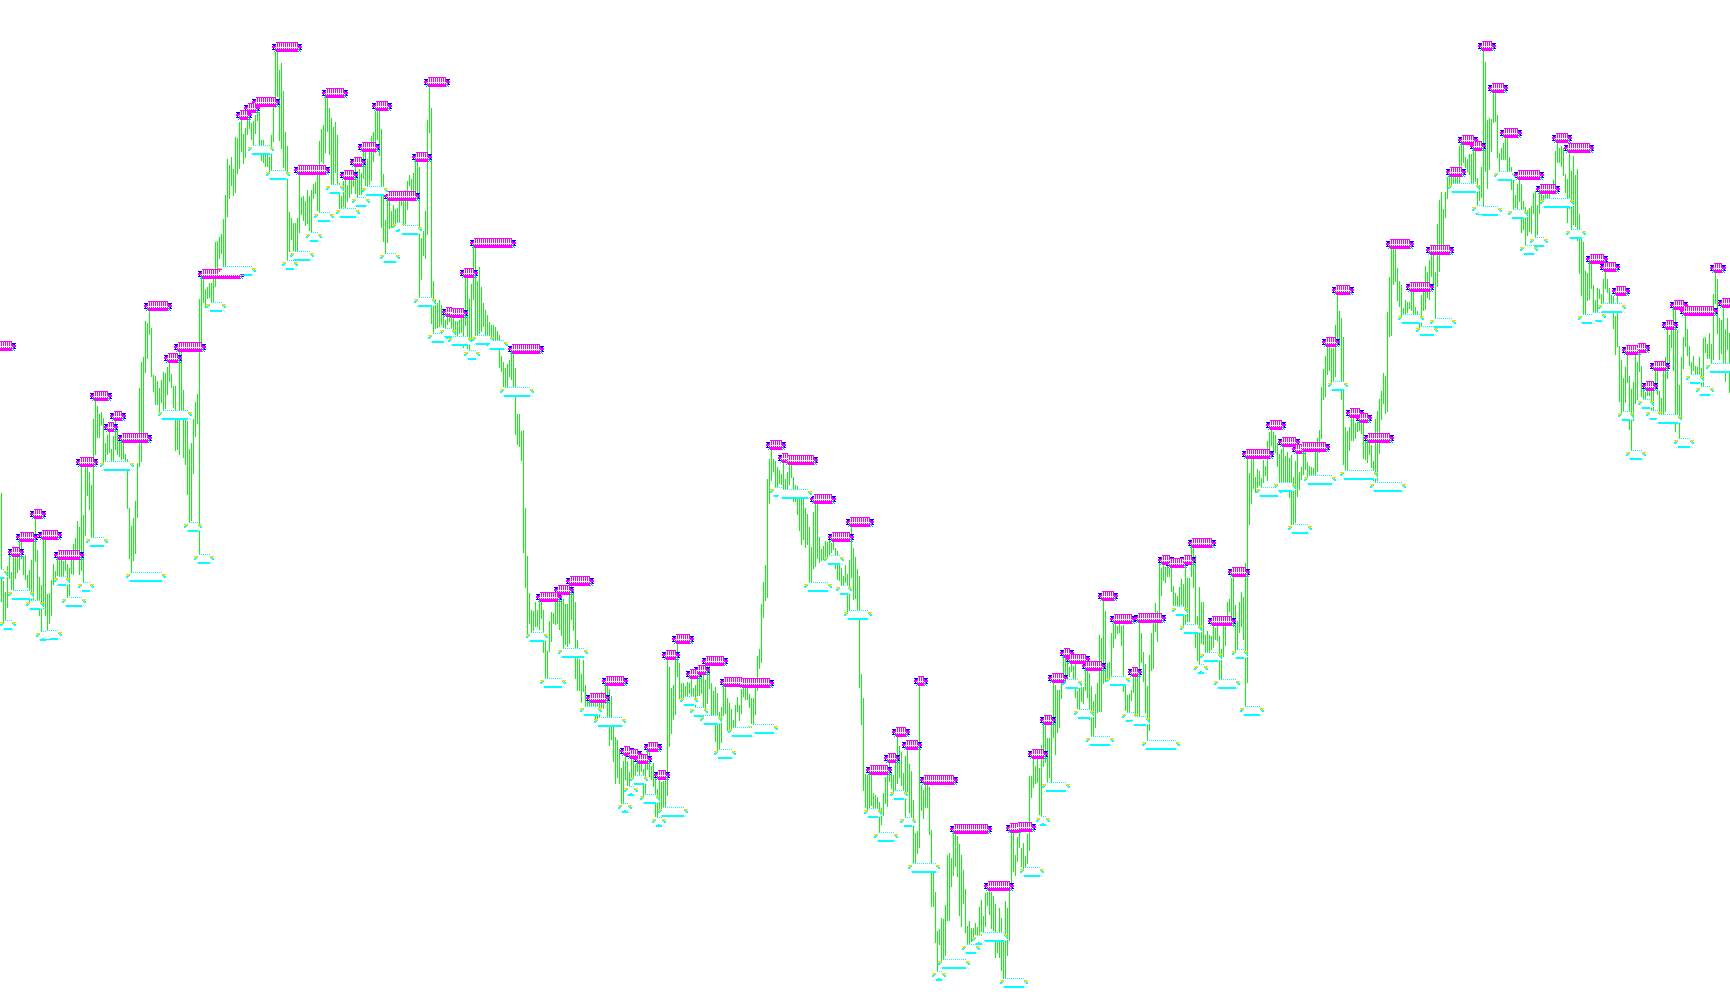
This script is a multi-timeframe analysis tool designed to help traders identify key historical price levels across different time horizons simultaneously. Instead of forcing you to switch back and forth between different charts (like jumping from a 5-minute chart to a Daily chart), it pulls significant price data from several timeframes and projects them onto your current screen.
Core Functionality
Multi-Timeframe Synchronization The tool looks at four distinct time periods at once (which can be customized by the user). It identifies "Fractals"—specific points in price history where the market reached a local high or low. By calculating these levels on higher timeframes and displaying them on your current lower timeframe, it allows you to see the "big picture" while executing trades on small price movements.
Visual Representation The script places specific visual markers (arrows) on your chart to represent these significant historical levels:
- High Levels: Represent ceilings or resistance points where the price peaked in the past on a specific timeframe.
- Low Levels: Represent floors or support points where the price bottomed out in the past on a specific timeframe.
How the Logic Works
- Data Collection: The script scans the history of four different timeframes (e.g., Daily, 4-Hour, 1-Hour, and 30-Minute).
- Fractal Identification: It identifies the highest and lowest points for each of those periods. This helps filter out "noise" and highlights only the most significant structural turns in the market.
- Smart Projection: Because a Daily level is much larger than a Minute level, the script uses a smoothing logic. When it finds a new historical high or low on a large timeframe, it ensures that the data remains consistent and continuous on your current chart, preventing "flickering" or gaps in the displayed information.
- Visibility Management: To keep the chart clean, the tool includes an intelligent display system. If you are looking at a very small timeframe (like 1 minute), the script will automatically hide larger data points that would otherwise clutter the screen and become unreadable.
Summary for the Trader
Essentially, this tool acts as a "radar" for major support and resistance zones. It tells you where the "big money" moved in the past across multiple time horizons, allowing you to see if the current price is approaching a significant historical ceiling or floor without having to leave your primary trading chart.
//+------------------------------------------------------------------+
//|                                                      #MTF SR.mq4 |
//|                                      Copyright © 2006, Eli hayun |
//|                                          http://www.elihayun.com |
//+------------------------------------------------------------------+
#property copyright "Copyright © 2006, Eli hayun"
#property link      "http://www.elihayun.com"

#property indicator_chart_window
#property indicator_buffers 8
#property indicator_color8 SkyBlue
#property indicator_color7 Yellow
#property indicator_color6 CornflowerBlue
#property indicator_color5 DarkOrange
#property indicator_color4 RoyalBlue
#property indicator_color3 Sienna
#property indicator_color2 Blue
#property indicator_color1 Red
//---- buffers
double buf_up1D[];
double buf_down1D[];

double buf_up4H[];
double buf_down4H[];

double buf_up1H[];
double buf_down1H[];

double buf_up30M[];
double buf_down30M[];

extern int Period_1 = PERIOD_H1;
extern int Period_2 = PERIOD_M30;
extern int Period_3 = PERIOD_M15;
extern int Period_4 = PERIOD_M5;


extern bool display_Period_1 = true;
extern bool display_Period_2 = true;
extern bool display_Period_3 = true;
extern bool display_Period_4 = true;

extern bool Play_Sound = true;

int UniqueNum = 2284;

//+------------------------------------------------------------------+
//| Custom indicator initialization function                         |
//+------------------------------------------------------------------+
int init()
  {
//---- indicators


   int draw = DRAW_LINE; if (!display_Period_4||Period_4<Period()) draw = DRAW_NONE;
   SetIndexStyle(6,DRAW_ARROW);
   SetIndexArrow(6,169);
   SetIndexStyle(7,DRAW_ARROW);
   SetIndexArrow(7,169);

   SetIndexBuffer(6,buf_up1D);
   SetIndexBuffer(7,buf_down1D);

   draw = DRAW_LINE; if (!display_Period_3||Period_3<Period()) draw = DRAW_NONE;
   SetIndexStyle(4,DRAW_ARROW);
   SetIndexArrow(4,170);
   SetIndexStyle(5,DRAW_ARROW);
   SetIndexArrow(5,170);

   SetIndexBuffer(4,buf_up4H);
   SetIndexBuffer(5,buf_down4H);


   draw = DRAW_LINE; if (!display_Period_2||Period_2<Period()) draw = DRAW_NONE;
   SetIndexStyle(2,DRAW_ARROW);
   SetIndexArrow(2,171);
   SetIndexStyle(3,DRAW_ARROW);
   SetIndexArrow(3,171);

   SetIndexBuffer(2,buf_up1H);
   SetIndexBuffer(3,buf_down1H);

   draw = DRAW_LINE; if (!display_Period_1||Period_1<Period()) draw = DRAW_NONE;
   SetIndexStyle(0,DRAW_ARROW);
   SetIndexArrow(0,172);
   SetIndexStyle(1,DRAW_ARROW);
   SetIndexArrow(1,172);

   SetIndexBuffer(0,buf_up30M);
   SetIndexBuffer(1,buf_down30M);

if (Period_1<Period())Period_1=Period();
if (Period_2<Period())Period_2=Period();
if (Period_3<Period())Period_3=Period();
if (Period_4<Period())Period_4=Period();

   SetIndexLabel(0, tf2txt(Period_1)); SetIndexLabel(1, tf2txt(Period_1));
   SetIndexLabel(2, tf2txt(Period_2)); SetIndexLabel(3, tf2txt(Period_2));
   SetIndexLabel(4, tf2txt(Period_3)); SetIndexLabel(5, tf2txt(Period_3));
   SetIndexLabel(6, tf2txt(Period_4)); SetIndexLabel(7, tf2txt(Period_4));


//----
   return(0);
  }
//+------------------------------------------------------------------+
//| Custom indicator deinitialization function                       |
//+------------------------------------------------------------------+
int deinit()
  {
//----

//----
   return(0);
  }
//+------------------------------------------------------------------+
//| Custom indicator iteration function                              |
//+------------------------------------------------------------------+
int start()
  {
   int    counted_bars=IndicatorCounted();
   int i=0, y1d=0, y4h=0, y1h=0, y30m=0;
   int limit=Bars-counted_bars +Period_1/Period();

   double pd_1=0, pd_2=0, pd_3=0, pd_4=0;
   double pu_1=0, pu_2=0, pu_3=0, pu_4=0;

   datetime TimeArray_1D[] ,TimeArray_4H[], TimeArray_1H[], TimeArray_30M[];
//----
   ArrayCopySeries(TimeArray_1D,MODE_TIME,Symbol(),Period_4);
   ArrayCopySeries(TimeArray_4H,MODE_TIME,Symbol(),Period_3);
   ArrayCopySeries(TimeArray_1H,MODE_TIME,Symbol(),Period_2);
   ArrayCopySeries(TimeArray_30M,MODE_TIME,Symbol(),Period_1);

   for(i=0, y1d=0,  y4h=0,  y1h=0,  y30m=0;i<limit;i++)
   {
      if (Time[i]<TimeArray_1D[y1d])   y1d++;
      if (Time[i]<TimeArray_4H[y4h])   y4h++;
      if (Time[i]<TimeArray_1H[y1h])   y1h++;
      if (Time[i]<TimeArray_30M[y30m]) y30m++;

      double fh = iFractals( NULL, Period_4, MODE_HIGH, y1d);

      buf_up1D[i]    = fh;
      buf_down1D[i]  = iFractals( NULL, Period_4, MODE_LOW, y1d);

      buf_up4H[i]    = iFractals ( NULL, Period_3, MODE_HIGH, y4h);
      buf_down4H[i]  = iFractals( NULL, Period_3, MODE_LOW, y4h);


      buf_up1H[i]    = iFractals( NULL, Period_2, MODE_HIGH, y1h);
      buf_down1H[i]  = iFractals( NULL, Period_2, MODE_LOW, y1h);


      buf_up30M[i]   = iFractals( NULL, Period_1, MODE_HIGH, y30m);
      buf_down30M[i] = iFractals( NULL, Period_1, MODE_LOW, y30m);

   }

   for (i=limit; i>=0; i--)
   {
      if (   buf_up1D[i] == 0 )   buf_up1D[i] = pu_1; else  pu_1 = buf_up1D[i];
      if (   buf_down1D[i] == 0 ) buf_down1D[i] = pd_1; else  pd_1 = buf_down1D[i];

      if (   buf_up4H[i] == 0 )   buf_up4H[i] = pu_2; else  pu_2 = buf_up4H[i];
      if (   buf_down4H[i] == 0 ) buf_down4H[i] = pd_2; else  pd_2 = buf_down4H[i];

      if (   buf_up1H[i] == 0 )   buf_up1H[i] = pu_3; else  pu_3 = buf_up1H[i];
      if (   buf_down1H[i] == 0 ) buf_down1H[i] = pd_3; else  pd_3 = buf_down1H[i];

      if (   buf_up30M[i] == 0 )   buf_up30M[i] = pu_4; else  pu_4 = buf_up30M[i];
      if (   buf_down30M[i] == 0 ) buf_down30M[i] = pd_4; else  pd_4 = buf_down30M[i];
   }

//----
   return(0);
  }
//+------------------------------------------------------------------+


string tf2txt(int tf)
{
   if (tf == PERIOD_M1)    return("M1");
   if (tf == PERIOD_M5)    return("M5");
   if (tf == PERIOD_M15)    return("M15");
   if (tf == PERIOD_M30)    return("M30");
   if (tf == PERIOD_H1)    return("H1");
   if (tf == PERIOD_H4)    return("H4");
   if (tf == PERIOD_D1)    return("D1");
   if (tf == PERIOD_W1)    return("W1");
   if (tf == PERIOD_MN1)    return("MN1");

   return("??");
}
Comments