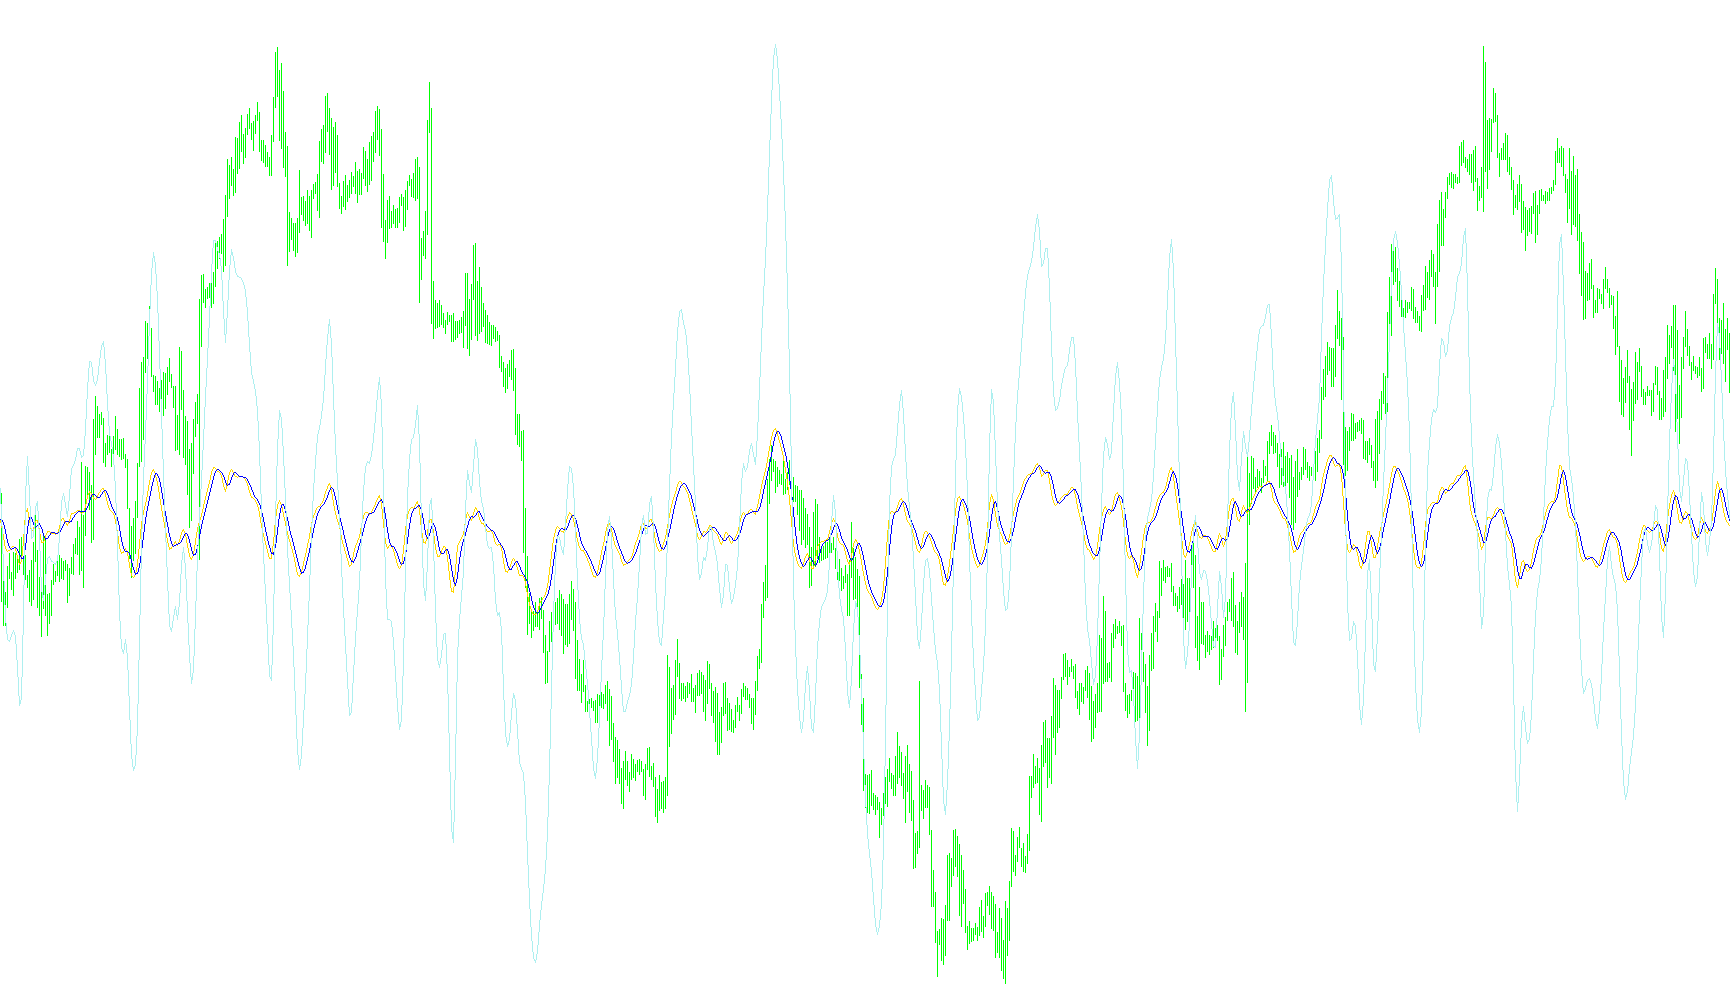
The Super Relativ Vigor Index is a custom technical analysis tool designed to help traders visualize market momentum and price strength. By analyzing the relationship between opening, closing, high, and low prices over a specific timeframe, it provides a smoothed representation of how aggressively the market is moving in one direction relative to its overall volatility.
How the Logic Works
The indicator functions by processing three distinct data streams to provide a comprehensive view of market behavior:
1. Core Momentum Calculation (RVI) The foundation of the script lies in its ability to distinguish between "upward" and "downward" price movement. Instead of just looking at whether a candle closed higher or lower than it opened, the logic calculates a weighted average of four consecutive bars.
- It looks at the difference between opening and closing prices to determine the "buying" strength.
- Simultaneously, it looks at the difference between the highest and lowest points of those same bars to measure the total range or "selling" potential. By dividing these two values, the indicator creates a ratio that helps identify if the current trend has actual strength or if it is merely drifting.
2. The Signal Line (Smooth Transition) To prevent the raw data from appearing too erratic or "noisy," the script calculates a Signal Line. This acts as a moving average of the primary RVI value. It takes the current RVI value and blends it with the values of the preceding bars. This creates a secondary line that follows the main trend but moves more slowly, making it easier for users to identify major shifts in momentum without getting distracted by minor price fluctuations.
3. The Value Component The script also tracks a "Value" metric. This is derived by combining the Signal Line with a multiplier of the primary RVI buffer. This third layer helps provide an additional reference point, essentially showing the expanded relationship between the primary trend and its smoothed signal.
Summary of Visual Output
- Primary Line (RVI): Shows the direct momentum ratio of the market based on the user-defined period.
- Signal Line: A smoother, slower-moving line used to identify potential trend reversals or confirmation.
- Value Line: An additional reference point that highlights the interplay between the current momentum and the signal average.
By using these three layers, the tool allows traders to see not just where the price is going, but how much force is behind the movement.
//+------------------------------------------------------------------+
//|                                    Super Relativ Vigor Index.mq4 |
//|                      Copyright © 2005, MetaQuotes Software Corp. |
//|                                       http://www.metaquotes.net/ |
//+------------------------------------------------------------------+
#property  copyright "Copyright © 2005, MetaQuotes Software Corp."
#property  link      "http://www.metaquotes.net/"
//---- indicator settings
#property  indicator_separate_window
#property  indicator_buffers 3
#property  indicator_color1  Green
#property  indicator_color2  Red
#property  indicator_color3  Yellow
//---- indicator parameters
extern int ExtRVIPeriod=10;
//---- indicator buffers
double     ExtRVIBuffer[];
double     ExtRVISignalBuffer[];
double     ExtRVIValue[];
//+------------------------------------------------------------------+
//| Custom indicator initialization function                         |
//+------------------------------------------------------------------+
int init()
  {
//---- indicator buffers mapping
   SetIndexBuffer(0,ExtRVIBuffer);
   SetIndexBuffer(1,ExtRVISignalBuffer);
   SetIndexBuffer(2,ExtRVIValue);
//---- indicator line
   SetIndexStyle(0,DRAW_LINE);
   SetIndexStyle(1,DRAW_LINE);
   SetIndexStyle(2,DRAW_LINE);
//---- drawing settings
   SetIndexDrawBegin(0,ExtRVIPeriod+3);
   SetIndexDrawBegin(1,ExtRVIPeriod+7);
   SetIndexDrawBegin(2,ExtRVIPeriod);
//---- name for DataWindow and indicator subwindow label
   IndicatorShortName("RVI("+ExtRVIPeriod+")");
   SetIndexLabel(0,"RVI");
   SetIndexLabel(1,"RVIS");
   SetIndexLabel(2,"Value");
//---- initialization done
   return(0);
  }
//+------------------------------------------------------------------+
//| Relativ Vigor Index                                              |
//+------------------------------------------------------------------+
int start()
  {
   int i,j,nLimit,nCountedBars;
   double dValueUp,dValueDown,dNum,dDeNum;
//----
   if(Bars<=ExtRVIPeriod+8) return(0);
//----
   nCountedBars=IndicatorCounted();
//---- check for possible errors
   if(nCountedBars<0) return(-1);
//---- last counted bar will be recounted
   nLimit=Bars-ExtRVIPeriod-4;
   if(nCountedBars>ExtRVIPeriod+4)
      nLimit=Bars-nCountedBars;
//---- RVI counted in the 1-st buffer
   for(i=0; i<=nLimit; i++)
     {
      dNum=0.0;
      dDeNum=0.0;
      for(j=i; j<i+ExtRVIPeriod; j++)
        {
         dValueUp=((Close[j]-Open[j])+2*(Close[j+1]-Open[j+1])+2*(Close[j+2]-Open[j+2])+(Close[j+3]-Open[j+3]))/6;
         dValueDown=((High[j]-Low[j])+2*(High[j+1]-Low[j+1])+2*(High[j+2]-Low[j+2])+(High[j+3]-Low[j+3]))/6;
         dNum+=dValueUp;
         dDeNum+=dValueDown;
        }
      if(dDeNum!=0.0)
         ExtRVIBuffer[i]=dNum/dDeNum;
         //==----==//
         //ExtRVIValue[i]=ExtRVISignalBuffer[i]-ExtRVIBuffer[i]*2;
      else
         ExtRVIBuffer[i]=dNum;
      //==----==//
      ExtRVIValue[i]=ExtRVISignalBuffer[i]+ExtRVIBuffer[i]*4;
     }
//---- signal line counted in the 2-nd buffer
   nLimit=Bars-ExtRVIPeriod-7;
   if(nCountedBars>ExtRVIPeriod+8)
      nLimit=Bars-nCountedBars+1;
   for(i=0; i<=nLimit; i++)
      ExtRVISignalBuffer[i]=(ExtRVIBuffer[i]+2*ExtRVIBuffer[i+1]+2*ExtRVIBuffer[i+2]+ExtRVIBuffer[i+3])/6;
      //==----==//
      ExtRVIValue[i]=ExtRVISignalBuffer[i]+ExtRVIBuffer[i]*4;
//----
   return(0);
  }
//+------------------------------------------------------------------+
Comments