SRDC Fibo AHA V0_1b
Download script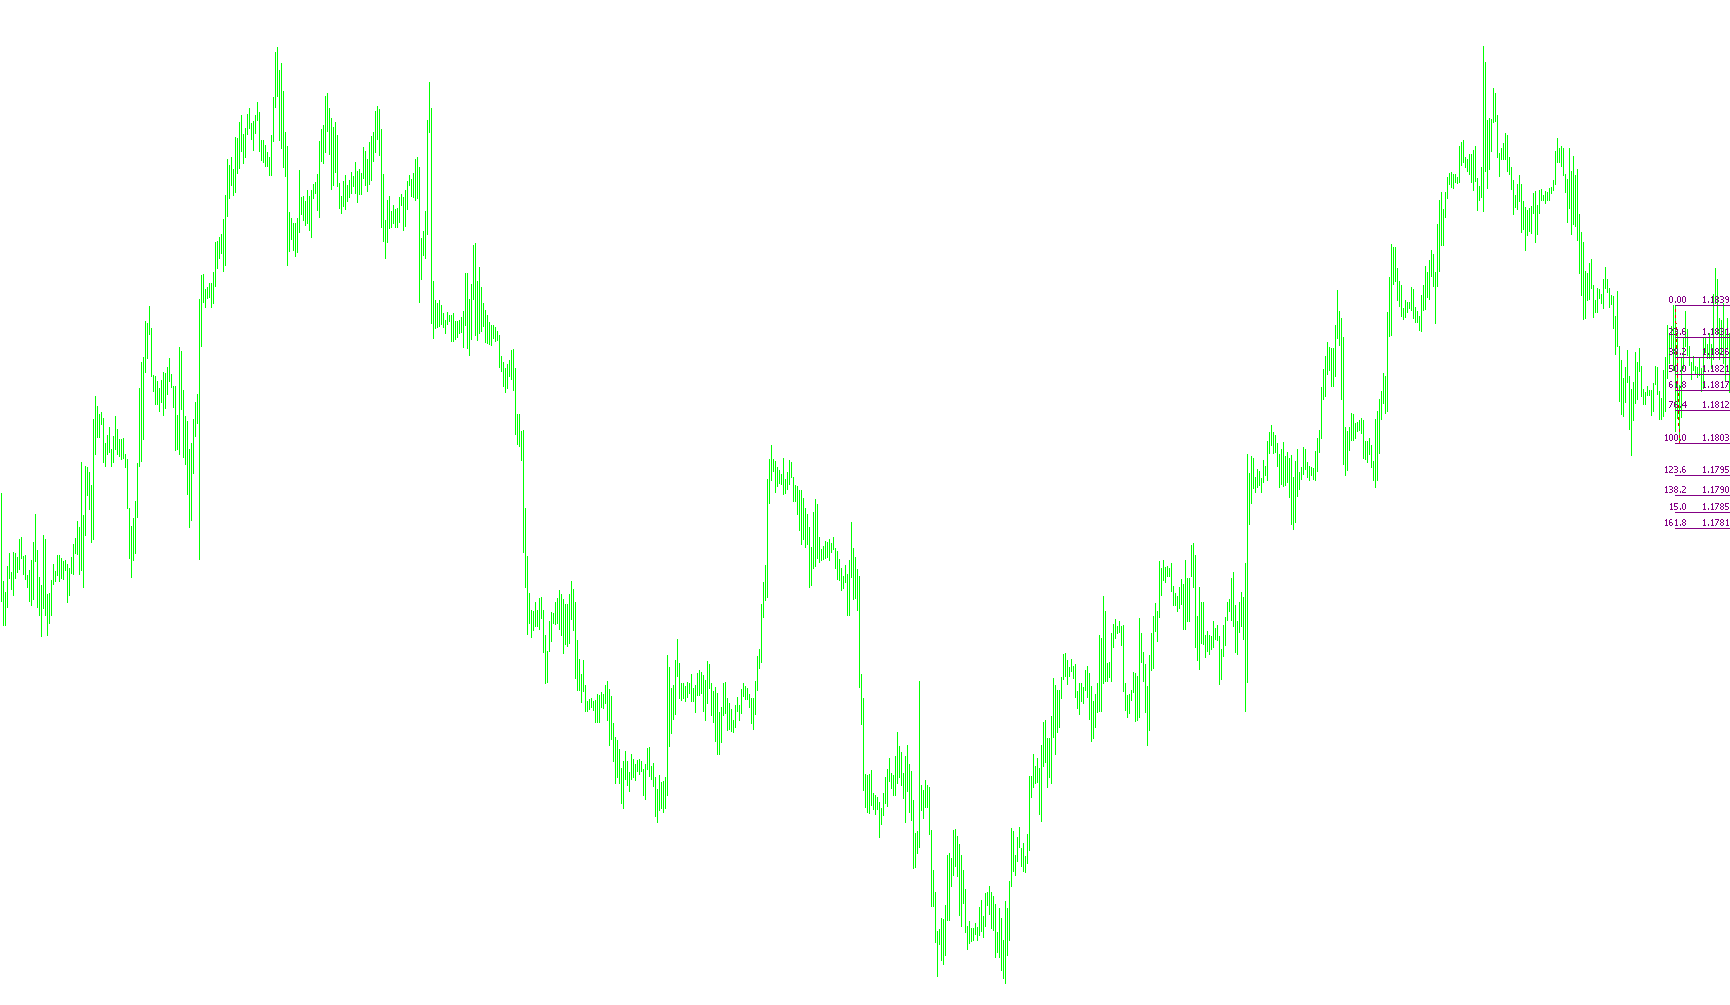
This tool is designed to automatically calculate and display Fibonacci retracement levels based on the price action of the previous trading day. It simplifies technical analysis by handling the identification of key price points, allowing traders to visualize potential support and resistance levels without manual drawing.
Core Functionality
The script monitors the market data to identify the highest and lowest prices reached during a specific daily period. Once it determines these extremes, it automatically generates a Fibonacci grid on your chart.
Key Logic Steps
- Daily Range Identification: The script scans through the price candles of the previous day to pinpoint the absolute "High" and "Low" points. It looks back through the history of the day to ensure every movement is accounted for.
- Smart Orientation: To ensure the Fibonacci levels are displayed correctly, the tool uses logic to determine the direction of the trend. It compares the timing and closing prices of the high and low points. This ensures that the "0%" and "100%" levels are placed in a way that makes sense relative to how the price moved throughout that day.
- Automated Visual Updates: The script is programmed to refresh itself. When a new trading day begins, it clears the old data and draws a fresh Fibonacci object based on the newly completed daily cycle.
- Standardized Level Mapping: The tool automatically populates 13 specific Fibonacci levels (ranging from 0% to 261.8%). These are standardized values used by many traders to identify where price might "pull back" or "extend."
User Experience
For the user, this means you don't have to manually click and drag tools across your chart every morning. The script handles the heavy lifting of calculating the daily range and ensures that the Fibonacci levels are consistently placed in the correct orientation, providing a clean, automated visual aid for your trading strategy.
//+------------------------------------------------------------------+
//|                                           SRDC Fibo AHA V0_1.mq4 |
//|                                             Copyright ?2006, AHA |
//|                                                                  |
//+------------------------------------------------------------------+
#property copyright "Copyright ?2006, AHA"
#property link      ""

#property indicator_chart_window
extern color dailyfibocolor=Purple;

string fiboobjname="Daily Fibo from SRDC Fibo AHA";
bool startup;
//+------------------------------------------------------------------+
//| Custom indicator initialization function                         |
//+------------------------------------------------------------------+
int init()
  {
//---- indicators
   startup=true;
//----
   return(0);
  }
//+------------------------------------------------------------------+
//| Custom indicator deinitialization function                       |
//+------------------------------------------------------------------+
int deinit()
  {
//----

//----
   return(0);
  }
void drawdailyfibo()
{
   if(TimeDay(Time[0])==TimeDay(Time[1])&&!startup) return;
   ObjectDelete(fiboobjname);

   datetime aday=iTime(NULL,PERIOD_D1,1);
   int bar=iBarShift(NULL,0,aday);
   double dailyhigh=0.0, dailylow=100000.0;
   int highbar, lowbar, i=bar;

   while(TimeDay(iTime(NULL,0,i))==TimeDay(iTime(NULL,0,bar)))
   {
      if(iHigh(NULL,0,i)>dailyhigh)
      {
         dailyhigh=iHigh(NULL,0,i);
         highbar=i;
      }
      if(iLow(NULL,0,i)<dailylow)
      {
         dailylow=iLow(NULL,0,i);
         lowbar=i;
      }
      i--;
   }
   if (highbar>lowbar)
      ObjectCreate(fiboobjname, OBJ_FIBO, 0, Time[lowbar], dailylow, Time[highbar], dailyhigh);
   else if (highbar<lowbar)
      ObjectCreate(fiboobjname, OBJ_FIBO, 0, Time[highbar], dailyhigh, Time[lowbar], dailylow);
   else
   {
      if (Close[highbar]>Open[highbar])
         ObjectCreate(fiboobjname, OBJ_FIBO, 0, Time[highbar], dailyhigh, Time[lowbar], dailylow);
      else if (Close[highbar]>Open[highbar])
         ObjectCreate(fiboobjname, OBJ_FIBO, 0, Time[lowbar], dailylow, Time[highbar], dailyhigh);
   }
   ObjectSet(fiboobjname, OBJPROP_LEVELCOLOR, dailyfibocolor);
   ObjectSet(fiboobjname, OBJPROP_FIBOLEVELS, 11);
     ObjectSet(fiboobjname, OBJPROP_FIRSTLEVEL, 0.0);
   ObjectSetFiboDescription(fiboobjname,0,"0.00     %$");
   ObjectSet(fiboobjname, OBJPROP_FIRSTLEVEL+1, 0.236);
   ObjectSetFiboDescription(fiboobjname,1,"23.6     %$");
   ObjectSet(fiboobjname, OBJPROP_FIRSTLEVEL+2, 0.382);
   ObjectSetFiboDescription(fiboobjname,2,"38.2     %$");
   ObjectSet(fiboobjname, OBJPROP_FIRSTLEVEL+3, 0.50);
   ObjectSetFiboDescription(fiboobjname,3,"50.0     %$");
   ObjectSet(fiboobjname, OBJPROP_FIRSTLEVEL+4, 0.618);
   ObjectSetFiboDescription(fiboobjname,4,"61.8     %$");
   ObjectSet(fiboobjname, OBJPROP_FIRSTLEVEL+5, 0.764);
   ObjectSetFiboDescription(fiboobjname,5,"76.4     %$");
   ObjectSet(fiboobjname, OBJPROP_FIRSTLEVEL+6, 1.000);
   ObjectSetFiboDescription(fiboobjname,6,"100.0     %$");
   ObjectSet(fiboobjname, OBJPROP_FIRSTLEVEL+7, 1.236);
   ObjectSetFiboDescription(fiboobjname,7,"123.6     %$");
   ObjectSet(fiboobjname, OBJPROP_FIRSTLEVEL+8, 1.382);
   ObjectSetFiboDescription(fiboobjname,8,"138.2     %$");
   ObjectSet(fiboobjname, OBJPROP_FIRSTLEVEL+9, 1.50);
      ObjectSetFiboDescription(fiboobjname,9,"15.0     %$");
   ObjectSet(fiboobjname, OBJPROP_FIRSTLEVEL+10, 1.618);
   ObjectSetFiboDescription(fiboobjname,10,"161.8     %$");
   ObjectSet(fiboobjname, OBJPROP_FIRSTLEVEL+11, 2.000);
   ObjectSetFiboDescription(fiboobjname,11,"200.0     %$");
   ObjectSet(fiboobjname, OBJPROP_FIRSTLEVEL+12, 2.618);
   ObjectSetFiboDescription(fiboobjname,12,"261.8     %$");
   ObjectsRedraw();

   return;
}//+------------------------------------------------------------------+
//| Custom indicator iteration function                              |
//+------------------------------------------------------------------+
int start()
  {
   //int    counted_bars=IndicatorCounted();
//----
   drawdailyfibo();

   startup=false;
//----
   return(0);
  }
//+------------------------------------------------------------------+
Comments