4_MA_Strength1
Indicator

4_MA_Strength1

iMA

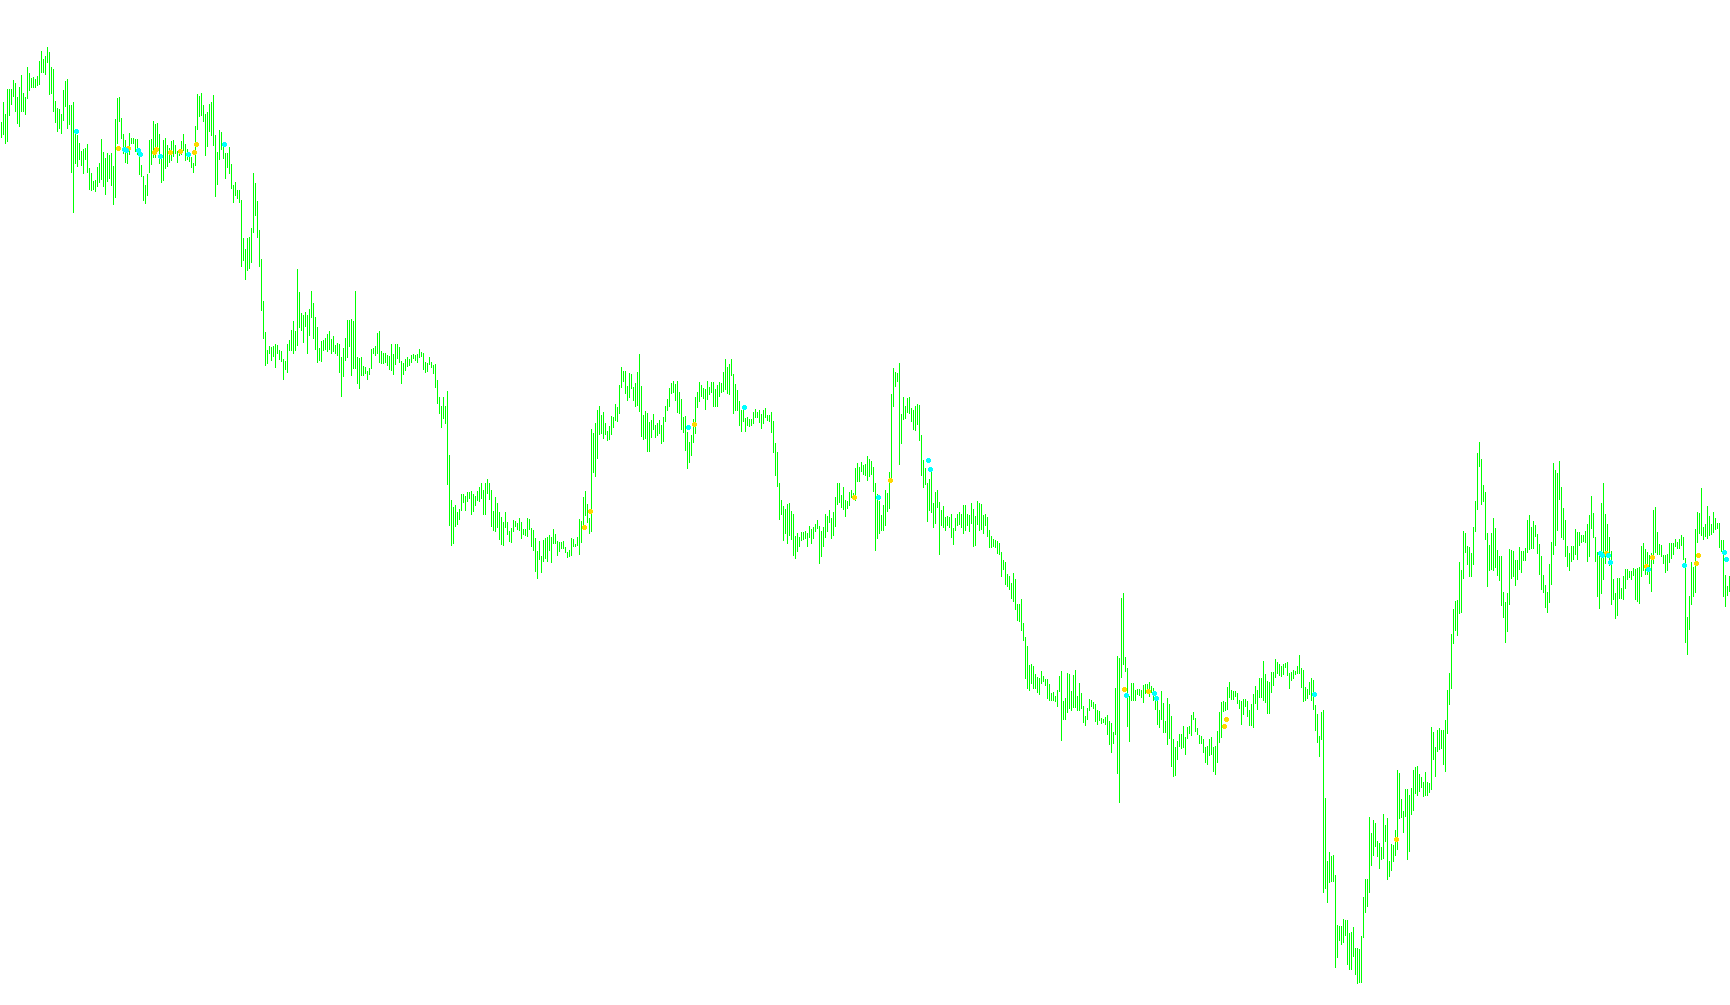
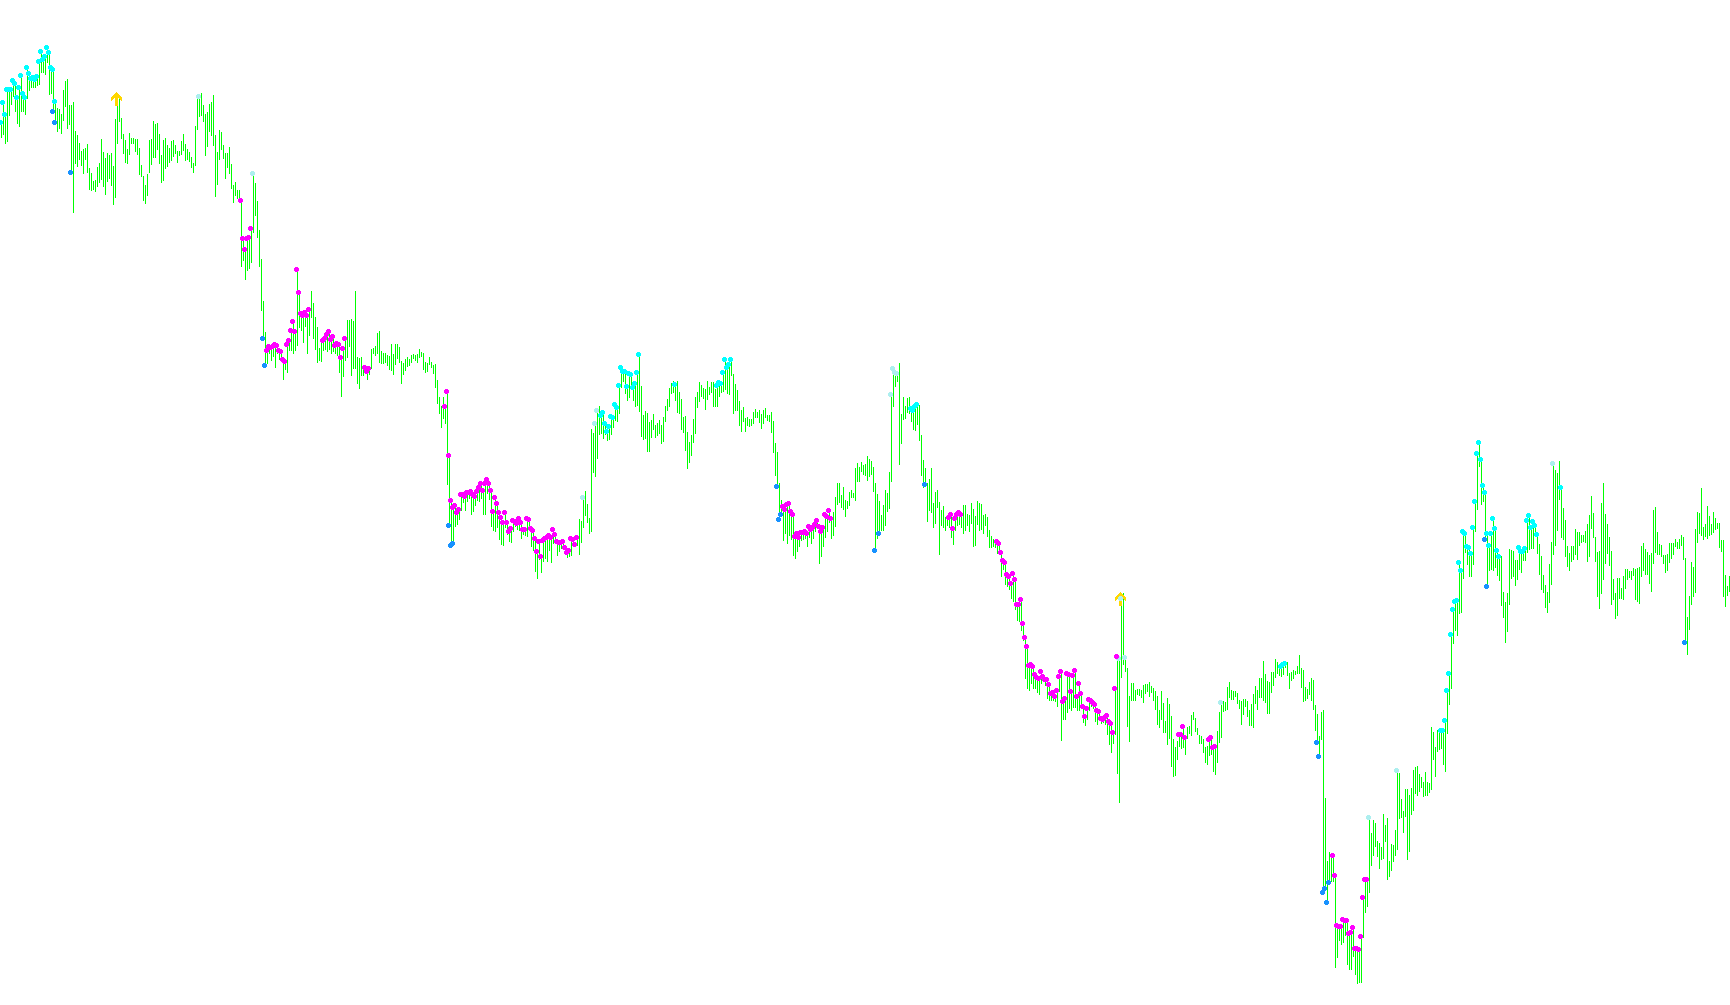
This indicator quantifies trend conviction by calculating the hierarchical stacking and relative positioning of four distinct moving averages to determine cumulative directional strength.

4_MA_Strength_v1
Indicator

4_MA_Strength_v1

iMA

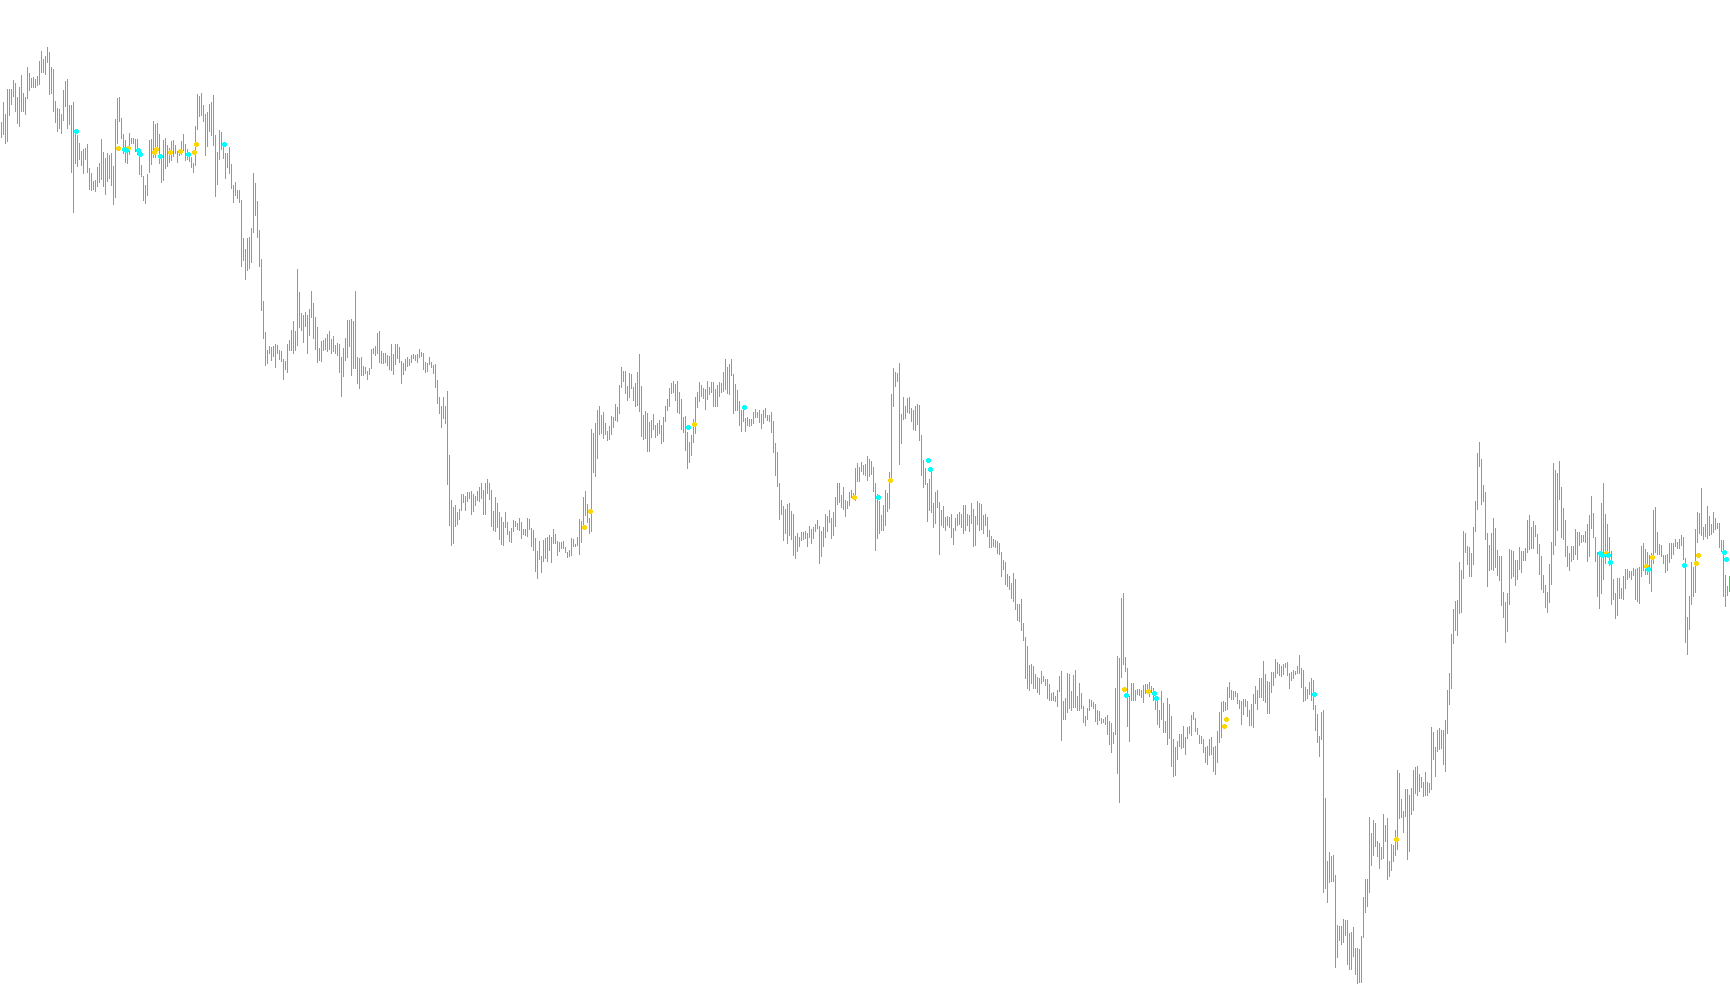
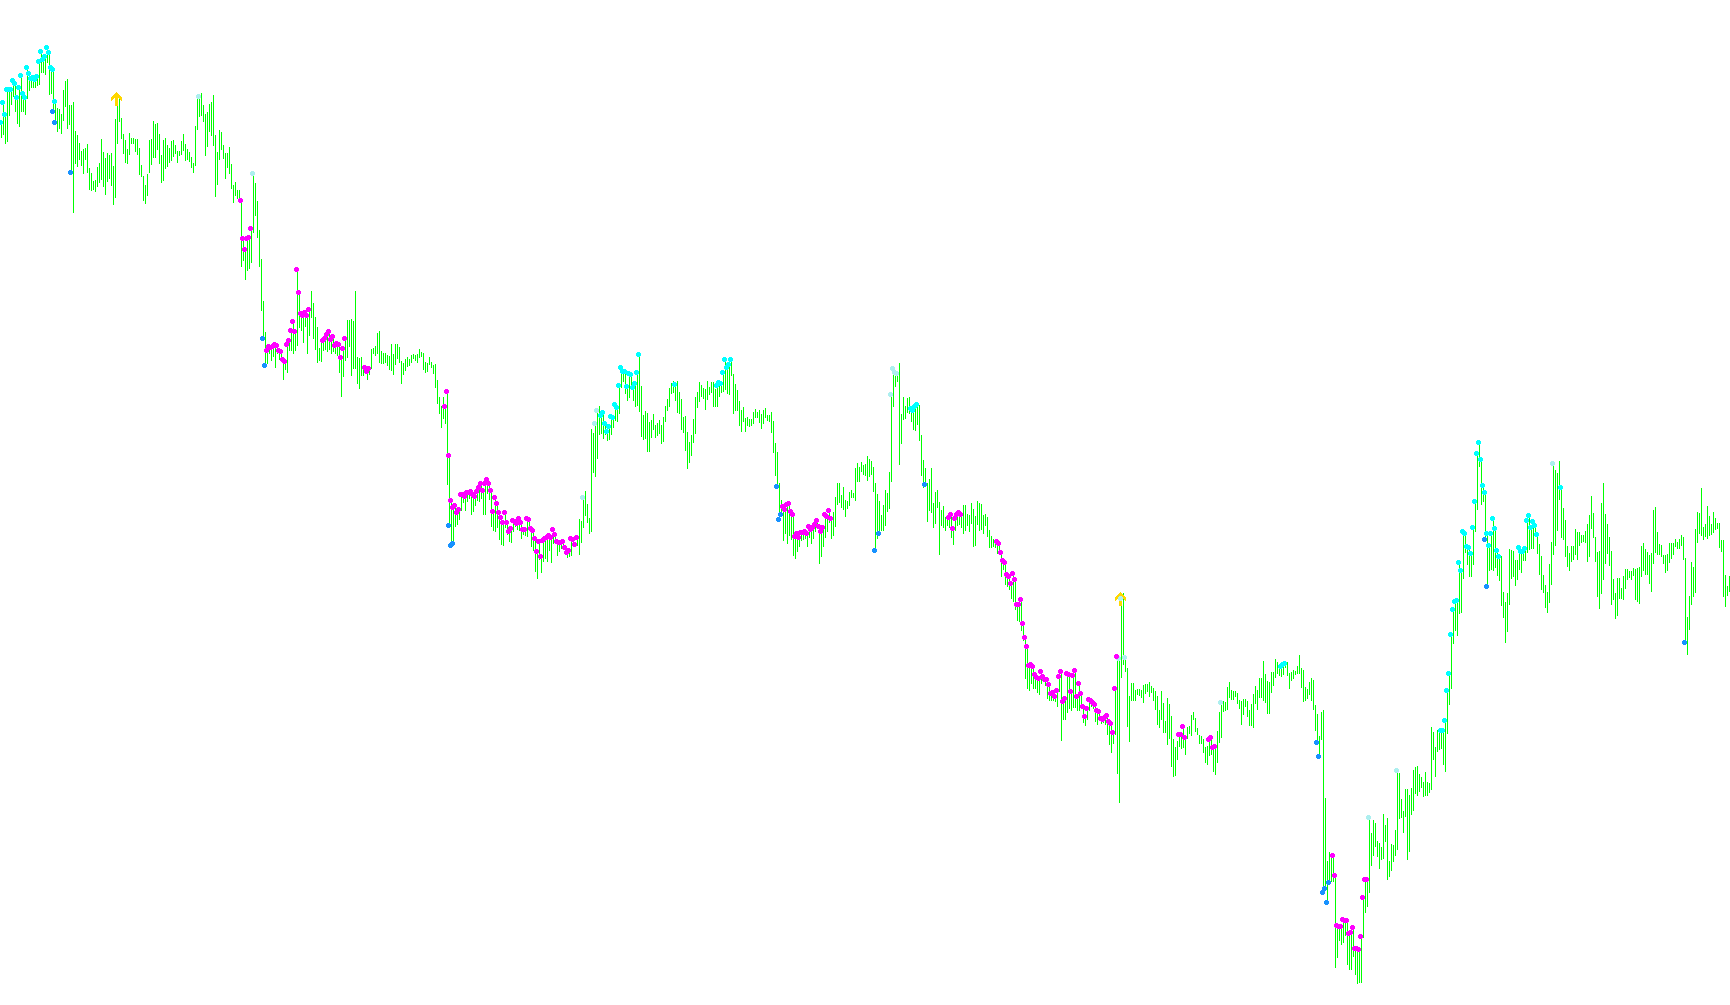
This indicator quantifies trend intensity by calculating the relative hierarchical alignment of four distinct moving averages to produce a cumulative momentum score.

Indicator

4_Period_MA1

iMA
Indicator

4_Period_MA1_v1

iMA
Indicator

4_Period_MA_Psars_V1

iMAiSAR
Indicator

4_Period_MA_Psars_V1_v1

iMAiSAR
Indicator

4_Period_MA_w.Regr.STD

iMA
Indicator

4_Trendline_v3-MKS

Indicator

4_Trendline_v3-MKS_v1

4_Trendline_v3-MKS_v2
Indicator

4_Trendline_v3-MKS_v2

This indicator identifies specific volatility windows by projecting multi-colored trendlines based on user-defined start and end timestamps synchronized with server offsets.

Indicator

4_Trendline_v3

Indicator

4_Trendline_v3_2_MKS

Indicator

4_Trendline_v3_2_MKS_v1

Indicator

4_Trendline_v3_v1

5 bar reversal v0[1][1].5
Indicator

5 bar reversal v0[1][1].5

Identifies potential trend reversals by detecting discrepancies between historical five-bar price extremes and current closing positions.

5 bar reversal v0[1][1].5_v1
Indicator

5 bar reversal v0[1][1].5_v1

This indicator identifies potential trend reversals by detecting instances where the current 5-bar high/low structure breaks out of the preceding 5-bar price range.

5 bar reversal v0[1][1].5_v2
Indicator

5 bar reversal v0[1][1].5_v2

Identifies potential trend reversals by detecting instances where current price action breaks outside of the historical high and low boundaries established over a five-bar lookback window.

5 bar reversal v1[real][1].5
Indicator

5 bar reversal v1[real][1].5

Identifies trend exhaustion by detecting price action breaches where current five-bar peak and trough extremes diverge significantly from preceding historical boundaries.

5 bar reversal v1[real][1].5_v1
Indicator

5 bar reversal v1[real][1].5_v1

The logic identifies potential trend reversals by detecting instances where the current five-bar price range significantly exceeds the preceding five-bar high or low thresholds.

5 bar reversal v1[real][1].5_v2
Indicator

5 bar reversal v1[real][1].5_v2

The indicator identifies potential trend reversals by detecting instances where current high/low price extremes break out of the established range of the preceding five-bar window.

5 day breakout
Indicator

5 day breakout

Identifies and projects the highest high and lowest low extremes established over a rolling five-day period on the daily timeframe.

5 day breakout_001
Indicator

5 day breakout_001

Identifies and projects horizontal levels based on the extreme price boundaries established over a user-defined historical period.

5 day breakout_v1
Indicator

5 day breakout_v1

Identifies and visualizes the extreme price ceiling and floor established over a rolling five-day period to detect imminent structural breakouts.

5 Day BreakOut_v2
Indicator

5 Day BreakOut_v2

Identifies and plots the highest price peaks and lowest price troughs across a rolling five-day period to highlight potential breakout zones.

5 sing zz alert
Indicator

5 sing zz alert

This indicator identifies structural market pivots by filtering price extremes and generating real-time alerts upon significant trend reversals.

5-8openEMA_Cross_Arrow_with_Alerts
Indicator

5-8openEMA_Cross_Arrow_with_Alerts

iMA

This indicator identifies and plots precise visual markers where a faster exponential moving average intersects a slower one, utilizing dynamic price range offsets for clearer signal detection.

5383-lbr-1000-pips-one-week-ki_signals1_h1-low_3-10-18_optimized
Indicator

5383-lbr-1000-pips-one-week-ki_signals1_h1-low_3-10-18_optimized

iMAiMAOnArray

The indicator identifies trend reversals by calculating the signal of Exponential Moving Average differences across M30 and H1 periods to detect synchronized momentum shifts.

54_Search_patterns
Indicator

54_Search_patterns

This indicator dynamically identifies complex harmonic price structures, including Gartley, Butterfly, Bat, and Wolf Waves, by calculating Fibonacci retracements and project targets based on a ZigZag backbone.

5days
Indicator

5days

This visual aid identifies and labels specific weekdays on the chart by dynamically detecting day transitions and rendering customizable text overlays.

5days_v1
Indicator

5days_v1

This indicator identifies and labels specific days of the week on the chart by dynamically rendering text objects at high-price offsets based on historical date transitions.

5minYANS_IND_01
Indicator

5minYANS_IND_01

iMAiSAR

This indicator identifies high-probability trend shifts by synchronizing Exponential Moving Average crossovers with Parabolic SAR volatility breakouts.

5minYANS_IND_01_v1
Indicator

5minYANS_IND_01_v1

iMAiSAR

The indicator identifies trend reversals and momentum shifts by tracking dual EMA crossovers combined with Parabolic SAR price breaches and specific period-count filters.

5minYANS_IND_02
Indicator

5minYANS_IND_02

iMAiSAR

This indicator identifies trend reversals by detecting crossovers between dual Exponential Moving Averages and Parabolic Stop_Loss levels, filtered by price proximity to the SAR volatility band.

5minYANS_IND_02_v1
Indicator

5minYANS_IND_02_v1

iMAiSAR

This indicator identifies high-probability trend reversals by synchronizing EMA momentum crossovers with Parabolic SAR threshold breaches and distance-based cross validations.

5minYANS_IND_03
Indicator

5minYANS_IND_03

iMAiSAR

This indicator identifies trend shifts by detecting crossovers between 10 and 40-period Exponential Moving Averages while tracking parabolic support/resistance dynamics.

5minYANS_IND_03_v1
Indicator

5minYANS_IND_03_v1

iMAiSAR

This indicator identifies trend shifts by detecting precise crossovers between fast and slow Exponential Moving Averages (EMA 10 and EMA 40).

5Min_01a
Indicator

5Min_01a

iRSI

This indicator identifies persistent price momentum by detecting consecutive bars where the Relative Strength Index remains above or below specific threshold levels, visualizing the duration of the trend with tiered signal markers.

5Min_01a_v1
Indicator

5Min_01a_v1

iRSI

This indicator identifies multi-bar momentum persistence by detecting consecutive Relative Strength Index values exceeding specific threshold boundaries.

5Min_rsi_01a
Indicator

5Min_rsi_01a

iRSI

This indicator identifies high-probability reversal zones and trend strengths by analyzing RSI persistence, multi-bar momentum shifts, and relative strength velocity.

5Min_rsi_01a_v1
Indicator

5Min_rsi_01a_v1

iRSI

This indicator identifies bullish and bearish momentum by detecting consecutive Relative Strength Index (RSI) thresholds and measuring rapid velocity shifts across a multi-period chain.

5min_rsi_qual_02IND
Indicator

5min_rsi_qual_02IND

iRSI

This indicator identifies bullish and bearish signals by validating whether the Relative Strength Index remains consistently above 55 or below 45 over a specific rolling lookback period.

5min_rsi_qual_02IND_v1
Indicator

5min_rsi_qual_02IND_v1

iRSI

This indicator identifies high-probability trend reversals by detecting sustained Relative Strength Index levels above or below the midpoint over a specific lookback window.

5min_rsi_qual_02IND_v2
Indicator

5min_rsi_qual_02IND_v2

iRSI

This indicator identifies precise trend transitions by detecting when the Relative Strength Index remains consistently above or below a 50-level threshold for specific historical lookback windows while failing to maintain that consistency over an extended timeframe.

5min_rsi_qual_02IND_v3
Indicator

5min_rsi_qual_02IND_v3

iRSI

This indicator identifies bullish and bearish trend shifts by detecting sustained 28-period RSI values above 55 or below 45 over a specific rolling window of eleven candles.

5min_rsi_qual_03IND
Indicator

5min_rsi_qual_03IND

iRSI

This indicator identifies multi-stage trend persistence by counting the cumulative number of periods the Relative Strength Index remains above or below the 50 midpoint to trigger sequential signals.

5min_rsi_qual_03IND_v1
Indicator

5min_rsi_qual_03IND_v1

iRSI

This indicator identifies directional strength by plotting visual signals based on the cumulative count of Relative Strength Index values exceeding or falling below the 50 equilibrium level over a rolling period.

5piprenko
Indicator

5piprenko

This script reconstructs and exports historical Renko price structures from M1 chart data by calculating price movements against a fixed range threshold.

Indicator

5_34_5

iMA
Indicator

5_34_5_003

iMA
Indicator

5_34_5_v1

iMA