Indicator

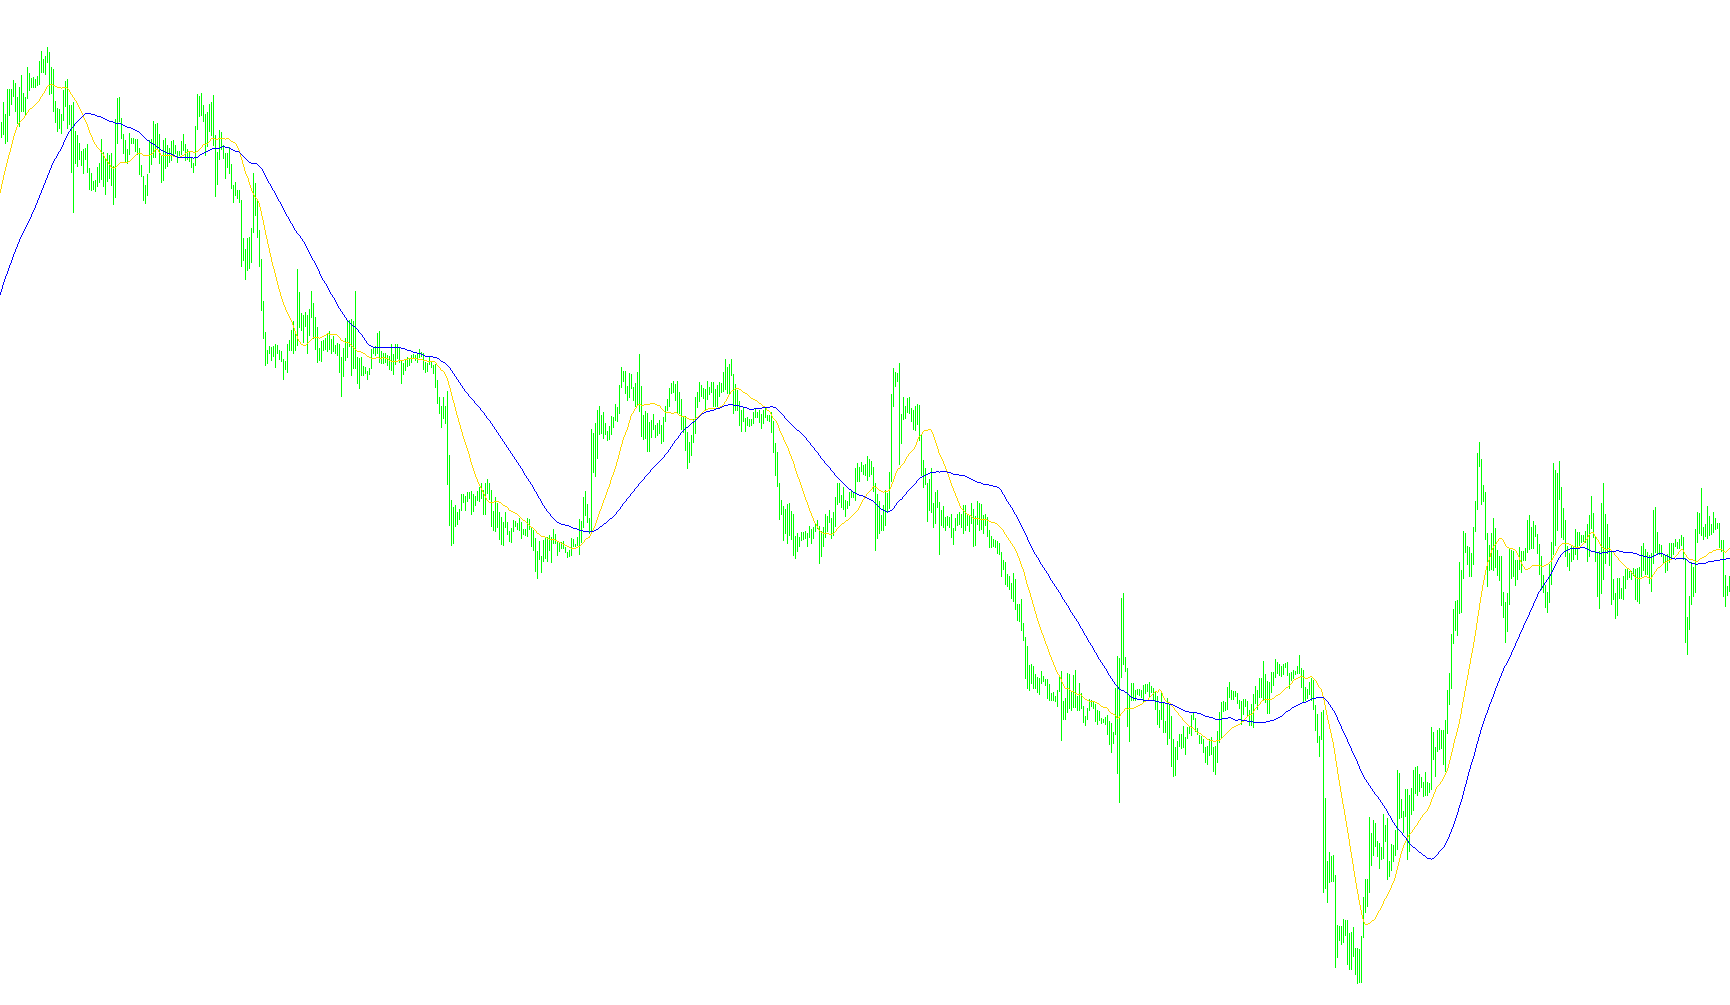
4 Period MA_v1

iMA
4 TF HAS Bar
Indicator

4 TF HAS Bar

This indicator visualizes real-time trend bias across four concurrent timeframes by aggregating smoothed Heiken Ashi price action into a synchronized, multi-layered signal window.

4 TF HAS Bar2
Indicator

4 TF HAS Bar2

This indicator visualizes concurrent bullish and bearish sentiment across four distinct timeframes by plotting smoothed Heiken Ashi price actions into a multi-layered graphical display.

4hVegasMetaTrader4hChart
Indicator

4hVegasMetaTrader4hChart

iMA

This indicator executes trend-following signals by detecting SMA crossovers filtered through weekly directional bias and multi-stage Fibonacci profit targets.

4hVegasMetaTrader4hChart_v1
Indicator

4hVegasMetaTrader4hChart_v1

iMA
4hVegasMetaTrader4hChart_v2
Indicator

4hVegasMetaTrader4hChart_v2

iMA

This indicator utilizes SMA crossovers and weekly bias filters to identify primed momentum entries, featuring multi-stage Fibonacci take-profit targets based on slope dynamics.

4hVegasMetaTrader4hChart_v3
Indicator

4hVegasMetaTrader4hChart_v3

iMA

This indicator identifies directional bias via weekly global variables and executes position entries based on multi-layered SMA crossovers with sequential Fibonacci-based price expansion exits.

4hVegasMetaTrader4hCTD
Indicator

4hVegasMetaTrader4hCTD

This indicator maps the predominant weekly directional bias by retrieving and visualizing persistent global sentiment variables across the 4-hour timeframe.

4hVegasMetaTrader4hCTD_v1
Indicator

4hVegasMetaTrader4hCTD_v1

4hVegasMetaTraderWeeklyChart(2)
Indicator

4hVegasMetaTraderWeeklyChart(2)

iMA
4hVegasMetaTraderWeeklyChart
Indicator

4hVegasMetaTraderWeeklyChart

iMA

This indicator plots a high-period exponential moving average alongside a low-period simple moving average based on the midpoint of price action to identify trend momentum.

4hVegasMetaTraderWeeklyChart_v1
Indicator

4hVegasMetaTraderWeeklyChart_v1

iMA

This indicator visualizes trend dynamics by plotting a 21-period Exponential Moving Average and a 5-period Simple Moving Average derived from the median price of the high and low ranges.

4hVegasMetaTraderWeeklyIndicator(1)
Indicator

4hVegasMetaTraderWeeklyIndicator(1)

iMA

This indicator quantifies directional momentum by measuring the rate of change in the spread between a short-term SMA and a long-term EMA to identify weekly trend acceleration.

4hVegasMetaTraderWeeklyIndicator-V11
Indicator

4hVegasMetaTraderWeeklyIndicator-V11

iMA

This indicator quantifies weekly market sentiment by calculating the rate of change between 5-period simple and 21-period exponential moving averages on a multi-timeframe basis.

4hVegasMetaTraderWeeklyIndicator-V11_v1
Indicator

4hVegasMetaTraderWeeklyIndicator-V11_v1

iMA

This indicator quantifies momentum by calculating the rate of change between a 5-period Simple Moving Average and a 21-period Exponential Moving Average on a weekly timeframe.

4hVegasMetaTraderWeeklyIndicator-V11_v2
Indicator

4hVegasMetaTraderWeeklyIndicator-V11_v2

iMA

This indicator quantifies weekly directional bias by calculating the rate of change between a 5-period Simple Moving Average and a 21-period Exponential Moving Average.

4hVegasMetaTraderWeeklyIndicator
Indicator

4hVegasMetaTraderWeeklyIndicator

iMA

This indicator quantifies weekly directional momentum by measuring the rate of change between a fast Simple Moving Average and a slow Exponential Moving Average on mid-price data.

4hVegasMetaTraderWeeklyIndicator_v1
Indicator

4hVegasMetaTraderWeeklyIndicator_v1

iMA
4h_MACD_FX_Strategy
Indicator

4h_MACD_FX_Strategy

iMA
4MAs Trend
Indicator

4MAs Trend

iMA

This indicator identifies bullish or bearish trend momentum by detecting strict sequential ordering across four distinct moving averages while highlighting periods of price consolidation.

4MAs Trend_v1
Indicator

4MAs Trend_v1

iMA

This indicator identifies bullish and bearish momentum by tracking the sequential alignment of four distinct moving averages across user-defined timeframes.

4MAs%20Trend
Indicator

4MAs%20Trend

iMA
4MAs_FlatTrend
Indicator

4MAs_FlatTrend

iMA
4MAs_Trend
Indicator

4MAs_Trend

iMA

This indicator visualizes bullish and bearish directional strength by identifying sequential stacking of four distinct moving average periods across user-defined timeframes.

Indicator

4Period_RSI_Arrows

iRSI
Indicator

4Period_RSI_Arrows_v1

iRSI
Indicator

4Period_RSI_Arrows_v2

iRSI
Indicator

4PMA-4XTRAFFIC-RSI

iBearsPoweriBullsPoweriMAiRSI
Indicator

4PMA-4XTRAFFIC-RSI_v1

iBearsPoweriBullsPoweriMAiRSI
Indicator

4PMA

iMA
Indicator

4PMA.Psars.Rgrssn.STD.V1

iMAiSAR
Indicator

4PMA.Psars.Rgrssn.STD.V1_v1

iMAiSAR
Indicator

4PMA.Psars.Rgrssn.STD.V2

iMAiSAR
Indicator

4PMA.Psars.Rgrssn.STD.V2_v1

iMAiSAR
Indicator

4PMA[1].Psars.Rgrssn.STD.V3

iMAiSAR
Indicator

4PMA[1].RSI.Rgrssn.STD.V1c

iMAiRSI
Indicator

4PMA[1].RSI.Rgrssn.STD.V1c_v1

iMAiRSI
Indicator

4PMA_1__1_.Psars.Rgrssn.STD.V3

iMAiSAR
Indicator

4PMA_v1

iMA
Indicator

4PMA_v2

iMA
4TFStochBars
Indicator

4TFStochBars

iStochastic

This indicator visualizes the relative momentum of four distinct timeframes simultaneously by plotting directional bars based on the crossover relationship between stochastic main and signal lines.

4TF_ADX
Indicator

4TF_ADX

iADX
4TF_RSI
Indicator

4TF_RSI

iRSI
4TF_StB_MT4-LevelStop-Reverse-v2_bar
Indicator

4TF_StB_MT4-LevelStop-Reverse-v2_bar

This indicator synthesizes four concurrent timeframes into a single visual display, using stochastic-based reversal logic and ATR-adjusted volatility filtering to identify synchronized trend shifts.

4TF_STC
Indicator

4TF_STC

iStochastic

This indicator identifies high-probability directional bias by synchronizing Stochastic Trend Continuum (STC) main and signal line crossovers across four distinct concurrent timeframes.

Indicator

4XTraffic_RSI_v1a

iMAiRSI
Indicator

4XTraffic_RSI_v1a_v1

iMAiRSI
Indicator

4XTraffic_RSI_v1b

iMAiRSI
Indicator

4XTraffic_RSI_v1b_v1

iMAiRSI
4_MA_Strength
Indicator

4_MA_Strength

iMA