5383-lbr-1000-pips-one-week-ki_signals1_h1-low_3-10-18_optimized
Download script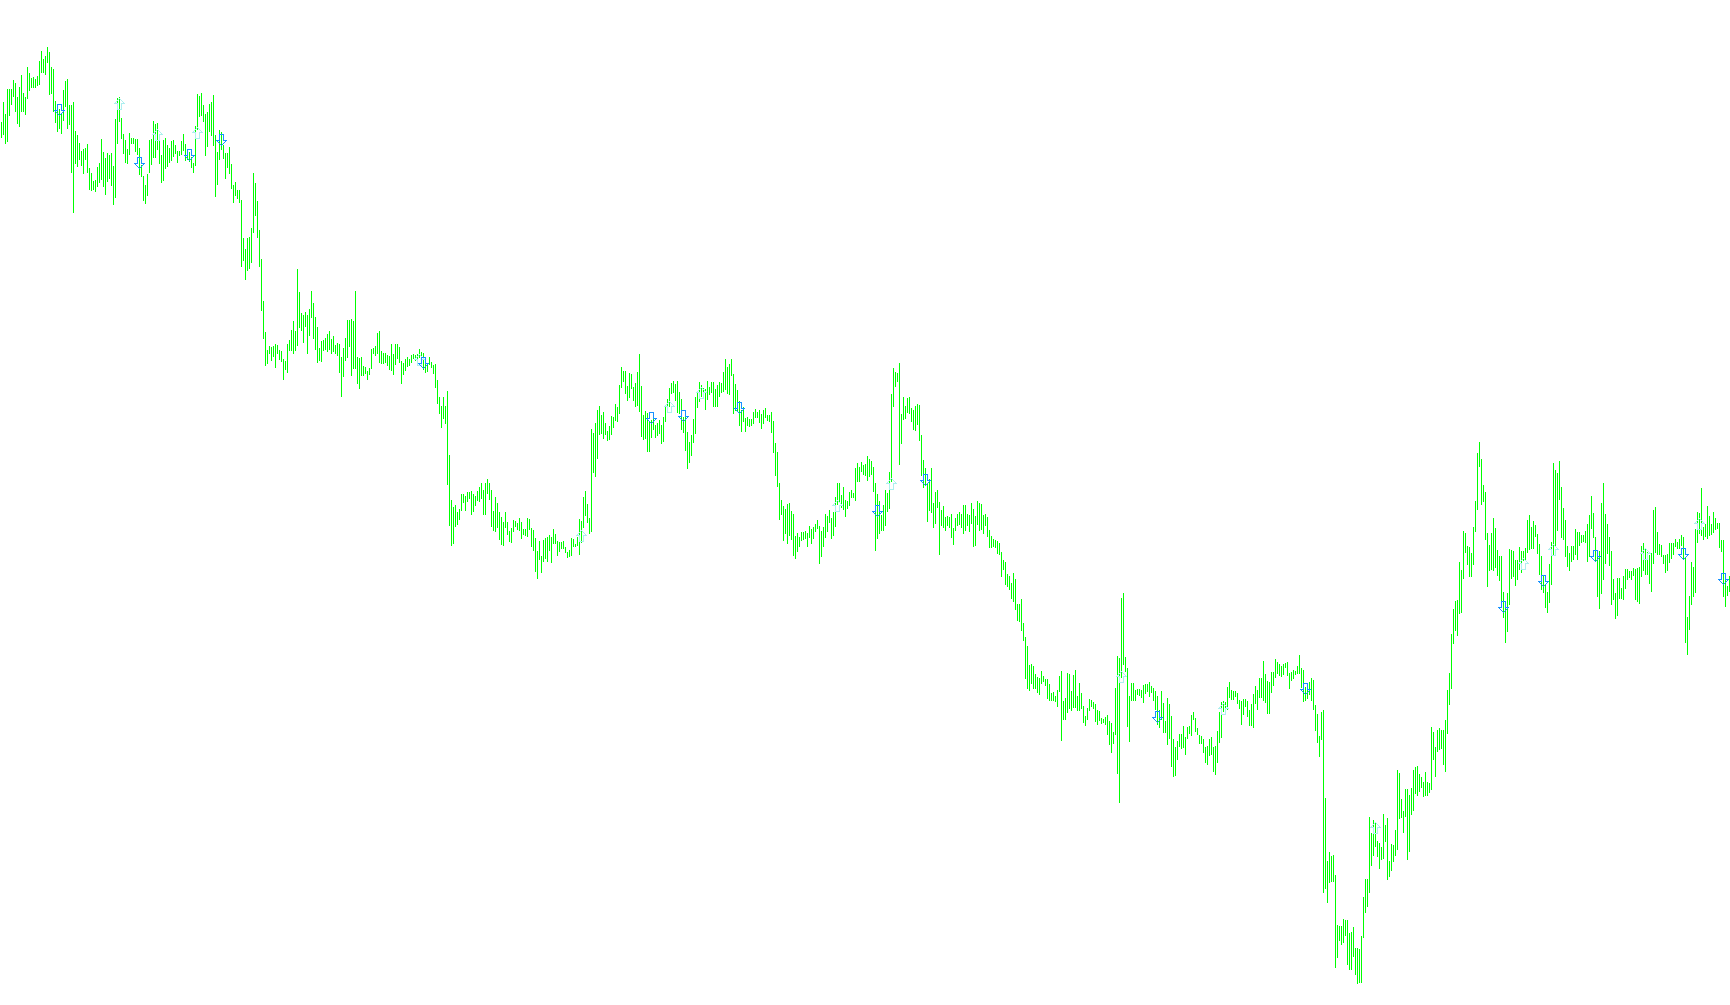
This tool is designed to analyze market trends by processing two different timeframes simultaneously: the current chart (specifically optimized for the 30-minute timeframe) and a higher timeframe (the 1-hour period). By comparing these two perspectives, it identifies specific momentum shifts to provide visual trading signals.
Core Logic Overview
The script operates through a multi-layered calculation process involving Moving Averages and "Histogram" values. Here is the step-by-step breakdown of how it functions:
1. Momentum Calculation (The Histogram) The tool begins by calculating the difference between two different Exponential Moving Averages (EMAs) on both the 30-minute and 1-hour timeframes.
- When one average is significantly higher than the other, it creates a "positive" momentum value.
- When the average is lower, it creates a "negative" momentum value. The difference between these two averages serves as the foundation for all subsequent signals.
2. Trend Smoothing (The Moving Average of the Histogram) To filter out market "noise" and minor fluctuations, the script applies a third moving average to the histogram values calculated in the previous step. This helps identify sustained trends rather than temporary price spikes. It essentially looks for the "average of the momentum."
3. Signal Generation (Cross-over Logic) The script looks for specific "crossover" moments where the smoothed momentum line flips from negative to positive, or vice versa.
- Higher Timeframe Analysis (1-Hour): The tool first checks the 1-hour data to establish a primary trend. If the smoothed momentum crosses above zero, it marks a potential upward signal; if it crosses below zero, it marks a potential downward signal.
- Current Timeframe Verification (30-Minute): Once the higher timeframe signals a change, the script looks at the current 30-minute chart to confirm the move. It ensures that the price action aligns with the overarching trend identified by the 1-hour data before placing an arrow on the chart.
Visual Output
The result of this logic is the appearance of specific arrows on your chart:
- Upward Signals: Triggered when the momentum flips positive and confirms a bullish trend across both timeframes.
- Downward Signals: Triggered when the momentum flips negative and confirms a bearish trend across both timeframes.
By utilizing this "dual-timeframe" approach, the script aims to provide signals that are grounded in broader market movements while still reacting to the immediate price action of the shorter timeframe.
//+------------------------------------------------------------------+
//|                                                KI_signals_v1.mq4 |
//|                                                          Kalenzo |
//|                                      bartlomiej.gorski@gmail.com |
//+------------------------------------------------------------------+
#property copyright "Kalenzo"
#property link      "bartlomiej.gorski@gmail.com"

#property indicator_chart_window
#property indicator_buffers 8
#property indicator_color1 AliceBlue
#property indicator_color2 AliceBlue
#property indicator_color3 DarkViolet
#property indicator_color4 DarkViolet

#property indicator_level1 0

extern int Length1 = 3;
extern int Length2 = 10;
extern int Length3 = 18;


// 60[min] = PERIOD_H1
int period = 60;


double Histo[];
double MaHisto[];

double Histoh1[];
double MaHistoh1[];

double up[];
double dn[];

double uph1[];
double dnh1[];


//+------------------------------------------------------------------+
//| Custom indicator initialization function                         |
//+------------------------------------------------------------------+
int init()
{
//---- additional buffers are used for counting
   IndicatorBuffers(8);

   SetIndexStyle(0,DRAW_ARROW,EMPTY,1);
   SetIndexStyle(1,DRAW_ARROW,EMPTY,1);

   SetIndexStyle(2,DRAW_ARROW,EMPTY,1);
   SetIndexStyle(3,DRAW_ARROW,EMPTY,1);

   SetIndexArrow(0,241);
   SetIndexArrow(1,242);

   SetIndexArrow(2,241);
   SetIndexArrow(3,242);

//   IndicatorDigits(6);

   SetIndexBuffer(0,up);
   SetIndexBuffer(1,dn);

   SetIndexBuffer(2,uph1);
   SetIndexBuffer(3,dnh1);

   SetIndexBuffer(4,Histoh1);
   SetIndexBuffer(5,MaHistoh1);
   SetIndexBuffer(6,Histo);
   SetIndexBuffer(7,MaHisto);

//   IndicatorShortName("KI signals v1");


   return(0);
}


int start()
  {
   int limit;
   int counted_bars;// = IndicatorCounted();

   int tmp, i, j, m;


   // this is fro M30 (we are on it), but we want for H1
   counted_bars = IndicatorCounted();
   if(counted_bars<0) counted_bars=0;
   if(counted_bars>0) counted_bars--;

  // ----------- H1

   // this is for H1, but counted_bars is for M30
   // so...
   limit = (Bars-counted_bars)/(period/Period()) + 1;
//   limit=iBars(Symbol(),period)-1;//counted_bars;

   for (i = 0 ;i <= limit ;i++)Histoh1[i] = iMA(Symbol(),period,Length1,0,MODE_EMA,PRICE_CLOSE,i) - iMA(Symbol(),period,Length2,0,MODE_EMA,PRICE_CLOSE,i);
   for (j = 0 ;j <= limit ;j++)MaHistoh1[j] = iMAOnArray(Histoh1,0,Length3,0,MODE_EMA,j);
   for (m = 0 ;m <= limit ;m++)
   {
      if(MaHistoh1[m+1] <= 0 && MaHistoh1[m]>0)
      {
         tmp = iTime (Symbol(),period,m);
         for (j = 0; j < Bars; j++)
         {
           if (iTime(Symbol(),0,j) == tmp)
            uph1[j-period/Period()+1] = iOpen(Symbol(),period,m)-(20*Point);
         }
      }

      if(MaHistoh1[m+1] >= 0 && MaHistoh1[m]<0)
      {
         tmp = iTime (Symbol(),period,m);
         for (j = 0; j < Bars; j++)
         {
           if (iTime(Symbol(),0,j) == tmp)
            dnh1[j-period/Period()+1] = iOpen(Symbol(),period,m)+(20*Point);
         }
      }
   }


  // ----------- M30


  counted_bars = IndicatorCounted();

  if(counted_bars<0) counted_bars=0;
  if(counted_bars>0) counted_bars--;

  limit=Bars-counted_bars;

   for (i = 0 ;i <= limit ;i++)Histo[i] = iMA(Symbol(),0,Length1,0,MODE_EMA,PRICE_CLOSE,i) - iMA(Symbol(),0,Length2,0,MODE_EMA,PRICE_CLOSE,i);
   for (j = 0 ;j <= limit ;j++)MaHisto[j] = iMAOnArray(Histo,0,Length3,0,MODE_EMA,j);
   for (m = 0 ;m <= limit ;m++)
   {
      if(MaHisto[m+1] <= 0 && MaHisto[m]>0)
      {
        for (i = m+1; i < limit; i++)
        {
          if (uph1[i] != dnh1[i])
          {
            if (uph1[i] < dnh1[i])
              up[m] = iOpen(Symbol(),0,m)-(20*Point);
            else
              break;
          }
        }
      }
      if(MaHisto[m+1] >= 0 && MaHisto[m]<0)
      {
        for (i = m+1; i < limit; i++)
        {
          if (uph1[i] != dnh1[i])
          {
            if (uph1[i] > dnh1[i])
              dn[m] = iOpen(Symbol(),0,m)+(20*Point);
            else
              break;
          }
        }
      }
   }


  return(0);
}
//+------------------------------------------------------------------+
Comments