5Min_rsi_01a_v1
Download script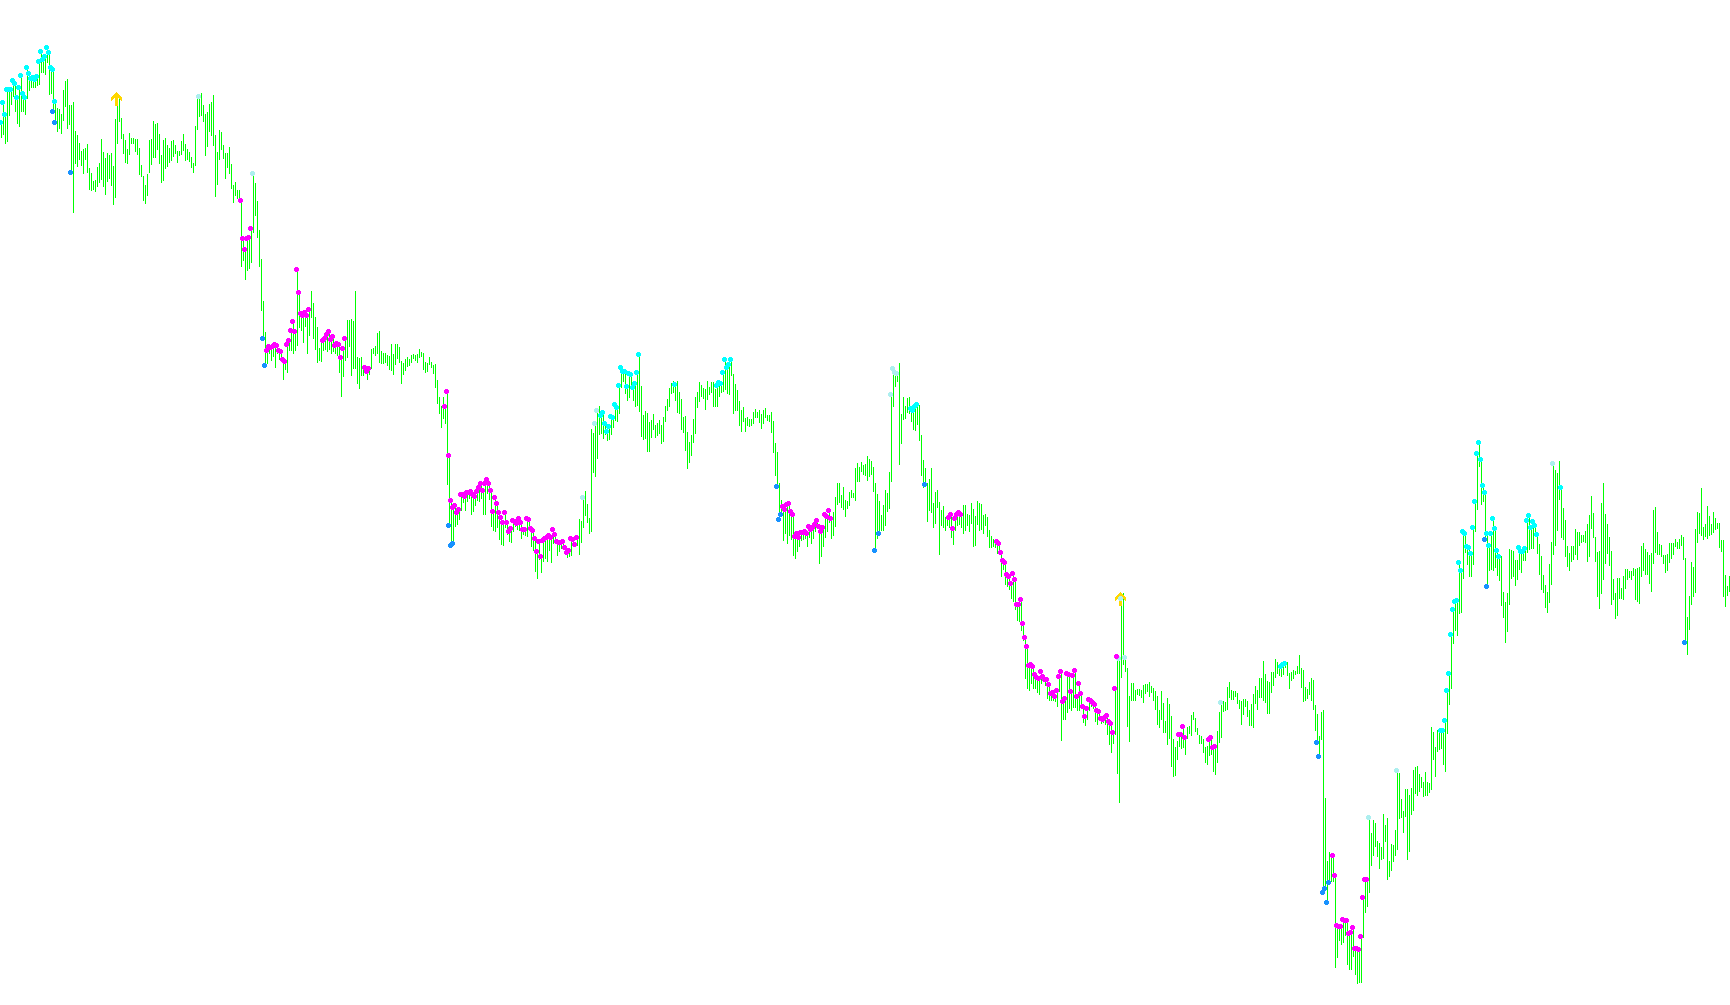
This script functions as a visual trading assistant designed to help market participants identify specific momentum shifts and trend transitions by analyzing various technical indicators simultaneously. Rather than relying on a single piece of data, it processes multiple layers of information to highlight potential entry or exit points directly on the price chart.
Core Logic Overview
The tool primarily focuses on identifying "momentum extremes" and "reversal signals." It achieves this by calculating several key financial metrics—including the Relative Strength Index (RSI), Moving Averages, and Stochastic oscillators—and then applying specific logical filters to them.
Here is a breakdown of how the logic works:
1. Momentum Trend Identification The script monitors the strength of price movement over a specific timeframe. It looks for "clusters" of data where the momentum remains consistently high or low. For example, if the momentum indicator stays above a certain threshold for several consecutive periods, the script recognizes a sustained bullish trend. If it remains below a certain threshold, it recognizes a sustained bearish trend.
2. Reversal and Exhaustion Signals A significant part of the logic is designed to catch "exhaustion"—moments where a trend has pushed too far and might be about to snap back in the opposite direction. It does this by comparing current momentum against previous values. If the current strength is significantly higher or lower than it was a few steps back, the script triggers a visual alert, suggesting that the price may be overextended.
3. Cross-Over Logic The script also looks for sharp "breakouts" in momentum. It checks if the current price strength has suddenly surged or dropped compared to its position from several bars ago. These are treated as high-velocity movements and are highlighted to show where the market is accelerating quickly.
Visual Output
To make this data easy for a trader to read at a glance, the script translates these complex calculations into visual markers on the chart:
- Arrows: These appear at specific price points to signal potential "Buy" or "Sell" opportunities based on momentum reversals and rapid changes in trend strength.
- Dots/Squares: These serve as additional confirmation marks, highlighting areas where different technical conditions (such as sustained trends or specific momentum thresholds) are being met simultaneously.
By combining these various layers of analysis into a single visual display, the script aims to filter out market "noise," allowing the user to see clearly where the trend is strongest and where it may be reaching a turning point.
/*-----------------------------+
|			       |
| Shared by www.Aptrafx.com    |
|			       |
+------------------------------*/

//+------------------------------------------------------------------+
//| 10 Minute trader                                                 |
//+------------------------------------------------------------------+
#property copyright "Ron T"
#property link      "http://www.lightpatch.com"

#property indicator_chart_window
#property indicator_buffers 7
#property indicator_color1 HotPink  // arrow up
#property indicator_color2 HotPink  // arrow down
#property indicator_color3 Aqua
#property indicator_color4 Red
#property indicator_color5 White
#property indicator_color6 HotPink
#property indicator_color7 LimeGreen

//---- buffers
double ExtMapBuffer1[];
double ExtMapBuffer2[];
double ExtMapBuffer3[];
double ExtMapBuffer4[];
double ExtMapBuffer5[];
double ExtMapBuffer6[];
double ExtMapBuffer7[];


// User Input


//+------------------------------------------------------------------+
//| Custom indicator initialization function                         |
//|------------------------------------------------------------------|

int init()
  {

   // 233 up arrow
   // 234 down arrow
   // 159 big dot
   // 168 open square

   SetIndexStyle(0,DRAW_ARROW);
   SetIndexBuffer(0, ExtMapBuffer1);
   SetIndexArrow(0,233);  //up

   SetIndexStyle(1,DRAW_ARROW);
   SetIndexBuffer(1, ExtMapBuffer2);
   SetIndexArrow(1,234);  //down

   SetIndexStyle(2,DRAW_ARROW);
   SetIndexBuffer(2, ExtMapBuffer3);
   SetIndexArrow(2,159);

   SetIndexStyle(3,DRAW_ARROW);
   SetIndexBuffer(3, ExtMapBuffer4);
   SetIndexArrow(3,159);

   SetIndexStyle(4,DRAW_ARROW);
   SetIndexBuffer(4, ExtMapBuffer5);
   SetIndexArrow(4,159);

   SetIndexStyle(5,DRAW_ARROW);
   SetIndexBuffer(5, ExtMapBuffer6);
   SetIndexArrow(5,159);

   SetIndexStyle(6,DRAW_ARROW);
   SetIndexBuffer(6, ExtMapBuffer7);
   SetIndexArrow(6,159);

   return(0);
  }


//+------------------------------------------------------------------+
//| Custor indicator deinitialization function                       |
//+------------------------------------------------------------------+
int deinit()
  {
   int i;

   for( i=0; i<Bars; i++ ) ExtMapBuffer1[i]=0;
   for( i=0; i<Bars; i++ ) ExtMapBuffer2[i]=0;
   for( i=0; i<Bars; i++ ) ExtMapBuffer3[i]=0;
   for( i=0; i<Bars; i++ ) ExtMapBuffer4[i]=0;
   for( i=0; i<Bars; i++ ) ExtMapBuffer5[i]=0;
   for( i=0; i<Bars; i++ ) ExtMapBuffer6[i]=0;
   for( i=0; i<Bars; i++ ) ExtMapBuffer7[i]=0;

   return(0);
  }


//+------------------------------------------------------------------+
//| Custom indicator iteration function                              |
//+------------------------------------------------------------------+
int start()
  {
   double    wma=0,    wma_p=0;  // linear Weighted Moving Average & Previous
   double    sma=0,    sma_p=0;  // Simple Moving Average & Previous
   double stochm=0;              // STOCHastic Main
   double stochm1=0, stochm2=0;  // long chain stochm 1&2
   double stochm3=0, stochm4=0;  // long chain stochm 3&4
   double stochs=0;              // STOCHastic Signal
   double stochs1=0, stochs2=0;  // long chain stochs 1&2
   double stochs3=0, stochs4=0;  // long chain stochs 3&4
   double  macdm=0;              // Moving Average Convergance Divergance Main
   double  macds=0;              // Moving Average Convergance Divergance Signal
   double   rsi0=0;              // Relative Strength Indicator
   double   rsi1=0,     rsi2=0;  // long chain rsi 1&2
   double   rsi3=0,     rsi4=0;  // long chain rsi 3&4
   double   rsi5=0,     rsi6=0;  // long chain rsi 3&4
   double   rsi7=0;              // long chain rsi 3&4

   int pos=Bars-100;             // leave room for moving average periods

   while(pos>=0)
     {

      rsi0=iRSI(Symbol(),0,28,PRICE_CLOSE,pos+0);
      rsi1=iRSI(Symbol(),0,28,PRICE_CLOSE,pos+1);
      rsi2=iRSI(Symbol(),0,28,PRICE_CLOSE,pos+2);
      rsi3=iRSI(Symbol(),0,28,PRICE_CLOSE,pos+3);
      rsi4=iRSI(Symbol(),0,28,PRICE_CLOSE,pos+4);
      rsi5=iRSI(Symbol(),0,28,PRICE_CLOSE,pos+5);
      rsi6=iRSI(Symbol(),0,28,PRICE_CLOSE,pos+6);
      rsi7=iRSI(Symbol(),0,28,PRICE_CLOSE,pos+7);

      if (rsi0>=55 &&  rsi1>=55 &&  rsi2>=55 &&  rsi3>=55 &&  rsi4>=55 &&  rsi5>=55)
        {
         ExtMapBuffer5[pos]=High[pos];
        }

      if (rsi0<=45 &&  rsi1<=45 &&  rsi2<=45 &&  rsi3<=45 &&  rsi4<=45 &&  rsi5<=45)
        {
         ExtMapBuffer6[pos]=High[pos];
        }


//      if (rsi0>=55 && ( rsi1<45 || rsi2<45 || rsi3<45 || rsi4<45 ) )
      if (rsi0>=55 && (rsi1<45 || rsi2<45 || rsi3<45) )
        {
         ExtMapBuffer1[pos]=High[pos];
        }
//      if (rsi0<=45 && ( rsi1>55 || rsi2>55 || rsi3>55 || rsi4>55 ) )
      if (rsi0<=45 && (rsi1>55 || rsi2>55 || rsi3>55) )
        {
         ExtMapBuffer2[pos]=Low[pos];
        }


      if (rsi0-rsi4 >= 10)
        {
         ExtMapBuffer3[pos]=High[pos]; //blue
        }
      if (rsi0-rsi4 <= -10)
        {
         ExtMapBuffer4[pos]=Low[pos];  //red
        }

 	   pos--;
     }

   return(0);
  }
//+------------------------------------------------------------------+
Comments