5Min_rsi_01a
Download script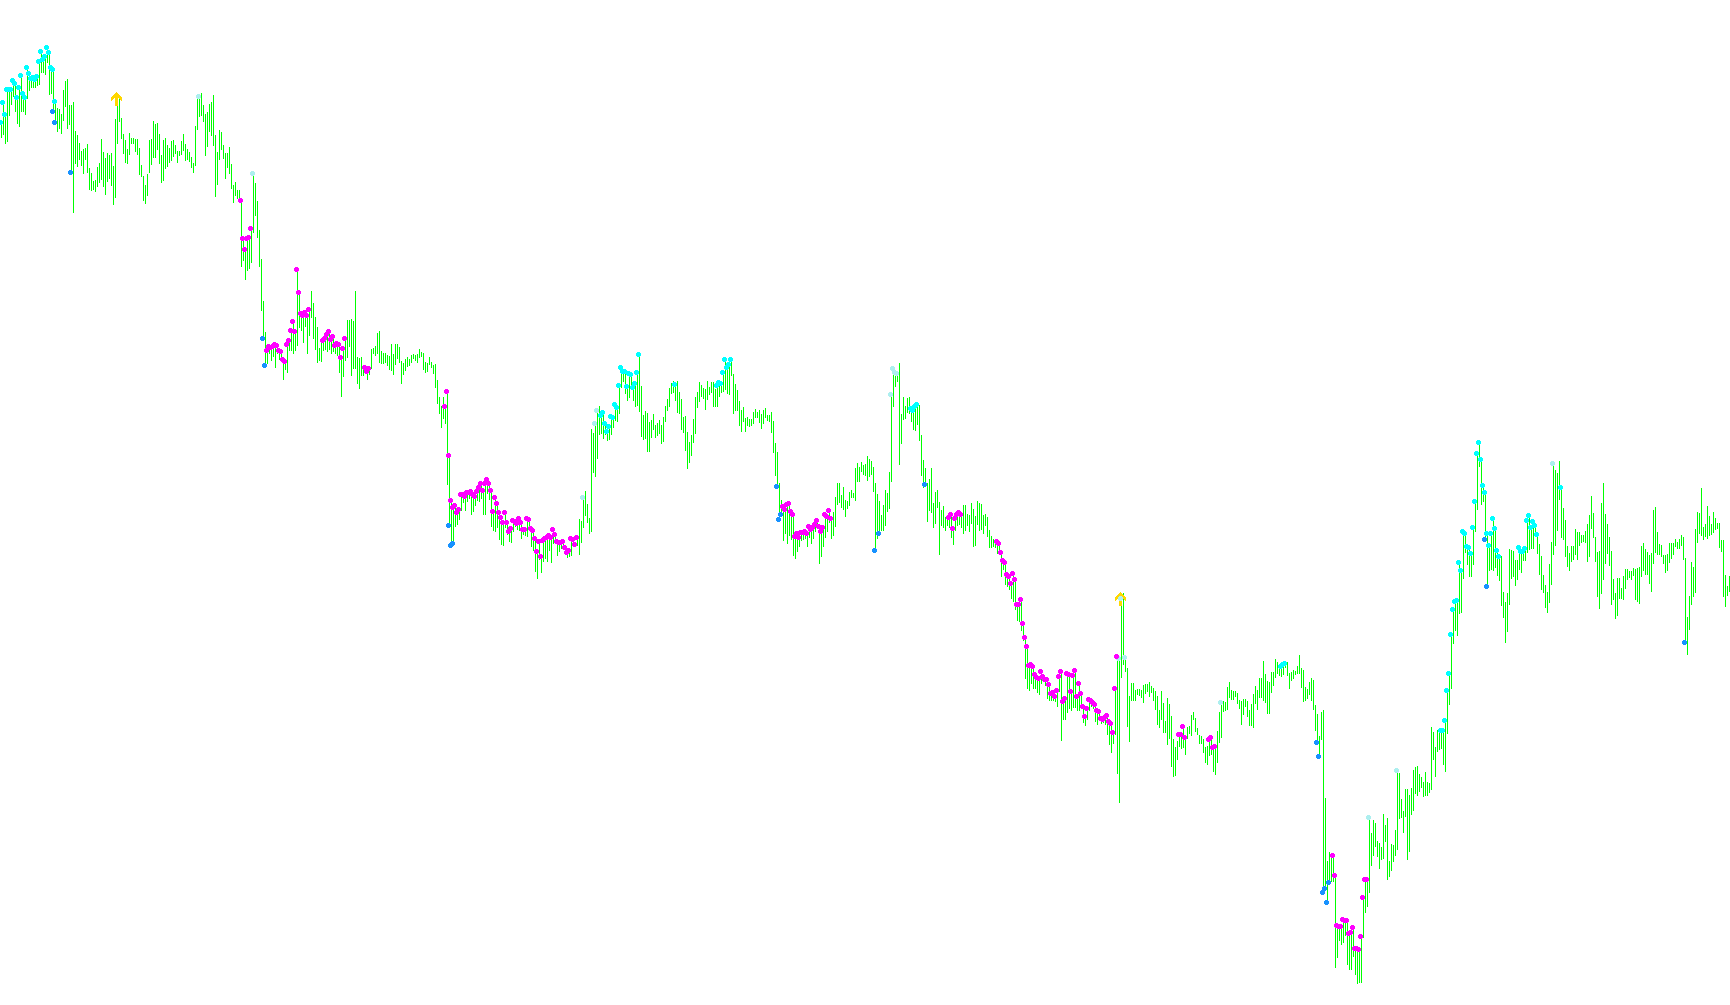
Technical Overview: 10 Minute Trader Logic
The "10 Minute Trader" is a technical analysis tool designed to identify potential market trends and momentum shifts by evaluating the Relative Strength Index (RSI) over a specific timeframe. Rather than relying on a single data point, this script analyzes a sequence of historical price movements to determine whether the market is showing sustained strength, exhaustion, or sudden reversals.
Core Mechanics
The logic operates by scanning historical price data and calculating the RSI—a standard momentum oscillator—across multiple consecutive periods. It specifically looks for patterns in these values to trigger various visual signals on your chart:
1. Momentum Strength & Exhaustion (Trend Identification) The script monitors whether the RSI remains consistently above or below certain thresholds over a six-period window:
- Sustained Strength: If the RSI stays consistently high (above 55) for six consecutive periods, it marks a point of significant upward momentum.
- Sustained Weakness: Conversely, if the RSI remains consistently low (below 45) for six consecutive periods, it identifies a zone of dominant downward momentum.
2. Reversal Detection (Mean Reversion) The tool also looks for "breakout" behavior where current momentum deviates sharply from the immediate past:
- Bearish Reversals: If the current RSI is high (above 55) but the preceding periods were low (below 45), it suggests a potential trend shift or a sharp move that may be losing steam.
- Bullish Reversals: If the current RSI is low (below 45) while the preceding periods were high (above 55), the script identifies a potential bottoming out of the price action.
3. Velocity and Momentum Shifts Beyond just the absolute values of the RSI, the script measures the speed of price movement by comparing the current RSI value to its position four periods prior:
- Aggressive Upswing: If the difference between the current RSI and the RSI from four periods ago is greater than or equal to 10, a signal is generated indicating a sharp increase in velocity.
- Aggressive Downswing: If that same difference is -10 or lower, it indicates a rapid acceleration of downward price movement.
Visual Summary
The script translates these mathematical conditions into visual cues directly on the trading chart:
- Upward Arrows: Identify bullish momentum and potential entry points for "buy" positions.
- Downward Arrows: Identify bearish momentum and potential areas to look for "sell" opportunities.
- Dots/Markers: Highlight specific zones of high volatility, sustained trends, or significant momentum shifts based on the RSI thresholds described above.
//+------------------------------------------------------------------+
//| 10 Minute trader                                                 |
//+------------------------------------------------------------------+
#property copyright "Ron T"
#property link      "http://www.lightpatch.com"

#property indicator_chart_window
#property indicator_buffers 7
#property indicator_color1 HotPink  // arrow up
#property indicator_color2 HotPink  // arrow down
#property indicator_color3 Aqua
#property indicator_color4 Red
#property indicator_color5 White
#property indicator_color6 HotPink
#property indicator_color7 LimeGreen

//---- buffers
double ExtMapBuffer1[];
double ExtMapBuffer2[];
double ExtMapBuffer3[];
double ExtMapBuffer4[];
double ExtMapBuffer5[];
double ExtMapBuffer6[];
double ExtMapBuffer7[];


// User Input


//+------------------------------------------------------------------+
//| Custom indicator initialization function                         |
//|------------------------------------------------------------------|

int init()
  {

   // 233 up arrow
   // 234 down arrow
   // 159 big dot
   // 168 open square

   SetIndexStyle(0,DRAW_ARROW);
   SetIndexBuffer(0, ExtMapBuffer1);
   SetIndexArrow(0,233);  //up

   SetIndexStyle(1,DRAW_ARROW);
   SetIndexBuffer(1, ExtMapBuffer2);
   SetIndexArrow(1,234);  //down

   SetIndexStyle(2,DRAW_ARROW);
   SetIndexBuffer(2, ExtMapBuffer3);
   SetIndexArrow(2,159);

   SetIndexStyle(3,DRAW_ARROW);
   SetIndexBuffer(3, ExtMapBuffer4);
   SetIndexArrow(3,159);

   SetIndexStyle(4,DRAW_ARROW);
   SetIndexBuffer(4, ExtMapBuffer5);
   SetIndexArrow(4,159);

   SetIndexStyle(5,DRAW_ARROW);
   SetIndexBuffer(5, ExtMapBuffer6);
   SetIndexArrow(5,159);

   SetIndexStyle(6,DRAW_ARROW);
   SetIndexBuffer(6, ExtMapBuffer7);
   SetIndexArrow(6,159);

   return(0);
  }


//+------------------------------------------------------------------+
//| Custor indicator deinitialization function                       |
//+------------------------------------------------------------------+
int deinit()
  {
   int i;

   for( i=0; i<Bars; i++ ) ExtMapBuffer1[i]=0;
   for( i=0; i<Bars; i++ ) ExtMapBuffer2[i]=0;
   for( i=0; i<Bars; i++ ) ExtMapBuffer3[i]=0;
   for( i=0; i<Bars; i++ ) ExtMapBuffer4[i]=0;
   for( i=0; i<Bars; i++ ) ExtMapBuffer5[i]=0;
   for( i=0; i<Bars; i++ ) ExtMapBuffer6[i]=0;
   for( i=0; i<Bars; i++ ) ExtMapBuffer7[i]=0;

   return(0);
  }


//+------------------------------------------------------------------+
//| Custom indicator iteration function                              |
//+------------------------------------------------------------------+
int start()
  {
   double    wma=0,    wma_p=0;  // linear Weighted Moving Average & Previous
   double    sma=0,    sma_p=0;  // Simple Moving Average & Previous
   double stochm=0;              // STOCHastic Main
   double stochm1=0, stochm2=0;  // long chain stochm 1&2
   double stochm3=0, stochm4=0;  // long chain stochm 3&4
   double stochs=0;              // STOCHastic Signal
   double stochs1=0, stochs2=0;  // long chain stochs 1&2
   double stochs3=0, stochs4=0;  // long chain stochs 3&4
   double  macdm=0;              // Moving Average Convergance Divergance Main
   double  macds=0;              // Moving Average Convergance Divergance Signal
   double   rsi0=0;              // Relative Strength Indicator
   double   rsi1=0,     rsi2=0;  // long chain rsi 1&2
   double   rsi3=0,     rsi4=0;  // long chain rsi 3&4
   double   rsi5=0,     rsi6=0;  // long chain rsi 3&4
   double   rsi7=0;              // long chain rsi 3&4

   int pos=Bars-100;             // leave room for moving average periods

   while(pos>=0)
     {

      rsi0=iRSI(Symbol(),0,28,PRICE_CLOSE,pos+0);
      rsi1=iRSI(Symbol(),0,28,PRICE_CLOSE,pos+1);
      rsi2=iRSI(Symbol(),0,28,PRICE_CLOSE,pos+2);
      rsi3=iRSI(Symbol(),0,28,PRICE_CLOSE,pos+3);
      rsi4=iRSI(Symbol(),0,28,PRICE_CLOSE,pos+4);
      rsi5=iRSI(Symbol(),0,28,PRICE_CLOSE,pos+5);
      rsi6=iRSI(Symbol(),0,28,PRICE_CLOSE,pos+6);
      rsi7=iRSI(Symbol(),0,28,PRICE_CLOSE,pos+7);

      if (rsi0>=55 &&  rsi1>=55 &&  rsi2>=55 &&  rsi3>=55 &&  rsi4>=55 &&  rsi5>=55)
        {
         ExtMapBuffer5[pos]=High[pos];
        }

      if (rsi0<=45 &&  rsi1<=45 &&  rsi2<=45 &&  rsi3<=45 &&  rsi4<=45 &&  rsi5<=45)
        {
         ExtMapBuffer6[pos]=High[pos];
        }


//      if (rsi0>=55 && ( rsi1<45 || rsi2<45 || rsi3<45 || rsi4<45 ) )
      if (rsi0>=55 && (rsi1<45 || rsi2<45 || rsi3<45) )
        {
         ExtMapBuffer1[pos]=High[pos];
        }
//      if (rsi0<=45 && ( rsi1>55 || rsi2>55 || rsi3>55 || rsi4>55 ) )
      if (rsi0<=45 && (rsi1>55 || rsi2>55 || rsi3>55) )
        {
         ExtMapBuffer2[pos]=Low[pos];
        }


      if (rsi0-rsi4 >= 10)
        {
         ExtMapBuffer3[pos]=High[pos]; //blue
        }
      if (rsi0-rsi4 <= -10)
        {
         ExtMapBuffer4[pos]=Low[pos];  //red
        }

 	   pos--;
     }

   return(0);
  }
//+------------------------------------------------------------------+
Comments