5min_rsi_qual_03IND_v1
Download script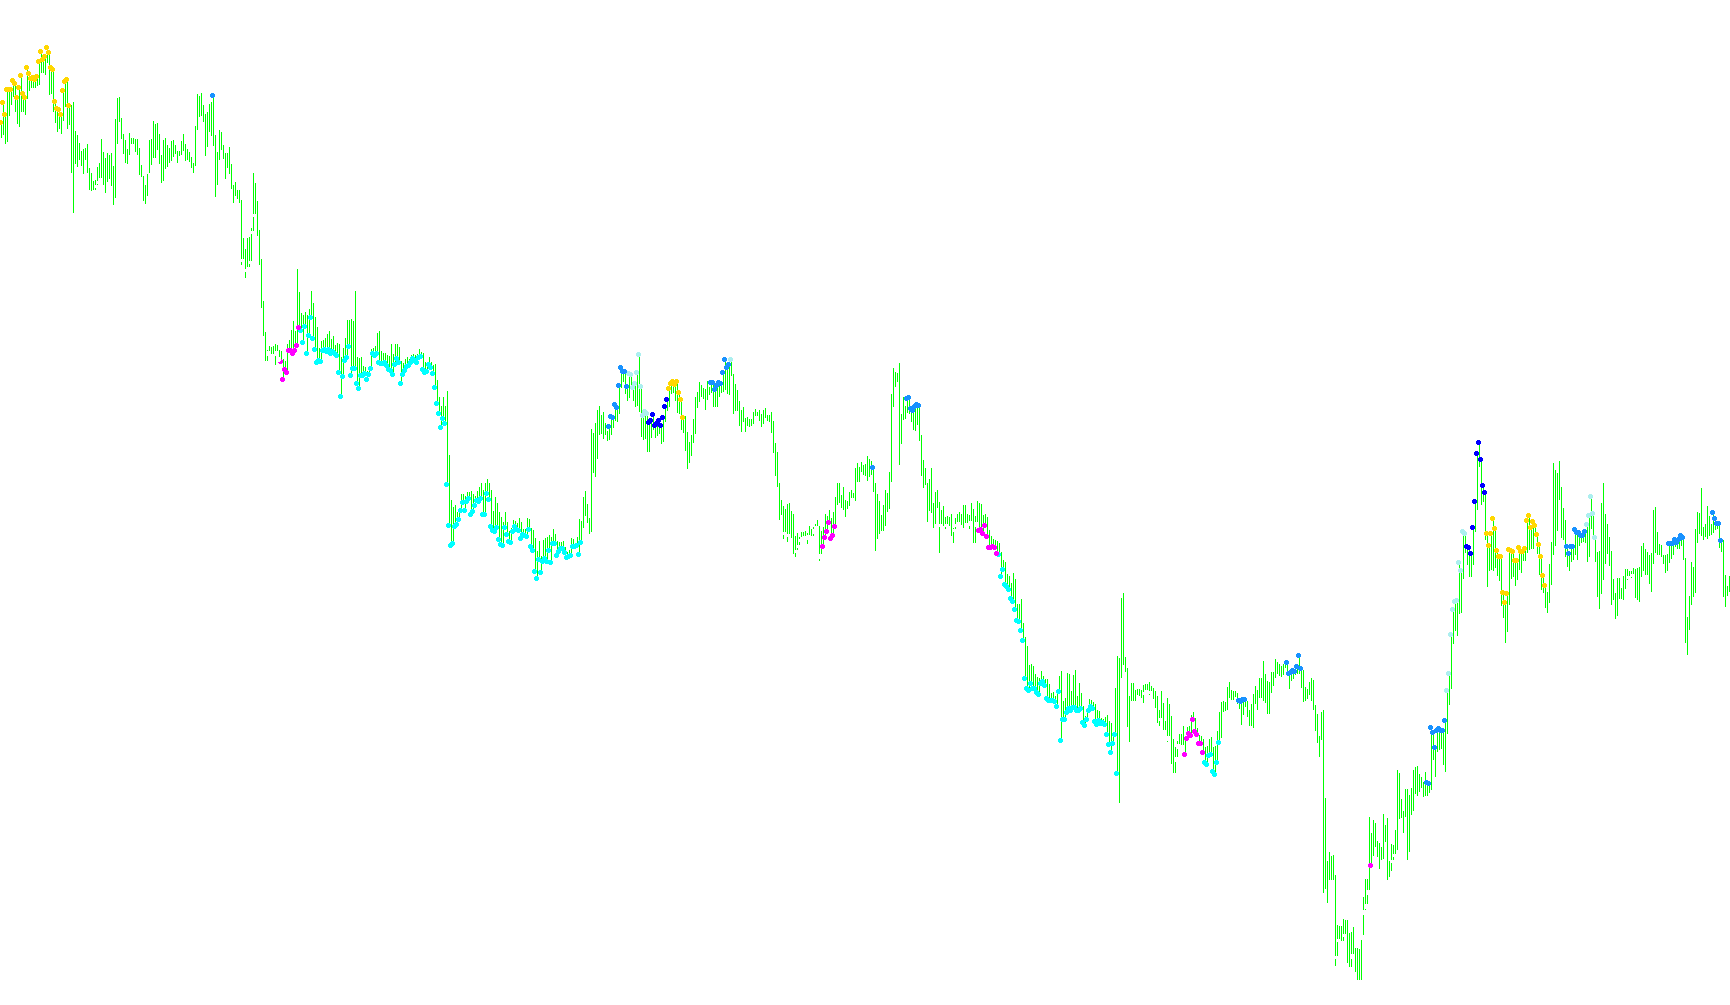
This indicator is designed to analyze market momentum by tracking the Relative Strength Index (RSI) and identifying specific trend "zones." Instead of simply looking at whether the price is going up or down, it monitors how long the RSI remains consistently on one side of the neutral midline (the 50-level).
Core Logic and Mechanism
The tool works by scanning historical price data to determine the "strength" of a current trend. It accomplishes this through three primary steps:
1. Momentum Tracking The script calculates the RSI value for each price candle. It specifically looks at whether the RSI is above or below the 50-point center mark. This midline serves as the boundary between bullish (upward) and bearish (downward) momentum.
2. Trend Counting Unlike standard indicators that react instantly to a single change, this script keeps a running count of how many consecutive periods the RSI has stayed above or below the 50-level.
- If the RSI crosses the midline in either direction, the internal counters are reset.
- This ensures the indicator only identifies sustained trends rather than temporary fluctuations.
3. Zone Identification and Visual Signaling The script categorizes the strength of the trend into four distinct "zones" based on how many periods the momentum has persisted. Depending on where the count falls, it places a visual marker (a dot) on the chart at either the High or Low of the candle:
- Strong Trends: When the count is high (e.g., 40 or more periods), it identifies a very established trend.
- Moderate Trends: As the count decreases (dropping into the 30s, 20s, and 10s ranges), the indicator recognizes that the trend is becoming less dominant.
- Dual Directionality: The logic is mirrored for both upward momentum (counting periods above 50) and downward momentum (counting periods below 50).
Summary for the User
Essentially, this script acts as a "persistence tracker." It helps traders visualize not just where the price is going, but how long the current momentum has been sustained. By placing different markers based on these persistence levels, it provides a visual map of trend maturity, allowing you to see when a move is deeply established versus when it is beginning to lose its grip.
/*-----------------------------+
|			       |
| Shared by www.Aptrafx.com    |
|			       |
+------------------------------*/

//+------------------------------------------------------------------+
//| 5 Min RSI 12-period qual INDICATOR                               |
//+------------------------------------------------------------------+
#property copyright "Ron T"
#property link      "http://www.lightpatch.com"

#property indicator_chart_window
#property indicator_buffers 8

#property indicator_color1 Red
#property indicator_color2 HotPink
#property indicator_color3 LightPink
#property indicator_color4 MistyRose

#property indicator_color5 White
#property indicator_color6 LightGray
#property indicator_color7 LightSlateGray
#property indicator_color8 DarkGray


//---- buffers
double ExtMapBuffer1[];
double ExtMapBuffer2[];
double ExtMapBuffer3[];
double ExtMapBuffer4[];
double ExtMapBuffer5[];
double ExtMapBuffer6[];
double ExtMapBuffer7[];
double ExtMapBuffer8[];


// User Input


//+------------------------------------------------------------------+
//| Custom indicator initialization function                         |
//|------------------------------------------------------------------|

int init()
  {

   // 233 up arrow
   // 234 down arrow
   // 159 big dot
   // 168 open square

   SetIndexStyle(0,DRAW_ARROW);
   SetIndexBuffer(0, ExtMapBuffer1);
   SetIndexArrow(0,159);  //up

   SetIndexStyle(1,DRAW_ARROW);
   SetIndexBuffer(1, ExtMapBuffer2);
   SetIndexArrow(1,159);  //down

   SetIndexStyle(2,DRAW_ARROW);
   SetIndexBuffer(2, ExtMapBuffer3);
   SetIndexArrow(2,159);

   SetIndexStyle(3,DRAW_ARROW);
   SetIndexBuffer(3, ExtMapBuffer4);
   SetIndexArrow(3,159);

   SetIndexStyle(4,DRAW_ARROW);
   SetIndexBuffer(4, ExtMapBuffer5);
   SetIndexArrow(4,159);

   SetIndexStyle(5,DRAW_ARROW);
   SetIndexBuffer(5, ExtMapBuffer6);
   SetIndexArrow(5,159);

   SetIndexStyle(6,DRAW_ARROW);
   SetIndexBuffer(6, ExtMapBuffer7);
   SetIndexArrow(6,159);

   SetIndexStyle(7,DRAW_ARROW);
   SetIndexBuffer(7, ExtMapBuffer8);
   SetIndexArrow(7,159);

   return(0);
  }


//+------------------------------------------------------------------+
//| Custor indicator deinitialization function                       |
//+------------------------------------------------------------------+
int deinit()
  {
   int i;

   for( i=0; i<Bars; i++ ) ExtMapBuffer1[i]=0;
   for( i=0; i<Bars; i++ ) ExtMapBuffer2[i]=0;
   for( i=0; i<Bars; i++ ) ExtMapBuffer3[i]=0;
   for( i=0; i<Bars; i++ ) ExtMapBuffer4[i]=0;
   for( i=0; i<Bars; i++ ) ExtMapBuffer5[i]=0;
   for( i=0; i<Bars; i++ ) ExtMapBuffer6[i]=0;
   for( i=0; i<Bars; i++ ) ExtMapBuffer7[i]=0;
   for( i=0; i<Bars; i++ ) ExtMapBuffer8[i]=0;

   return(0);
  }


//+------------------------------------------------------------------+
//| Custom indicator iteration function                              |
//+------------------------------------------------------------------+

// Current position if 55/45 or over/under. Does any of
// the previous 'qual' period ever fall below55/above45? (last11)
//
// If qual*2 periods have been above55/below45
// then lets not try to transact any more (last22)


int start()
  {
   int      pos=Bars-100; // leave room for moving average periods

   double   rsic=0;        // Relative Strength Indicator
   double   rsip=0;        // Relative Strength Indicator

   int      above=0;       // above 50 counter
   int      below=0;       // below 50 counter

   while(pos>=0)
     {
      rsic=iRSI(Symbol(),0,28,PRICE_CLOSE,pos);
      rsip=iRSI(Symbol(),0,28,PRICE_CLOSE,pos+1);

      if (rsic>50 && rsip<50)  //rising RSI
        {
         above=0;
         below=0;
        }

      if (rsic<50 && rsip>50)   //falling RSI
        {
         above=0;
         below=0;
        }

      if (rsic>50) above++;              // count periods above 50
      if (rsic<50) below++;              // count periods below 50

      if (above >= 40)
        {
         ExtMapBuffer1[pos]=High[pos];
         ExtMapBuffer2[pos]=0;
         ExtMapBuffer3[pos]=0;
         ExtMapBuffer4[pos]=0;
        }
      if (above>=30 && above<=39 )
        {
         ExtMapBuffer1[pos]=0;
         ExtMapBuffer2[pos]=High[pos];
         ExtMapBuffer3[pos]=0;
         ExtMapBuffer4[pos]=0;
        }
      if (above>=20 && above<=29 )
        {
         ExtMapBuffer1[pos]=0;
         ExtMapBuffer2[pos]=0;
         ExtMapBuffer3[pos]=High[pos];
         ExtMapBuffer4[pos]=0;
        }
      if (above>=10 && above<=19 )
        {
         ExtMapBuffer1[pos]=0;
         ExtMapBuffer2[pos]=0;
         ExtMapBuffer3[pos]=0;
         ExtMapBuffer4[pos]=High[pos];
        }

      if (below >= 40)
        {
         ExtMapBuffer5[pos]=Low[pos];
         ExtMapBuffer6[pos]=0;
         ExtMapBuffer7[pos]=0;
         ExtMapBuffer8[pos]=0;
        }
      if (below>=30 && below<=39 )
        {
         ExtMapBuffer5[pos]=0;
         ExtMapBuffer6[pos]=Low[pos];
         ExtMapBuffer7[pos]=0;
         ExtMapBuffer8[pos]=0;
        }
      if (below>=20 && below<=29 )
        {
         ExtMapBuffer5[pos]=0;
         ExtMapBuffer6[pos]=0;
         ExtMapBuffer7[pos]=Low[pos];
         ExtMapBuffer8[pos]=0;
        }
      if (below>=10 && below<=19 )
        {
         ExtMapBuffer5[pos]=0;
         ExtMapBuffer6[pos]=0;
         ExtMapBuffer7[pos]=0;
         ExtMapBuffer8[pos]=Low[pos];
        }

 	   pos--;
     }

   return(0);
  }
//+------------------------------------------------------------------+
Comments