Indicator

5_34_5_v2

iMA
Indicator

5_34_5_v4

iMA
5_bar
Indicator

5_bar

Identifies momentum shifts by detecting instances where current price action breaches the structural extremes of a preceding five-bar volatility window.

5_bar_
Indicator

5_bar_

This indicator identifies potential reversal points by detecting instances where current price action breaches the structural highs and lows of a preceding five-bar window.

5_bar_reversal_v0[1][1].5
Indicator

5_bar_reversal_v0[1][1].5

The indicator identifies potential trend reversals by detecting instances where the current price action breaks out of the historical high-low boundaries established over a five-bar lookback period.

5_bar_sig
Indicator

5_bar_sig

The algorithm identifies potential trend reversals by detecting instances where the current price action breaches the historical high-low boundaries of a preceding five-bar window.

Indicator

5_bar_SVM_input

iMACD
5_day_breakout
Indicator

5_day_breakout

Identifies and projects horizontal support and resistance levels by dynamically calculating the extreme price peaks and troughs over a rolling five-day period.

5_ZZ_Semafor
Indicator

5_ZZ_Semafor

This indicator identifies hierarchical price pivot points by overlaying five distinct ZigZag cycles of varying periods to pinpoint structural market shifts.

60m CHART - STEPRSI_V2
Indicator

60m CHART - STEPRSI_V2

iRSI

This indicator maps Relative Strength Index values into discrete stepped levels using two distinct dynamic thresholds to visualize structural momentum shifts.

=Search_patterns_v6
Indicator

=Search_patterns_v6

This indicator automatically detects and projects high-order harmonic structures—including Gartley, Butterfly, Crab, Bat, AB=CD, and Wolfe Waves—by calculating Fibonacci retracement ratios and identifying structural vertices.

Indicator

@Float

A Coding Error
Indicator

A Coding Error

iMA

This indicator calculates a smoothed momentum trend by analyzing the deviation of price gradients across a lookback period and applying a triple-smoothed moving average filter.

Indicator

a-MTF-Stoch60

iStochastic
a1 Close THIS SYMBOL Pstns
Indicator

a1 Close THIS SYMBOL Pstns

Iterates through active trades to execute immediate market closures exclusively for the currency pair or asset currently displayed on the chart.

a2 Close ALL Pstns
Indicator

a2 Close ALL Pstns

Iteratively traverses all active market orders to execute immediate liquidation at current bid or ask prices with automated re-quote handling.
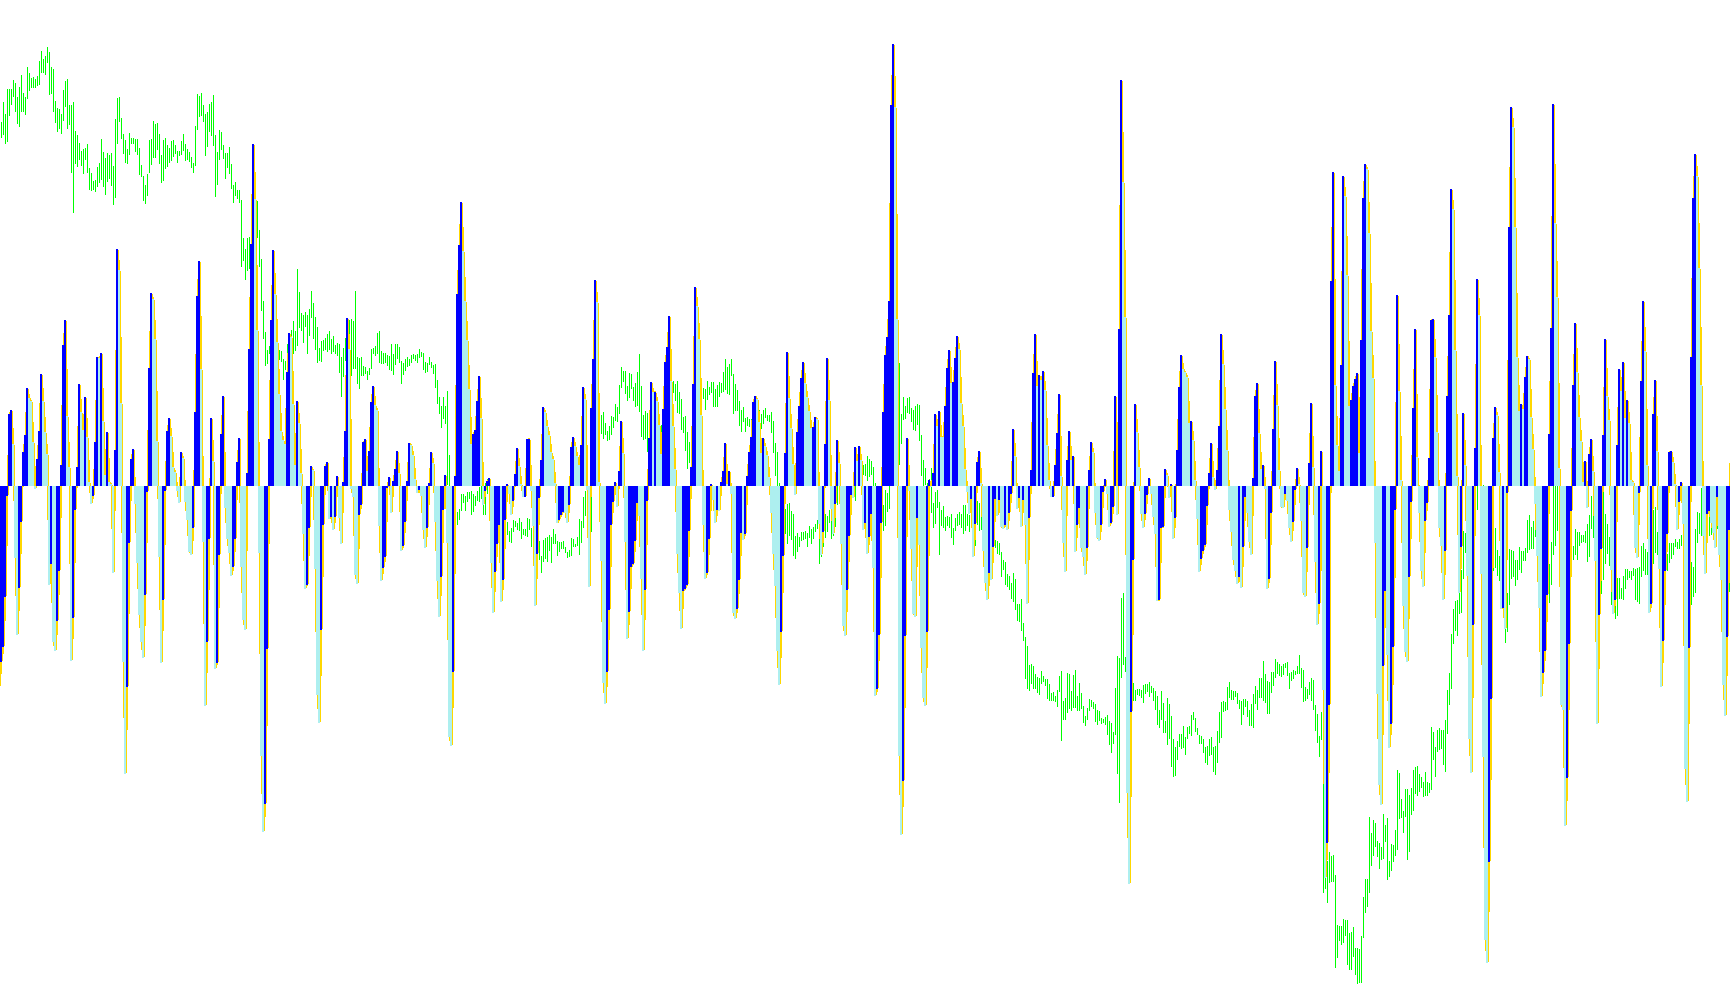
a2 Close ALL Pstns_v1
Indicator

a2 Close ALL Pstns_v1

Iterates through all active market orders to execute immediate flat positions by dynamically refreshing rates upon execution errors.

a3 Close ALL LONG Pstns
Indicator

a3 Close ALL LONG Pstns

a4 Close ALL SHORT Pstns
Indicator

a4 Close ALL SHORT Pstns

This script iterates through all active trade positions to identify and execute an immediate market exit for every sell order across all symbols.

a5 Close ALL WINNING Pstns
Indicator

a5 Close ALL WINNING Pstns

This automated script scans active trade history to immediately execute market exits for all open positions currently yielding positive equity.

a6 Close ALL LOSING Pstns
Indicator

a6 Close ALL LOSING Pstns

This script iterates through all open market positions to identify and immediately execute market orders to terminate any trade currently exhibiting a negative profit balance.

Indicator

AA HHLL

AA iMAX
Indicator

AA iMAX

This indicator utilizes a recursive weighted sum of price extrema to extract the underlying trend by filtering out cyclical noise via an optimal detrending algorithm.

AA$-Hurst Displaced MA
Indicator

AA$-Hurst Displaced MA

iMA

This indicator calculates a linear regression trend by projecting a shifted Simple Moving Average forward based on the slope between historical data points.

AbsoluteStrenghtHisto_v1
Indicator

AbsoluteStrenghtHisto_v1

iMAiMAOnArray

This indicator quantifies market pressure by calculating the net distance between current price action and extreme historical ranges, filtering the resulting bullish and bearish components through multi-stage moving average smoothing.

AbsoluteStrenghtHisto_v1_002
Indicator

AbsoluteStrenghtHisto_v1_002

iMAiMAOnArray

This indicator quantifies directional dominance by calculating the divergence between bullish and bearish price velocity or range penetration, then applying multi-layered smoothing to visualize net momentum intensity.

AbsoluteStrenghtHisto_v1_v1
Indicator

AbsoluteStrenghtHisto_v1_v1

iMAiMAOnArray

This indicator quantifies bullish and bearish dominance by calculating price deviations using either RSI-based velocity or Stochastic range proximity, then smoothing the resulting values into distinct histogram profiles.

AbsoluteStrenghtHisto_v1_v2
Indicator

AbsoluteStrenghtHisto_v1_v2

iMAiMAOnArray

This indicator quantifies market sentiment by decomposing price velocity into polarized bull and bear components using either derivative-based changes or stochastic range extremes.

AbsoluteStrenghtHisto_v1_v4
Indicator

AbsoluteStrenghtHisto_v1_v4

iMAiMAOnArray

This indicator quantifies market pressure by calculating the divergence between bullish and bearish price velocities, employing either RSI-based relative changes or Stochastic-style range boundaries to visualize directional dominance.

AbsoluteStrength TimeFrame
Indicator

AbsoluteStrength TimeFrame

iMAiMAOnArray
AbsoluteStrength TimeFrame_v1
Indicator

AbsoluteStrength TimeFrame_v1

iMAiMAOnArray
AbsoluteStrength_exit
Indicator

AbsoluteStrength_exit

Identifies potential reversal points by detecting specific crossover patterns between smoothed oscillator trends and their respective signal lines to flag momentum deceleration.

AbsoluteStrength_v1.1
Indicator

AbsoluteStrength_v1.1

iMAiMAOnArray

This indicator quantifies bullish and bearish intensity by decomposing price velocity, range expansion, or volatility extremes into smoothed momentum vectors.

Indicator

AbsoluteStrength_v1.1M4cH_mtf

iMAiMAOnArray
AbsoluteStrength_v1.1_001
Indicator

AbsoluteStrength_v1.1_001

iMAiMAOnArray

This indicator quantifies market bias by calculating divergent bullish and bearish intensities using RSI-based differential changes, Stochastic range positioning, or ADX-style volatility metrics.

Indicator

AbsoluteStrength_v1.1_mtf

iMAiMAOnArray
Indicator

AbsoluteStrength_v1.3_mtf

iMAiMAOnArray
AbsoluteStrength_v1
Indicator

AbsoluteStrength_v1

iMAiMAOnArray

This indicator quantifies market dominance by calculating independent bullish and bearish force vectors through either price delta analysis or stochastic range expansion, subsequently applying triple-layered moving average smoothing to isolate pure trend velocity.

AbsoluteStrength_v1DH
Indicator

AbsoluteStrength_v1DH

iMAiMAOnArray
AbsoluteStrength_v1DH_001
Indicator

AbsoluteStrength_v1DH_001

iMAiMAOnArray
AbsoluteStrength_v1DH_002
Indicator

AbsoluteStrength_v1DH_002

iMAiMAOnArray
Acceleration&Speed
Indicator

Acceleration&Speed

Accelerator Alert
Indicator

Accelerator Alert

iMAiMAOnArray

This indicator identifies trend reversals by calculating the differential between dual-period moving averages and detecting momentum shifts validated by volume spikes.

Accelerator
Indicator

Accelerator

iMAiMAOnArray

This indicator identifies price momentum shifts by calculating the differential between a primary MACD histogram and its smoothed signal line to isolate directional velocity.

Accelerator_4cM_mtf
Indicator

Accelerator_4cM_mtf

iMAiMAOnArray

This indicator quantifies price acceleration by calculating the differential between multi-timeframe moving averages and applying a secondary smoothing filter to identify trend velocity shifts.

Accelerator_4cM_mtf_001
Indicator

Accelerator_4cM_mtf_001

iMAiMAOnArray

This indicator calculates the differential between primary and secondary moving averages across specific timeframes to visualize price acceleration through momentum histograms.

Accelerator_4cM_mtf_v1
Indicator

Accelerator_4cM_mtf_v1

iMAiMAOnArray

This indicator calculates the rate of change between dual moving averages on a higher time frame to identify trend velocity and potential exhaustion points.

Accelerator_LSMA
Indicator

Accelerator_LSMA

iMAOnArray

This code calculates and visualizes the Accelerator/Decelerator Oscillator based on Least Squares Moving Averages (LSMA) to identify potential acceleration or deceleration in price momentum.

Accelerator_LSMA1
Indicator

Accelerator_LSMA1

iMAOnArray

This indicator quantifies momentum by calculating the spread between short-term and long-term Least Squares Moving Averages and visualizing the resulting directional shifts as a dynamic histogram.

Accelerator_LSMA1_v1
Indicator

Accelerator_LSMA1_v1

iMAOnArray

This indicator quantifies market velocity by calculating the differential between two Least Squares Moving Averages and plotting the resulting momentum shifts as a directional histogram.