5min_rsi_qual_02IND_v3
Download script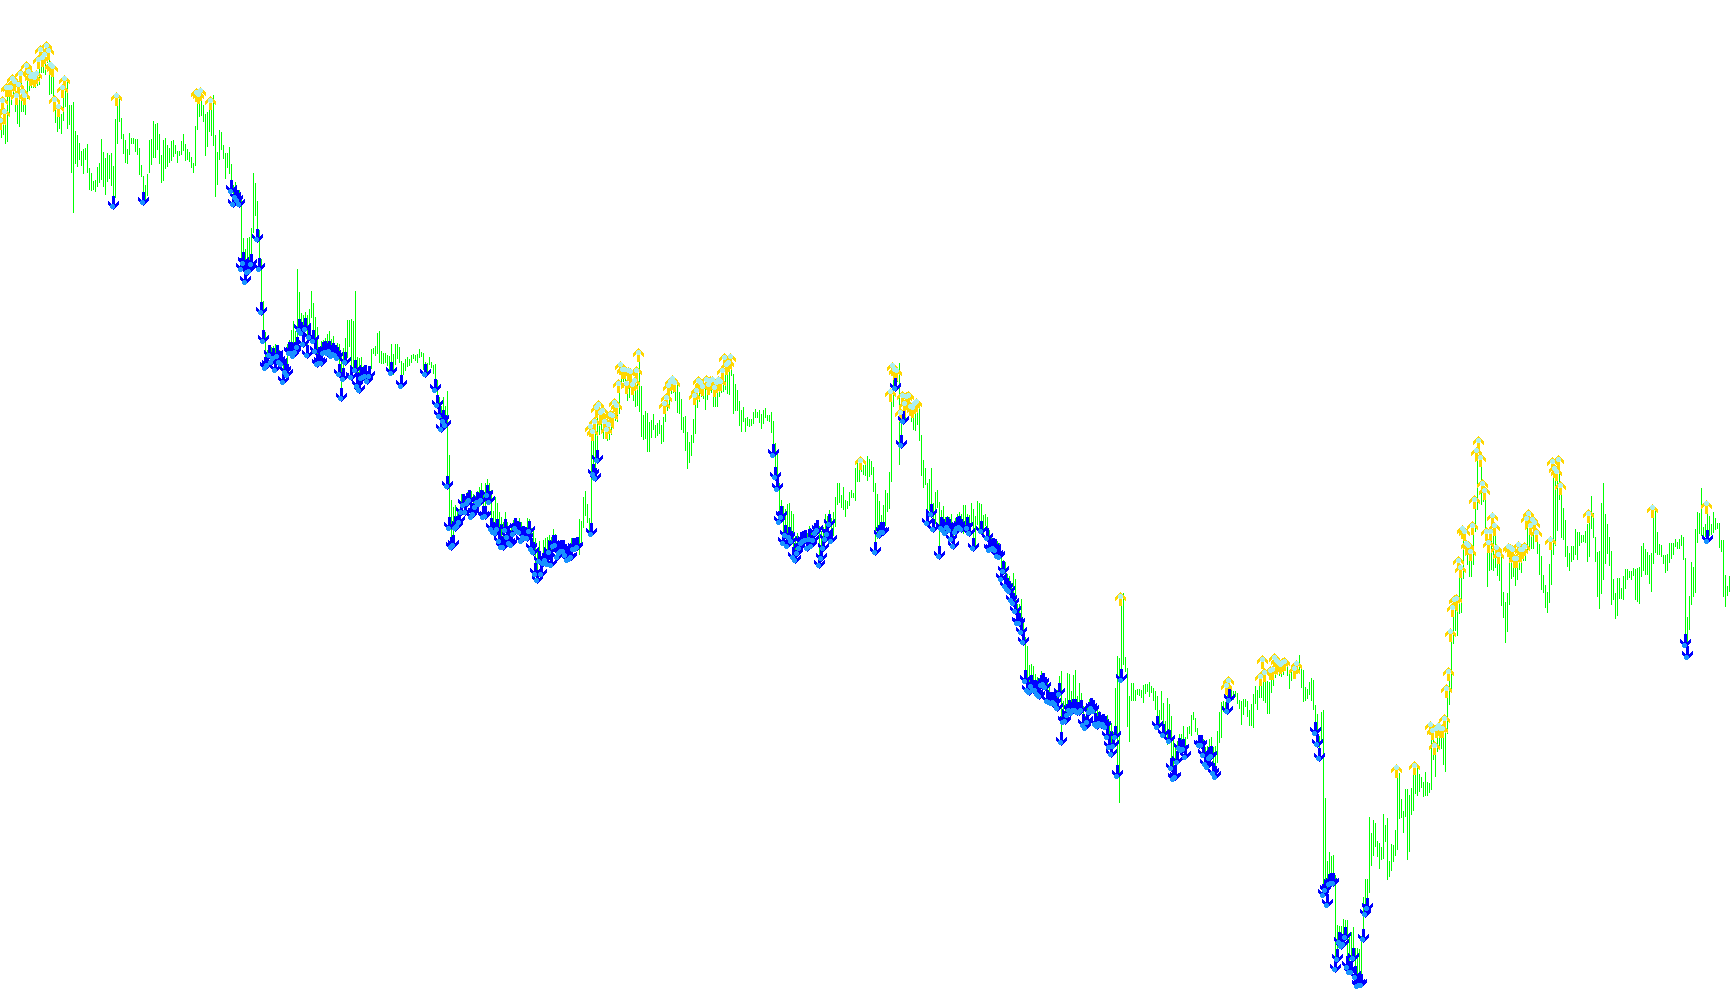
This tool is designed for traders using the MetaTrader platform to identify specific momentum shifts and price trends by analyzing the Relative Strength Index (RSI). Rather than simply providing a raw line on your chart, this script acts as an automated signal generator that places visual markers (arrows) directly on your price candles based on precise mathematical conditions.
How the Logic Works
The indicator scans the historical price data to evaluate market strength. It specifically looks for moments when the momentum moves into "over-extended" or "strong" territory, and it then validates those movements before providing a signal.
1. Momentum Detection The script constantly monitors the RSI value (set to a 28-period calculation). It triggers its logic whenever the momentum reaches two specific thresholds:
- Bullish Threshold: When momentum rises above 55.
- Bearish Threshold: When momentum falls below 45.
2. The Validation Filter (The "Qualifying" Step) Unlike basic indicators that fire a signal every time a line crosses a point, this script uses a "qualification" rule. Once a threshold is hit, the tool looks back at the preceding 11 candles to see if the momentum has remained consistently high or low. This helps filter out "noise"—those tiny, temporary price fluctuations that often result in false signals.
3. Visual Signal Output Depending on whether the move is "qualified" (consistent) or not, the script places different visual markers on your chart:
- Bullish Signals (Above 55):
- If the momentum is consistent, it identifies a high-probability strength point.
- It distinguishes between different types of price action by placing markers at specific distances above the candle's high point.
- Bearish Signals (Below 45):
- If the momentum is consistent, it identifies a high-probability weakness point.
- It places corresponding markers at specific distances below the candle's low point.
Summary for the Trader
In plain terms, this script helps you ignore "fake" price movements. It waits for the market to show a clear, sustained trend of strength or weakness over a sequence of candles before marking the chart. By doing this, it aims to highlight significant trend entries and exits while filtering out the erratic vibrations typical of volatile markets.
//+------------------------------------------------------------------+
//| 5 Min RSI 12-period qual INDICATOR                               |
//+------------------------------------------------------------------+
#property copyright "Ron T"
#property link      "http://www.lightpatch.com"
//----
#property indicator_chart_window
#property indicator_buffers 7
#property indicator_color1 HotPink  // arrow up
#property indicator_color2 HotPink  // arrow down
#property indicator_color3 Aqua
#property indicator_color4 Red
#property indicator_color5 White
#property indicator_color6 HotPink
#property indicator_color7 LimeGreen
//---- buffers
double ExtMapBuffer1[];
double ExtMapBuffer2[];
double ExtMapBuffer3[];
double ExtMapBuffer4[];
double ExtMapBuffer5[];
double ExtMapBuffer6[];
double ExtMapBuffer7[];
// User Input
//+------------------------------------------------------------------+
//| Custom indicator initialization function                         |
//|------------------------------------------------------------------|
int init()
  {
   SetIndexStyle(0,DRAW_ARROW);
   SetIndexBuffer(0, ExtMapBuffer1);
   SetIndexArrow(0,233);  //up
//----
   SetIndexStyle(1,DRAW_ARROW);
   SetIndexBuffer(1, ExtMapBuffer2);
   SetIndexArrow(1,234);  //down
//----
   SetIndexStyle(2,DRAW_ARROW);
   SetIndexBuffer(2, ExtMapBuffer3);
   SetIndexArrow(2,159);
//----
   SetIndexStyle(3,DRAW_ARROW);
   SetIndexBuffer(3, ExtMapBuffer4);
   SetIndexArrow(3,159);
//----
   SetIndexStyle(4,DRAW_ARROW);
   SetIndexBuffer(4, ExtMapBuffer5);
   SetIndexArrow(4,159);
//----
   SetIndexStyle(5,DRAW_ARROW);
   SetIndexBuffer(5, ExtMapBuffer6);
   SetIndexArrow(5,159);
//----
   SetIndexStyle(6,DRAW_ARROW);
   SetIndexBuffer(6, ExtMapBuffer7);
   SetIndexArrow(6,159);
   return(0);
  }
//+------------------------------------------------------------------+
//| Custor indicator deinitialization function                       |
//+------------------------------------------------------------------+
int deinit()
  {
   int i;
   //----
   for( i=0; i<Bars; i++)ExtMapBuffer1[i]=0;
   for( i=0; i<Bars; i++)ExtMapBuffer2[i]=0;
   for( i=0; i<Bars; i++)ExtMapBuffer3[i]=0;
   for( i=0; i<Bars; i++)ExtMapBuffer4[i]=0;
   for( i=0; i<Bars; i++)ExtMapBuffer5[i]=0;
   for( i=0; i<Bars; i++)ExtMapBuffer6[i]=0;
   for( i=0; i<Bars; i++)ExtMapBuffer7[i]=0;
   return(0);
  }
//+------------------------------------------------------------------+
//| Custom indicator iteration function                              |
//+------------------------------------------------------------------+
int start()
  {
   double   rsi=0;        // Relative Strength Indicator
   int      i=0;
   int      pos=Bars-100; // leave room for moving average periods
//----
   bool   last11=true;        // qualify flag
   bool   last22=true;        // qualify flag
//----
   while(pos>=0)
     {
      rsi=iRSI(Symbol(),0,28,PRICE_CLOSE,pos);
//----
      if (rsi>=55)
        {
         ExtMapBuffer1[pos]=High[pos];
         last11=false;
         for(i=pos; i<pos+11; i++)
           {
            rsi=iRSI(Symbol(),0,28,PRICE_CLOSE,i);
            if (rsi>=55.0) last11=true;
           }
         if (last11==true)
           {
            ExtMapBuffer3[pos]=High[pos]+0.0001;
           }
         else
           {
            ExtMapBuffer5[pos]=High[pos]+0.0002;
           }
        }
      if (rsi<=45)
        {
         ExtMapBuffer2[pos]=Low[pos];
//----
         last11=false;
         for(i=pos; i<(pos+11); i++)
           {
            if (iRSI(Symbol(),0,28,PRICE_CLOSE,i)<=45) last11=true;
           }
         if (last11==true)
           {
            ExtMapBuffer4[pos]=Low[pos]-0.0001;
           }
         else
           {
            ExtMapBuffer6[pos]=Low[pos]-0.0002;
           }
        }
      pos--;
     }
   return(0);
  }
//+------------------------------------------------------------------+
Comments