Accelerator_LSMA_v1
Indicator

Accelerator_LSMA_v1

iMAOnArray

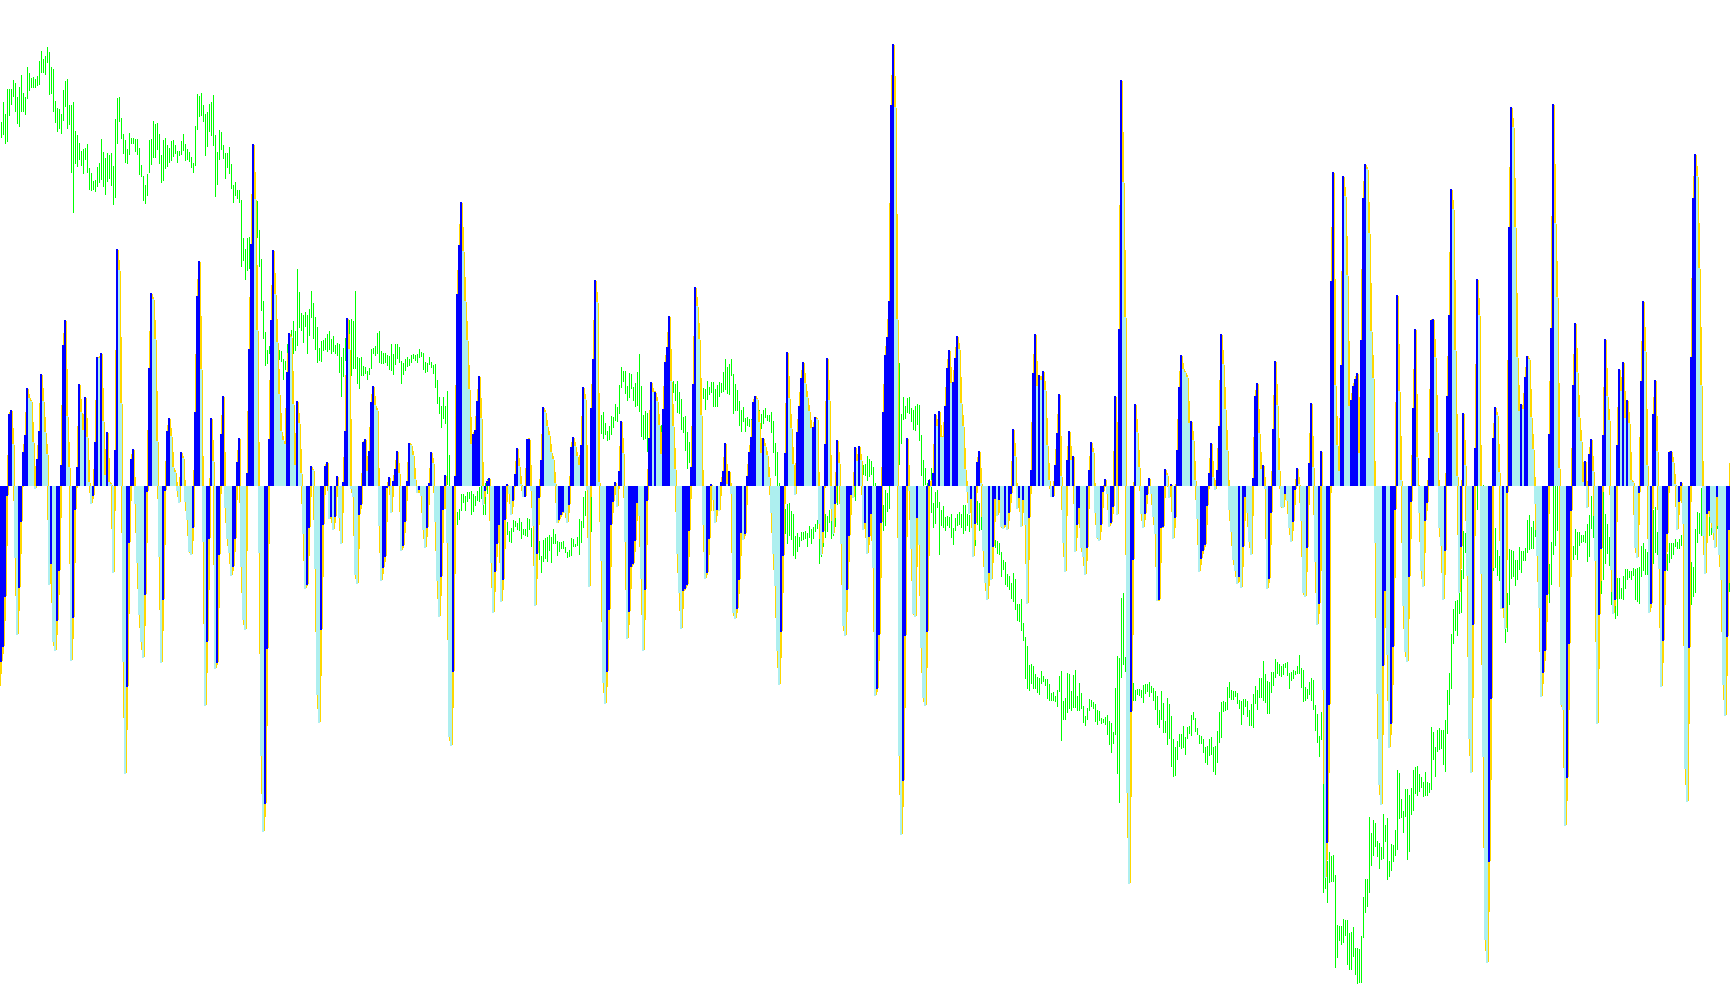
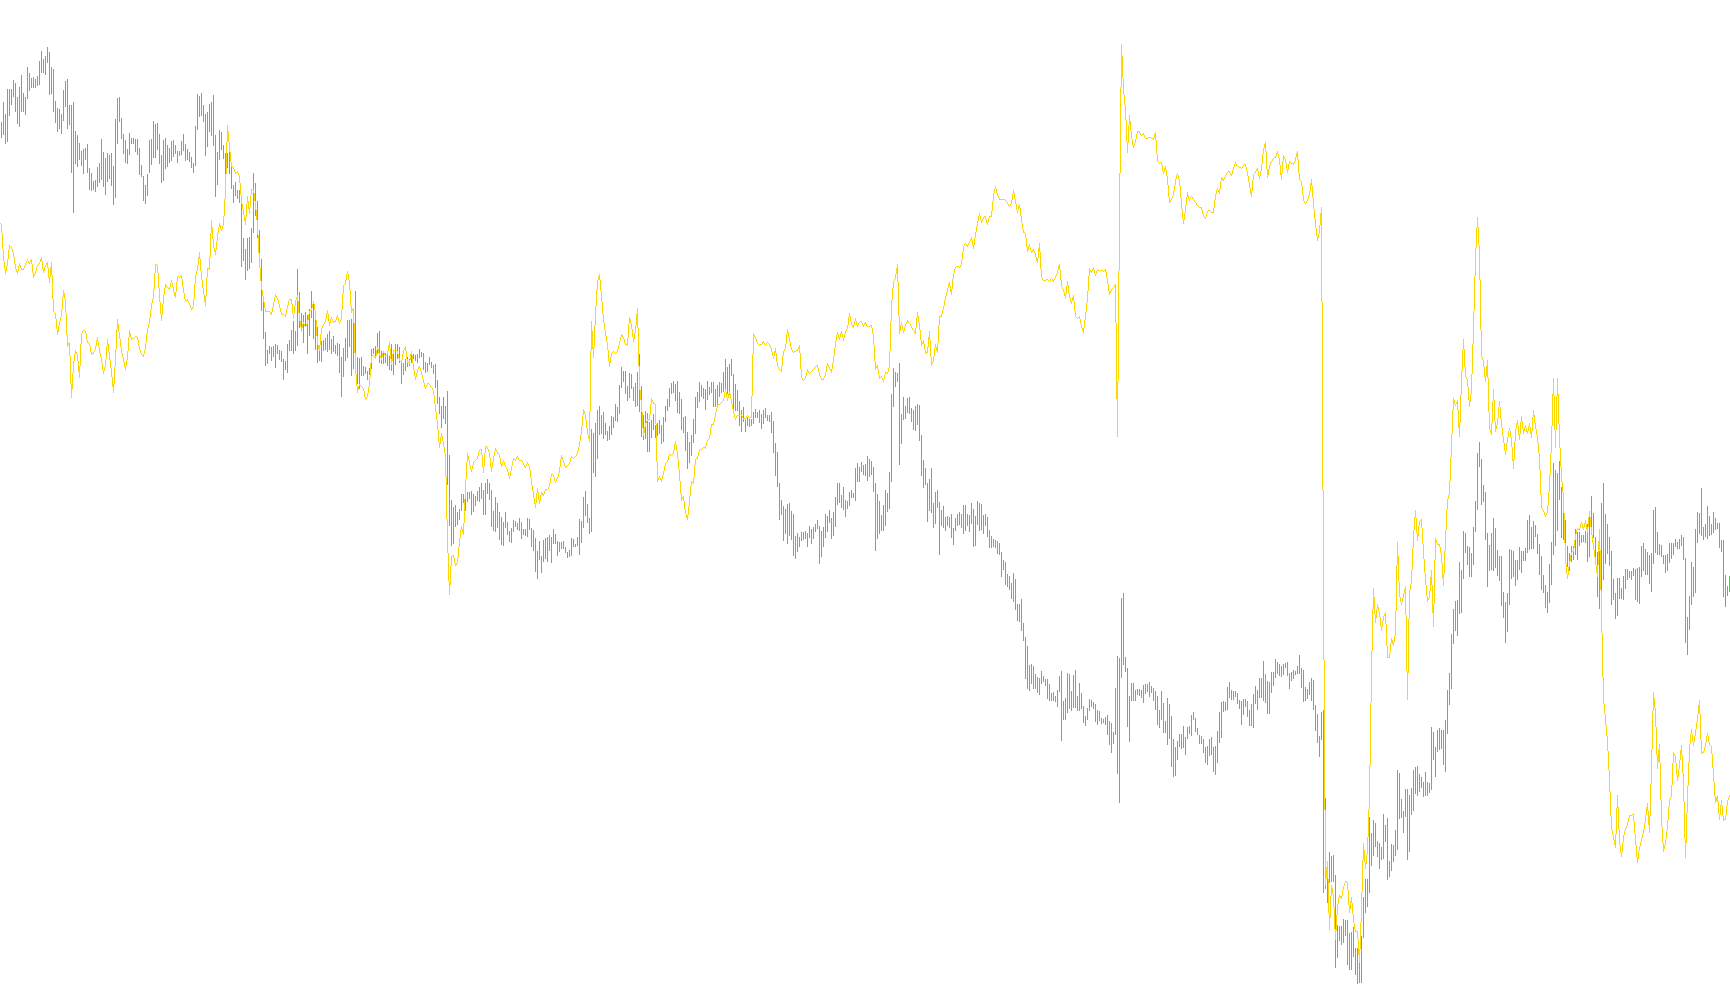
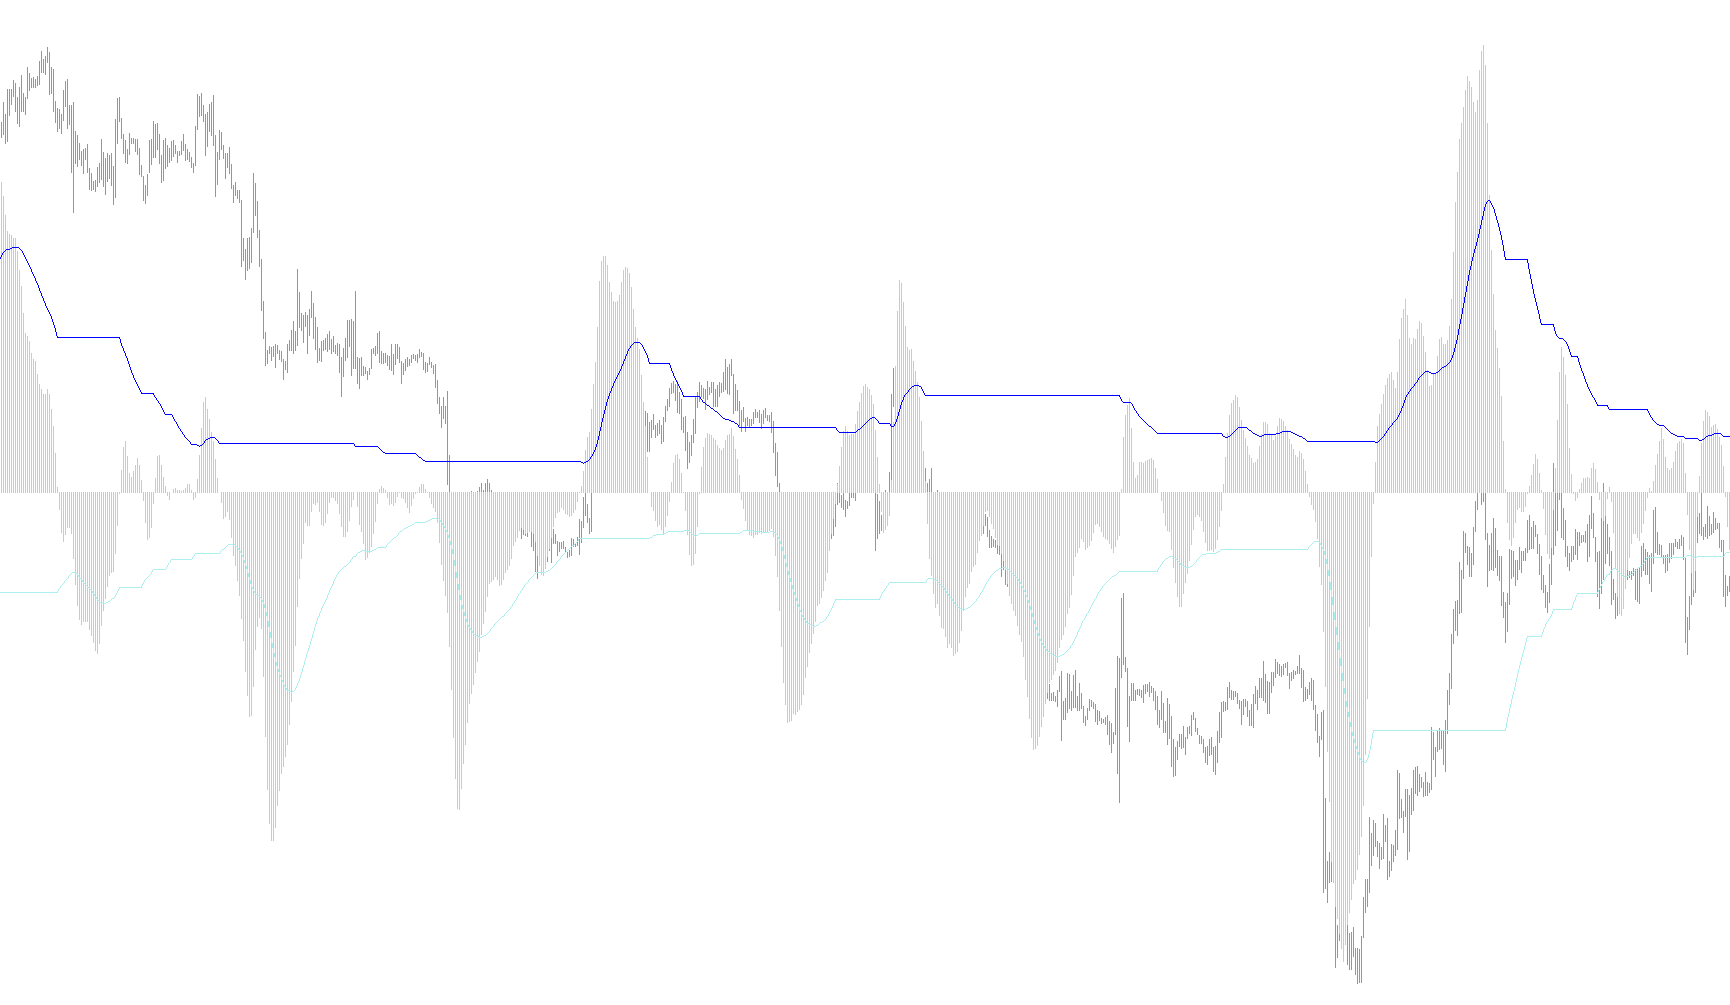
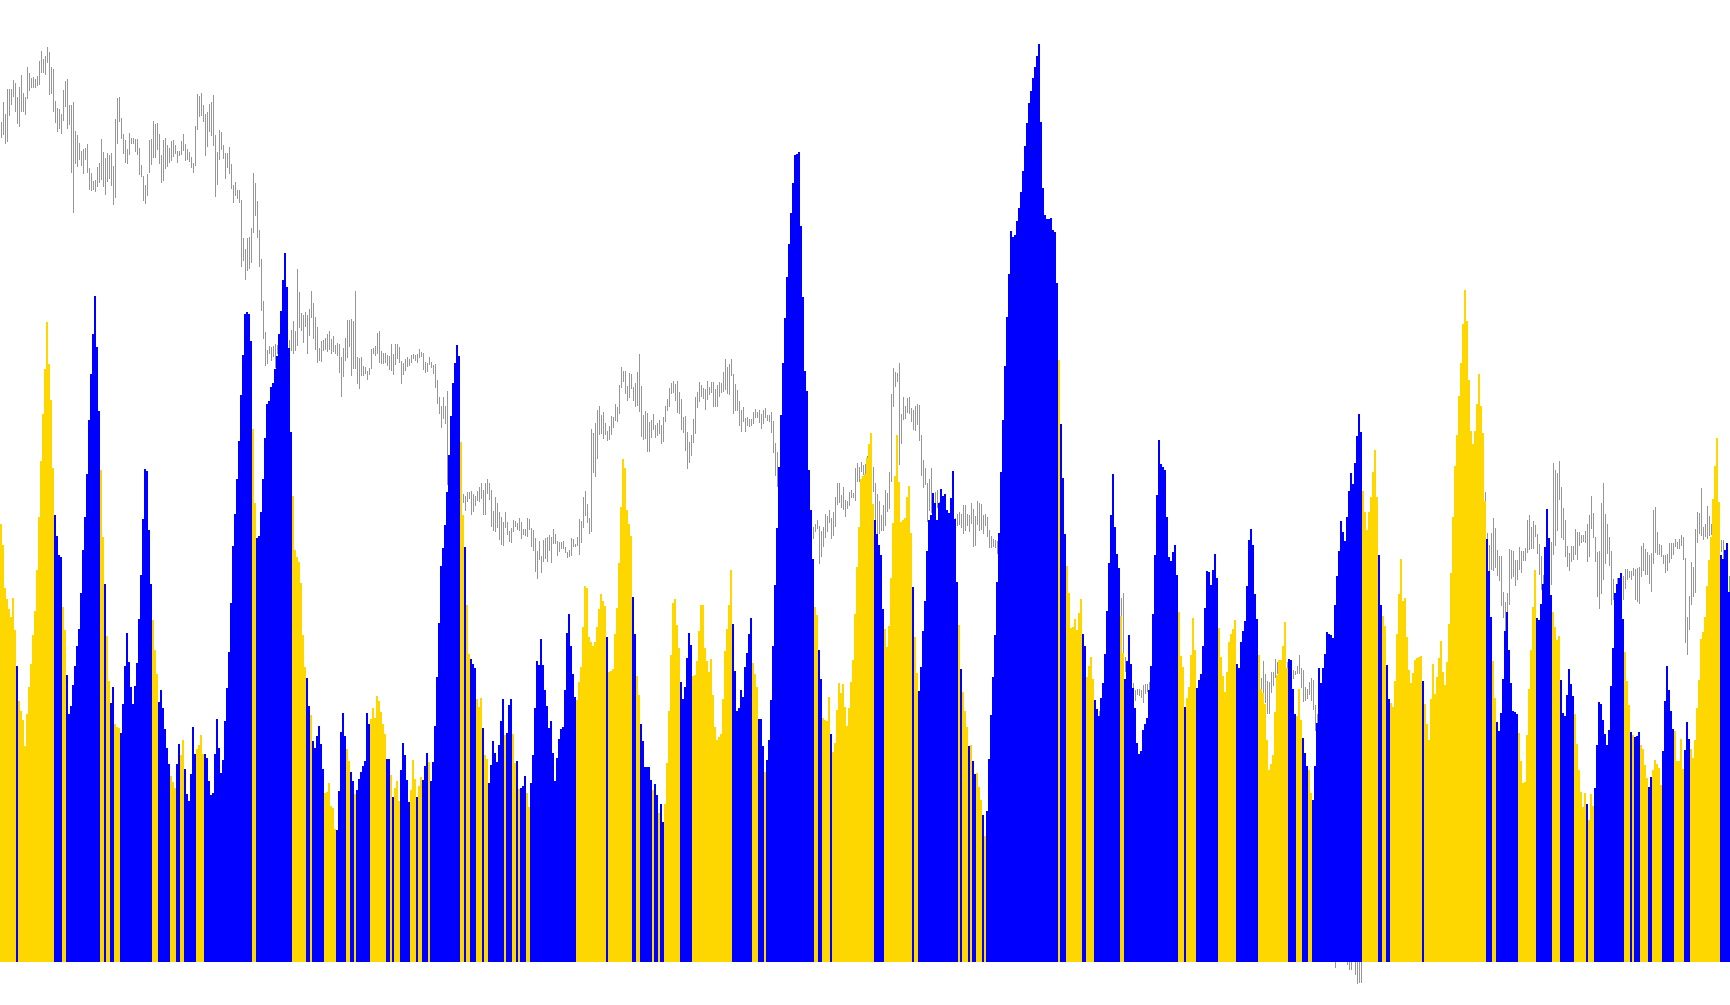
This indicator calculates the Accelerator/Decelerator Oscillator based on the difference between two Least Squares Moving Averages (LSMA) and displays it as a histogram, highlighting potential acceleration or deceleration in price momentum.

Accelerator_LSMA_v2
Indicator

Accelerator_LSMA_v2

iMAOnArray

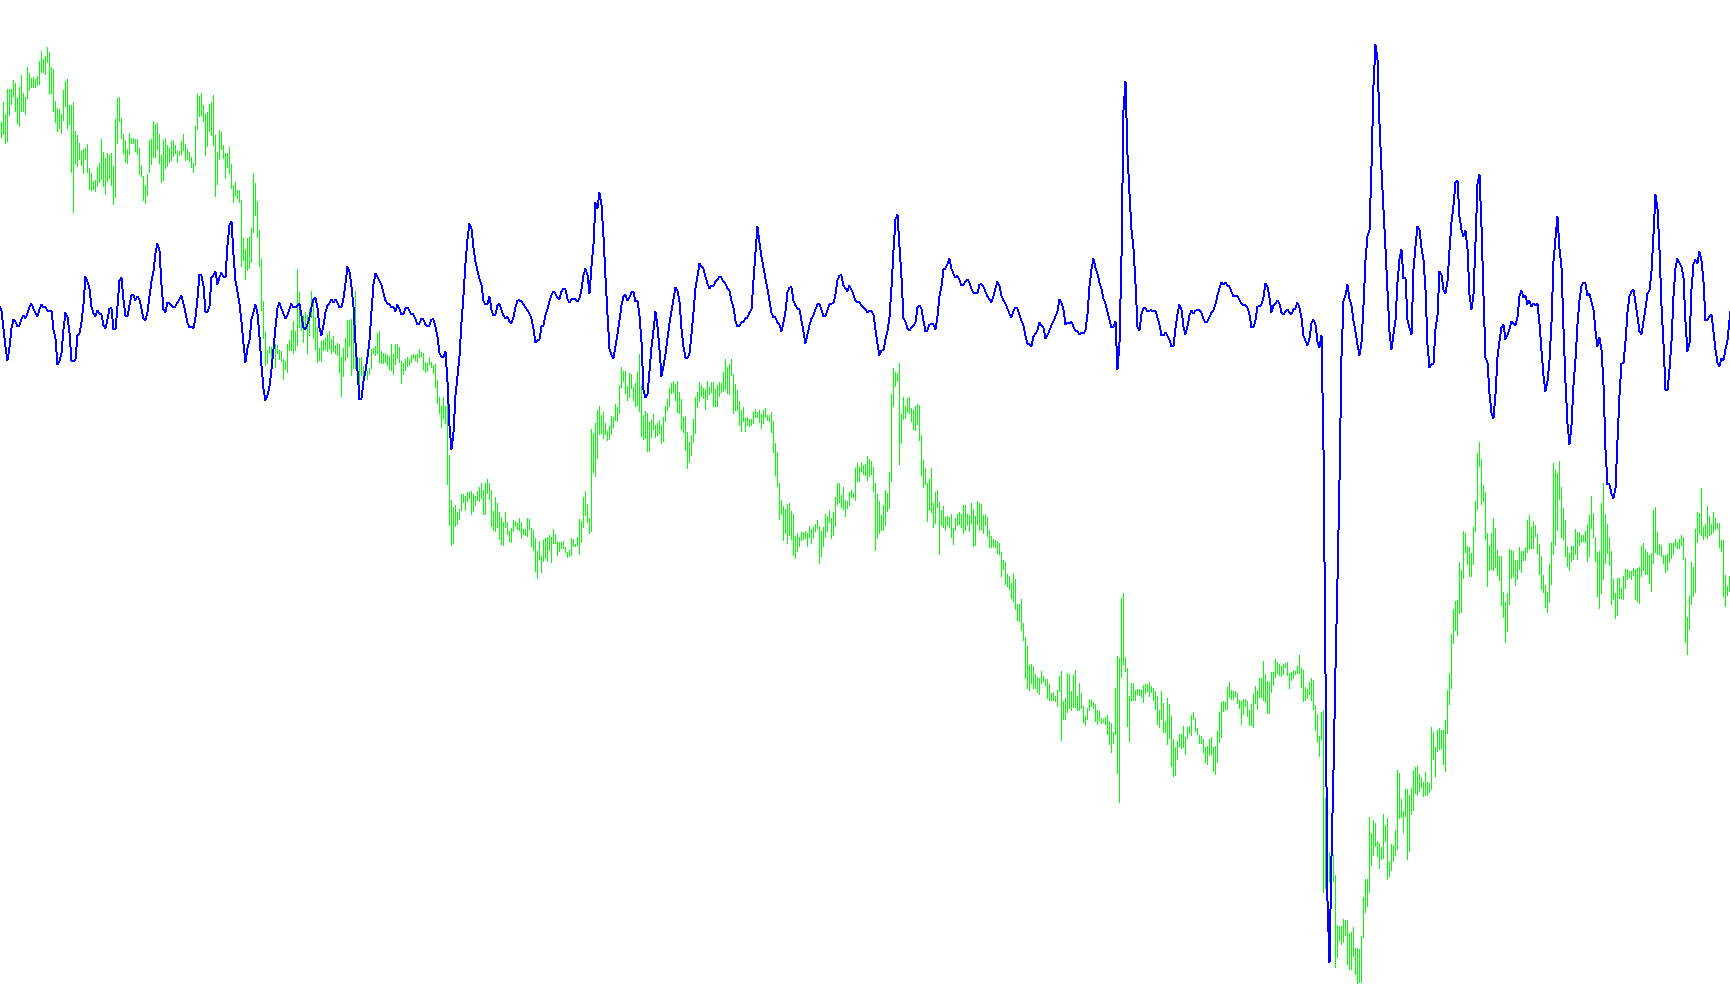
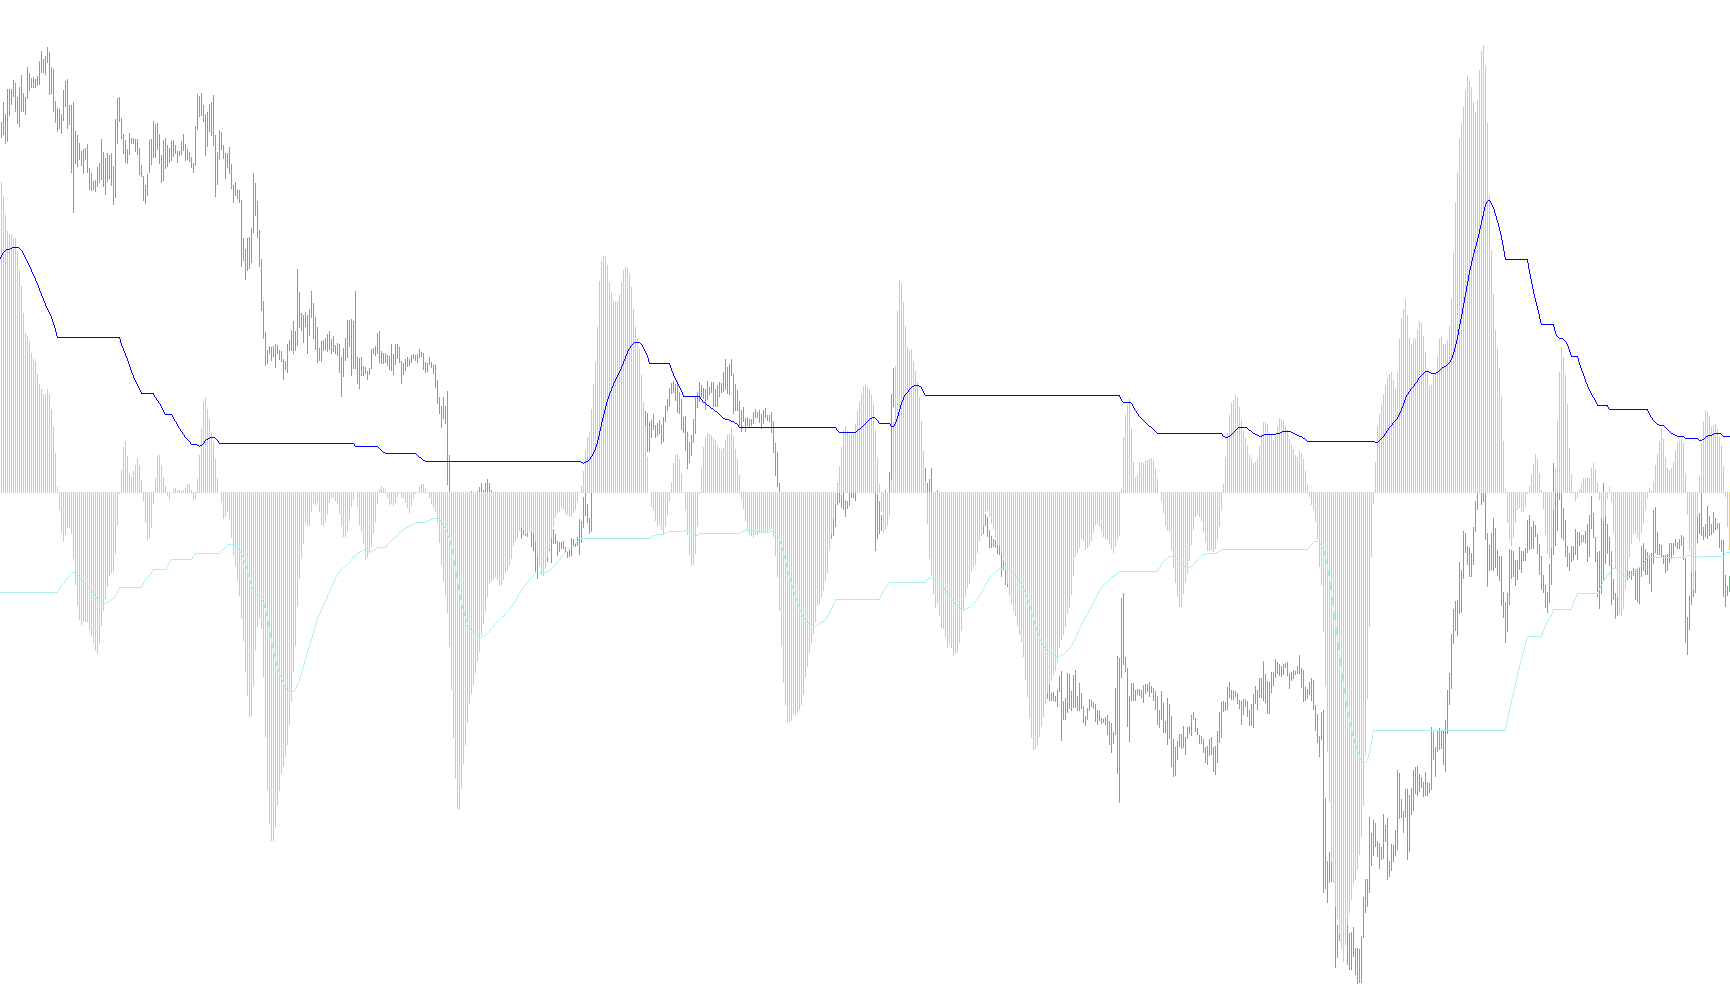
This indicator calculates the differential between fast and slow Least Squares Moving Averages to identify trend acceleration and momentum shifts via a dual-histogram visual output.

Accelerator_LSMA_v2_v1
Indicator

Accelerator_LSMA_v2_v1

iMAOnArray

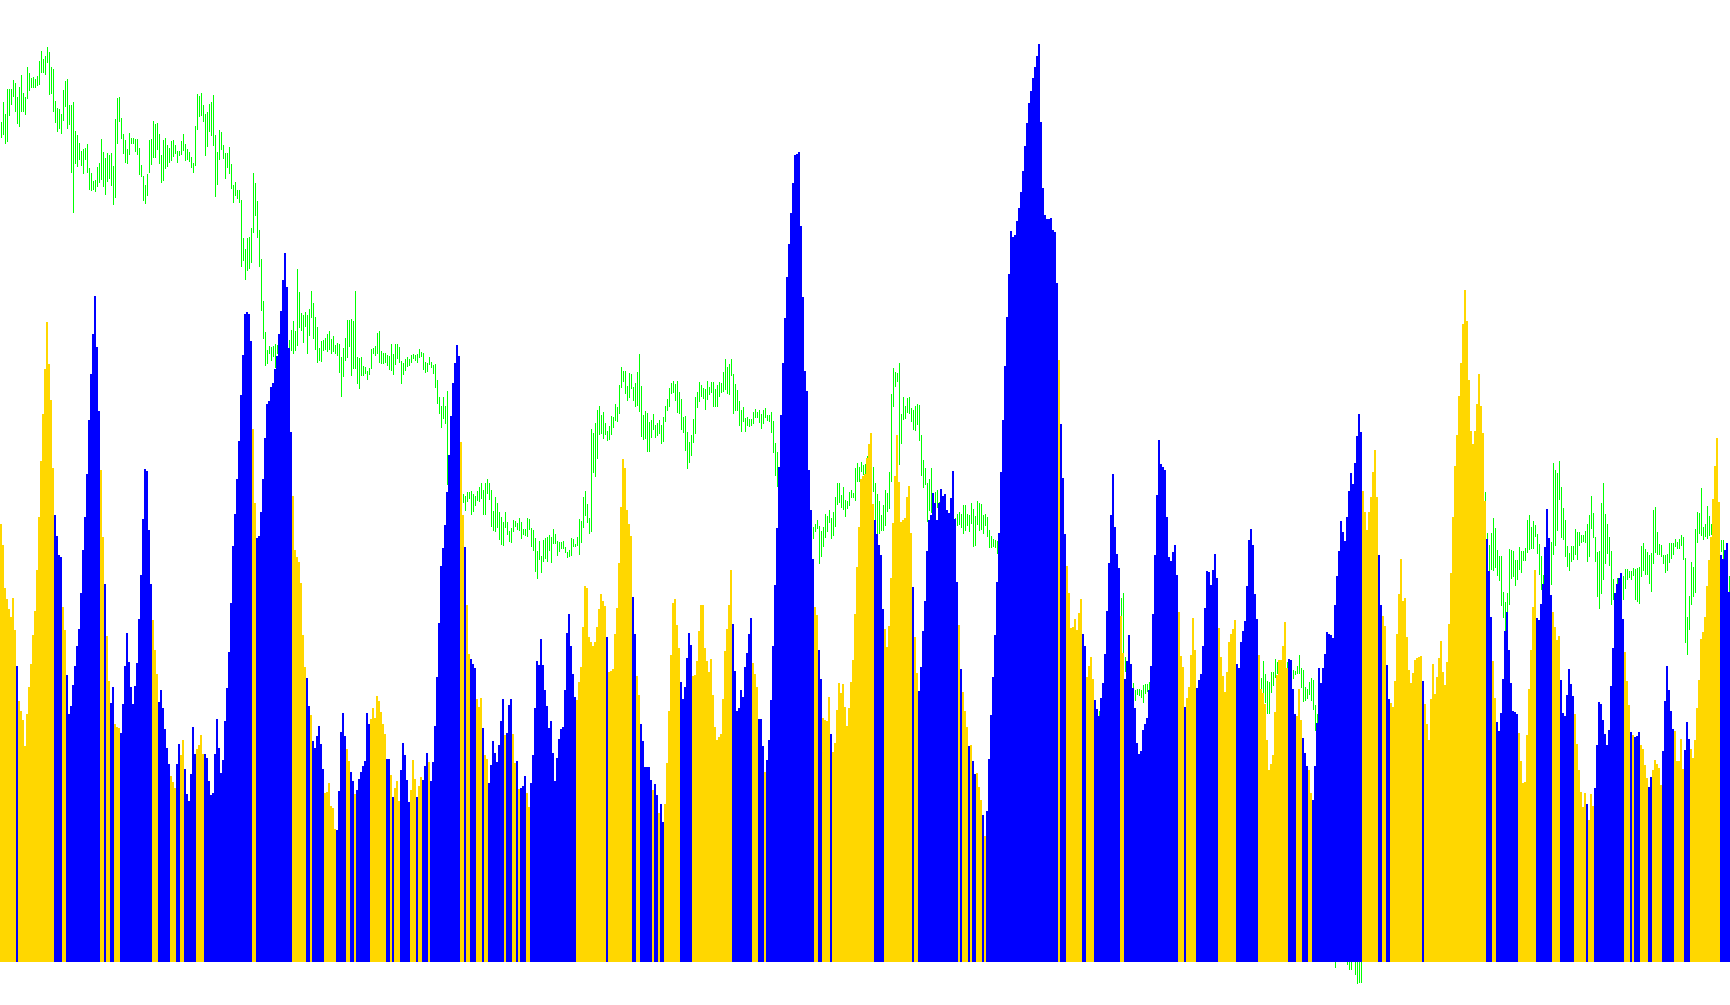
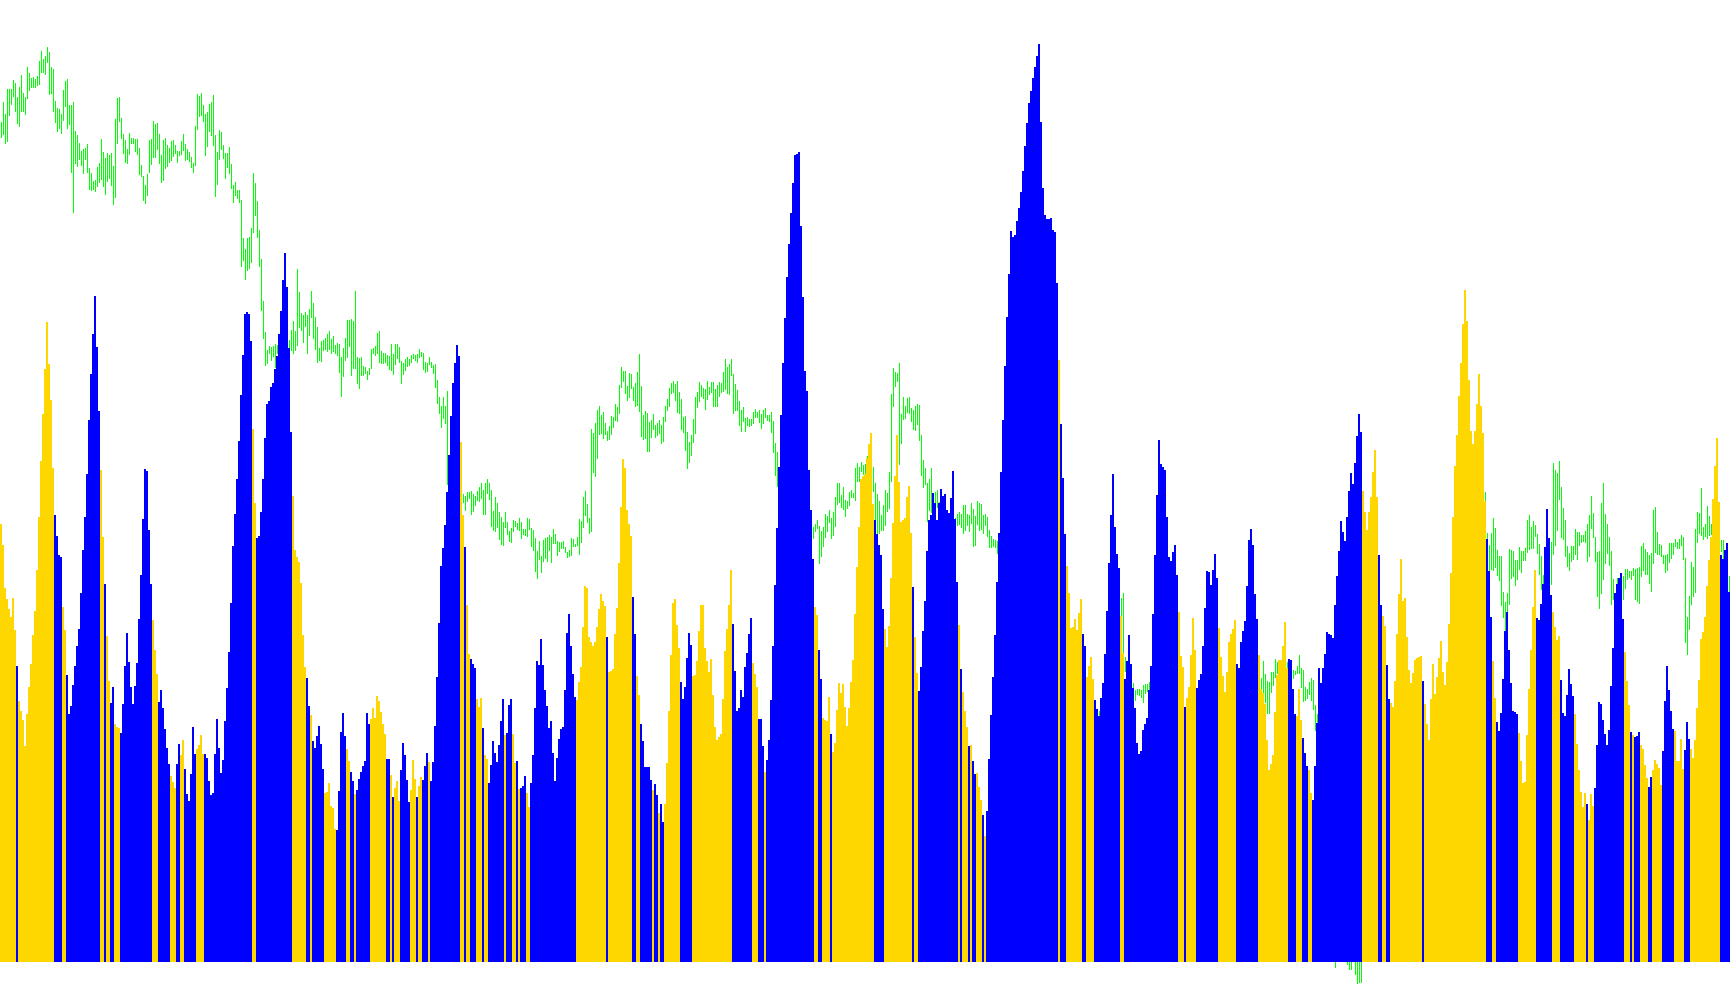
This indicator calculates the momentum difference between two weighted least squares moving averages and visualizes the directional velocity using a histogram-based signal flip.

accelerator_v1
Indicator

accelerator_v1

iMAiMAOnArray
Accelerator_v2
Indicator

Accelerator_v2

iMAiMAOnArray

This indicator quantifies price velocity by calculating the difference between two simple moving averages and filtering the resulting signal into distinct bullish and bearish histogram components.

Accelerator_v3
Indicator

Accelerator_v3

iMAiMAOnArray

This indicator calculates the spread between two moving averages and identifies directional shifts by comparing current net values against preceding periods to highlight accelerating trends.

accelerator_v4
Indicator

accelerator_v4

iMAiMAOnArray

This indicator measures the rate of change between two moving averages and filters the direction of momentum using a smoothed histogram to identify bullish and bearish velocity shifts.

accountdetails
Indicator

accountdetails

This script aggregates and displays comprehensive real-time metadata regarding account permissions, financial margins, and specific instrument execution parameters via a graphical dialog.

AccountEquityAnalyzer
Indicator

AccountEquityAnalyzer

This tool reconstructs historical trade performance to visualize equity curves, project annualized returns based on real-time growth rates, and monitor peak floating drawdown metrics.

AccountMonitor
Indicator

AccountMonitor

This script captures real-time account liquidity and open position profitability, broadcasting a structured status summary via email at each new candle.

AccountSentry
Indicator

AccountSentry

A proactive risk management system that monitors real-time margin levels, floating drawdown, and equity thresholds to automatically liquidate positions and halt trading during volatile conditions.

Accrete-ATM_TunnelBands
Indicator

Accrete-ATM_TunnelBands

iMA

This indicator calculates nested volatility envelopes and multi-timeframe EMA crossovers by applying dynamic standard deviations to high/low price extremes over a 144-period cycle.

Accrete-MFBtm_DZRSI
Indicator

Accrete-MFBtm_DZRSI

iMAOnArrayiRSI
Accrete_5mTunnel
Indicator

Accrete_5mTunnel

iMA

This indicator synthesizes a complex multi-layered moving average framework, utilizing Exponential and Simple averages across different price points to identify momentum corridors and trend boundaries.

Accumulation
Indicator

Accumulation

This indicator quantifies the net buying and selling pressure by normalizing the relationship between closing prices and vertical price ranges, subsequently scaling the result by absolute trading volume to create a cumulative momentum flow.

Accumulation2MA_v03
Indicator

Accumulation2MA_v03

iMAOnArray

This indicator calculates the moving average differential of the Cumulative Volume-Weighted Price Action to identify momentum shifts in underlying liquidity flows.

Indicator

Accumulation2MA_v03b_mtf

iMAOnArray
Accumulation_v2
Indicator

Accumulation_v2

iMAOnArray

This indicator calculates a cumulative volume-weighted price distribution metric and applies dual exponential moving averages to identify trend momentum shifts.

ACD_PV
Indicator

ACD_PV

ACD_PV_v1
Indicator

ACD_PV_v1

ACD_PV_v2
Indicator

ACD_PV_v2

This indicator identifies key support and resistance zones by calculating daily pivot points, range boundaries, and previous sessions' highs and lows using a customizable time window.

Activity_indic_1
Indicator

Activity_indic_1

AC_Chaos_2
Indicator

AC_Chaos_2

iAC
AC_Chaos_21
Indicator

AC_Chaos_21

iAC

This indicator identifies local extrema by detecting structural V-shaped inversions in the Average Center price action.

Indicator

AD2MA_v03bc_mtf

iMAOnArray
Adaptative Stochastic v4
Indicator

Adaptative Stochastic v4

iATRiStochastic

This indicator dynamically scales stochastic period calculations based on the ratio of fast and slow ATR values, applying a quadratic multiplier to capture momentum shifts relative to market volatility.

Adaptive RSI
Indicator

Adaptive RSI

iRSI

This indicator calculates a smoothed momentum value by applying a recursive weighting factor based on the absolute deviation of the standard RSI from its midpoint.
Adaptive RSI_v1
Indicator

Adaptive RSI_v1

iRSI

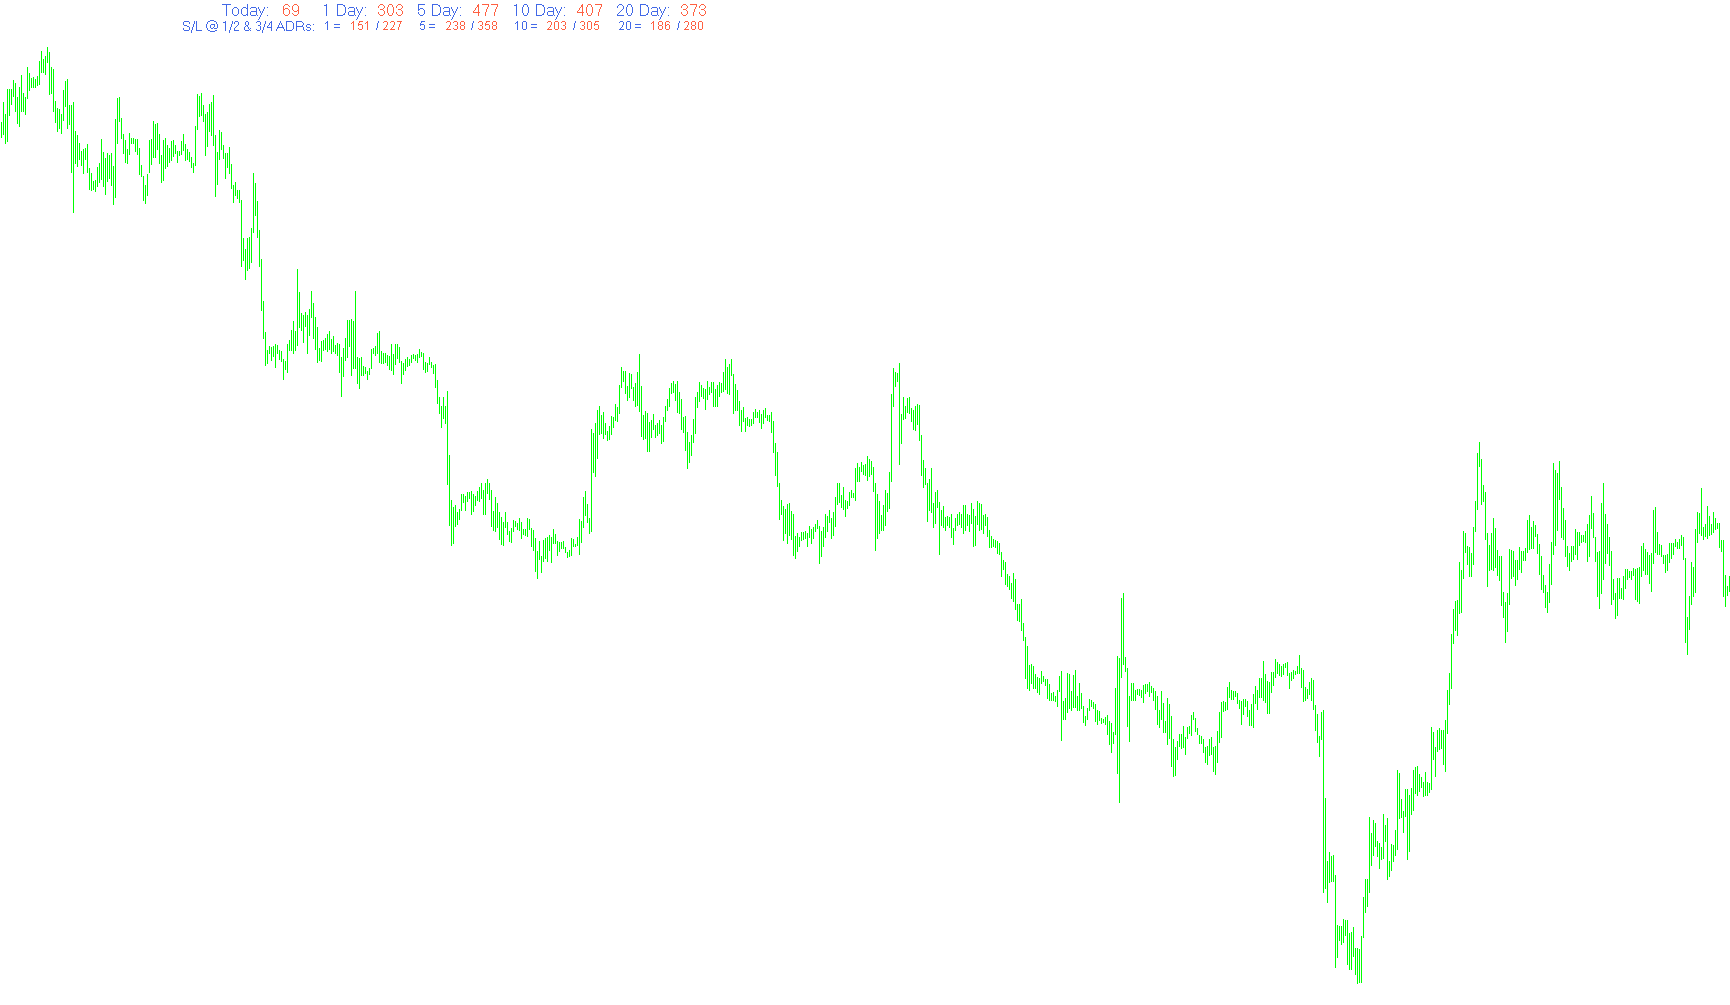
This indicator calculates a recursive smoothing factor based on the absolute deviation of the RSI from its midpoint to generate a dampened trend line.
AdaptiveCG
Indicator

AdaptiveCG

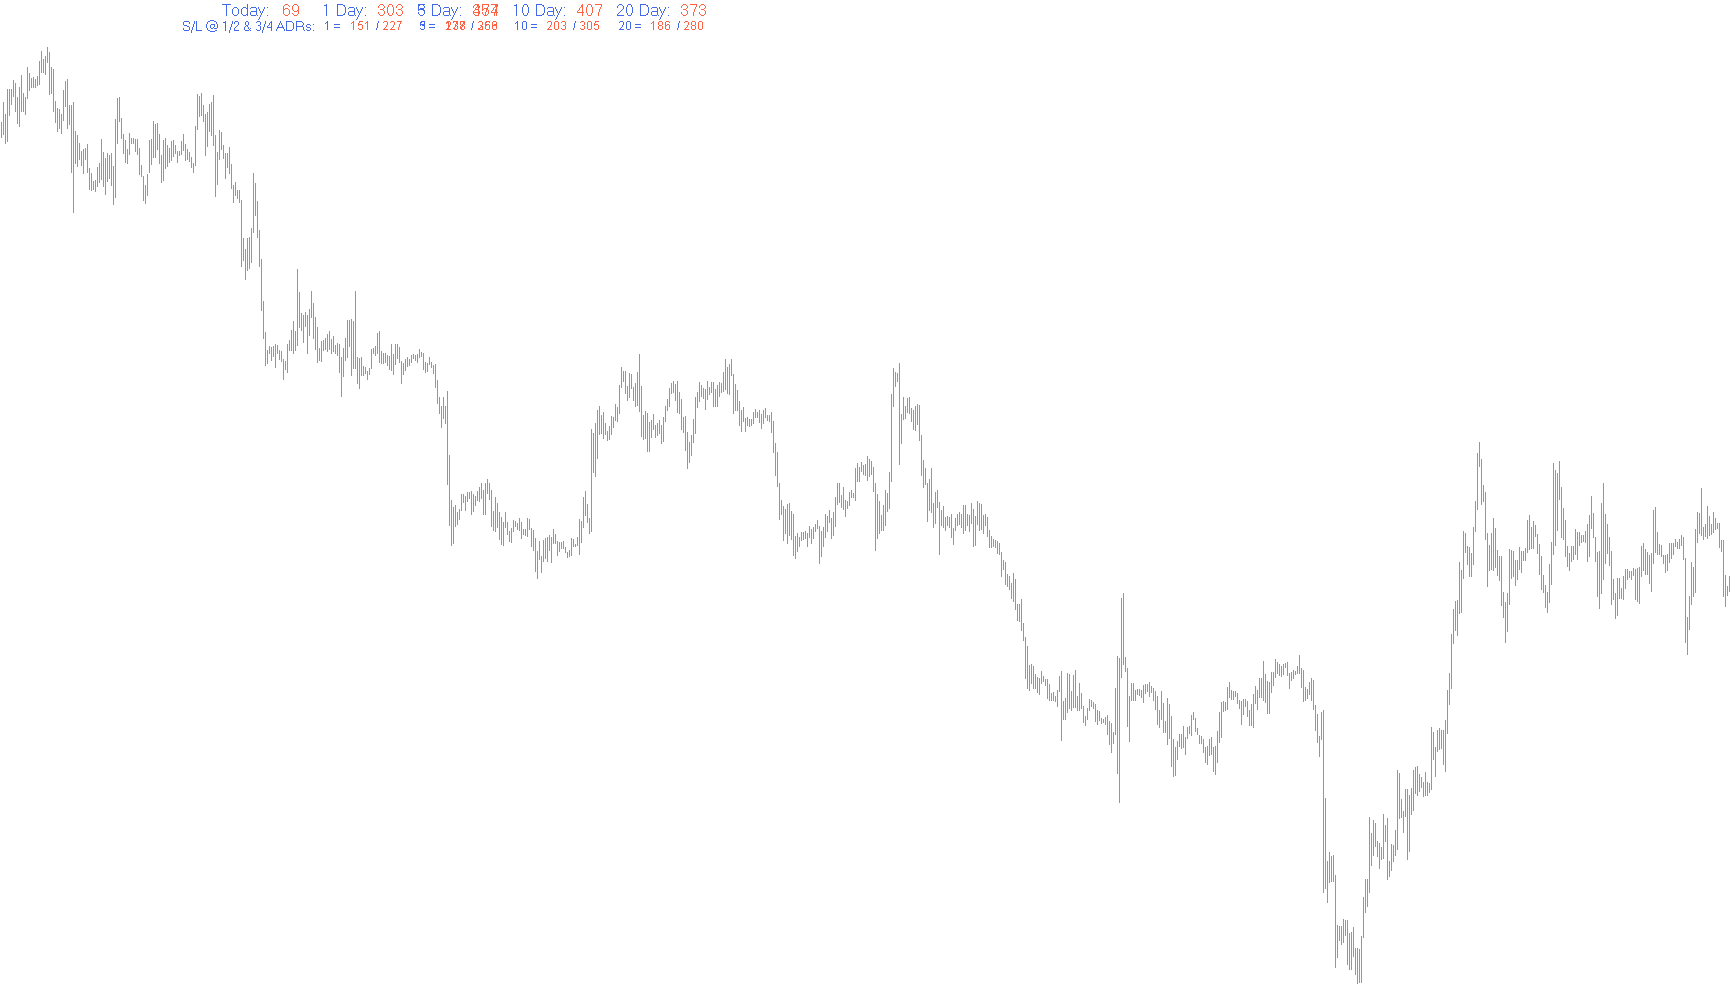
This code implements John Ehlers' Adaptive Center of Gravity oscillator, dynamically adjusting its calculation period based on market cycle length, providing signals via the CG line and its lagged trigger line.

AdaptiveCyberCycle
Indicator

AdaptiveCyberCycle

This indicator utilizes an adaptive period and recursive filtering to isolate dominant market cycles from noise for enhanced trend identification.

AdaptiveRVI
Indicator

AdaptiveRVI

This indicator calculates a momentum ratio by dividing the weighted sum of price changes over an adaptive look-back period by the weighted sum of high-low ranges.

Adaptive_IFish
Indicator

Adaptive_IFish

iMAOnArrayiRSI

This indicator synthesizes a normalized hyperbolic tangent oscillation by applying a linear weighted moving average to a cycle-adjusted Relative Strength Index.

Adaptosctry
Indicator

Adaptosctry

iFractalsiRSI
Adaptosctry_v1
Indicator

Adaptosctry_v1

iFractalsiRSI
Adaptosctry_v2
Indicator

Adaptosctry_v2

iFractalsiRSI
ADATAwave59
Indicator

ADATAwave59

adattiversi display NB
Indicator

adattiversi display NB

This indicator calculates the numerical delta of an Adaptive RSI value to visualize real-time price momentum intensity and trigger auditory alerts on significant volatility shifts.

adattiversi display
Indicator

adattiversi display

This indicator calculates the derivative of an Adaptive RSI to detect rapid momentum shifts and triggers an audible alert when price variance exceeds specific thresholds.

adr_sl-noline
Indicator

adr_sl-noline

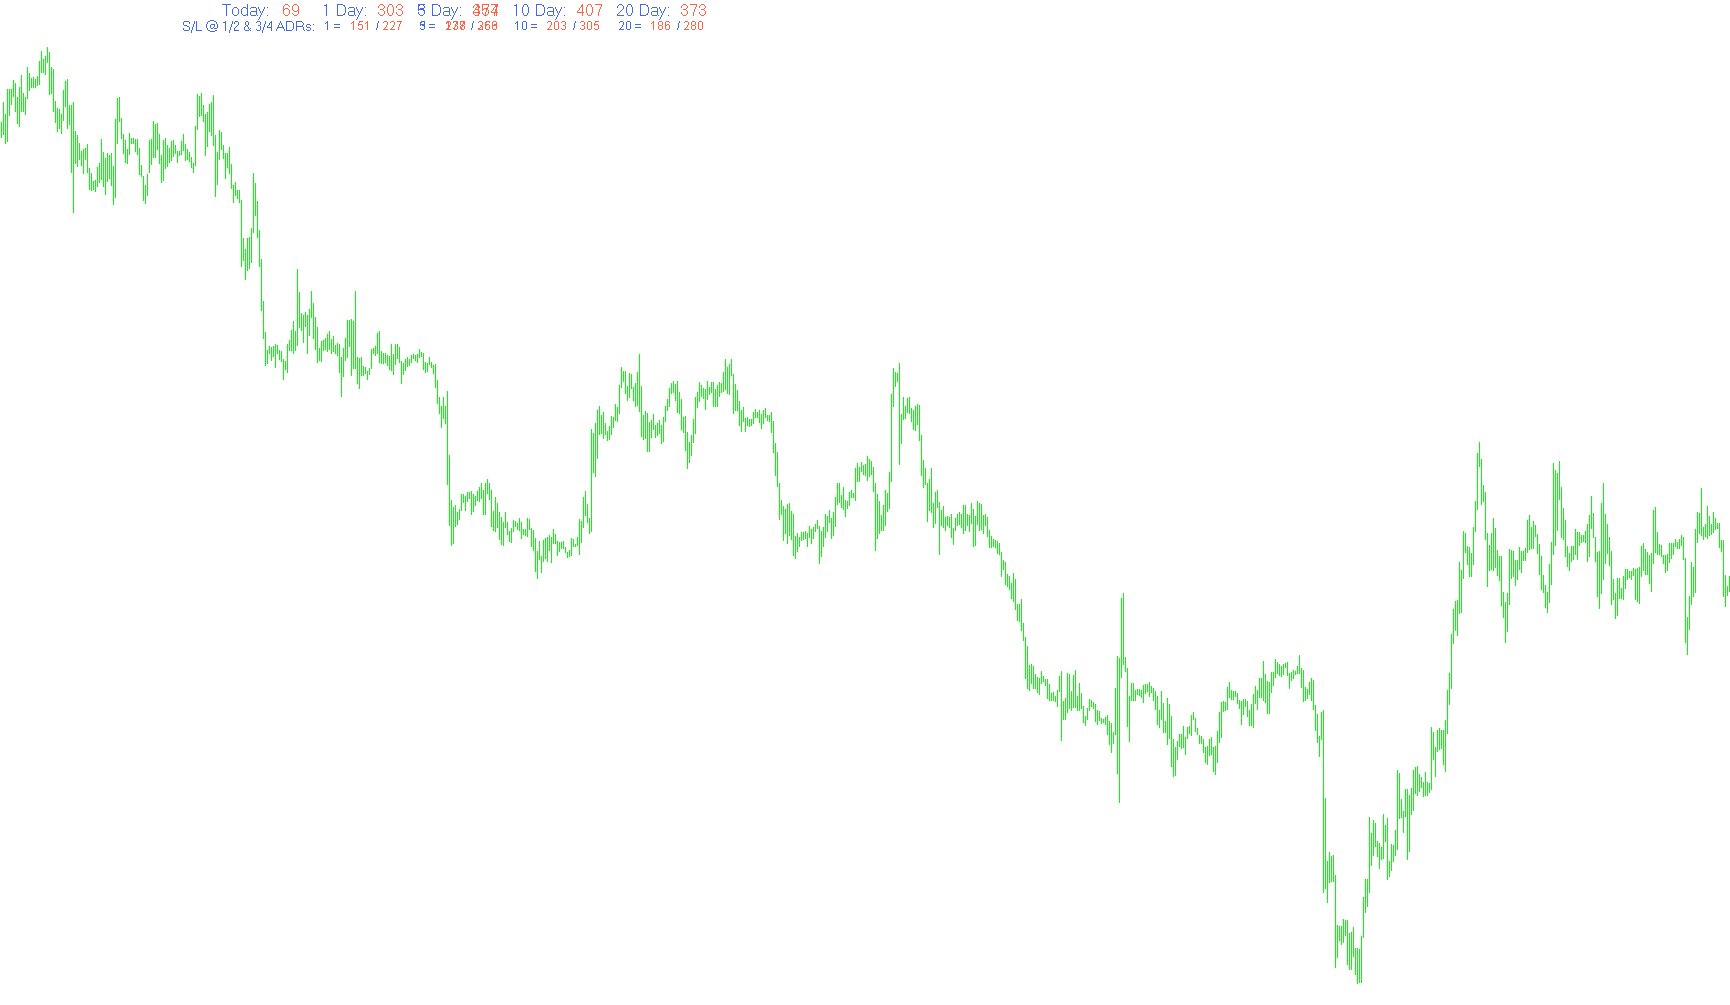
This indicator calculates and visualizes multi-period average daily ranges to provide precise stop-loss benchmarks based on proportional volatility contracts.

adr_sl-noline1
Indicator

adr_sl-noline1

This indicator quantifies multi-period historical price action to project real-time volatility metrics and automated stop-loss thresholds based on fractional daily ranges.

adr_sl-noline_mod
Indicator

adr_sl-noline_mod

This indicator calculates multi-period Average Daily Ranges and dynamically projects precise Stop Loss levels based on 50% and 75% retracement benchmarks.

adr__1_5_10_20_60
Indicator

adr__1_5_10_20_60

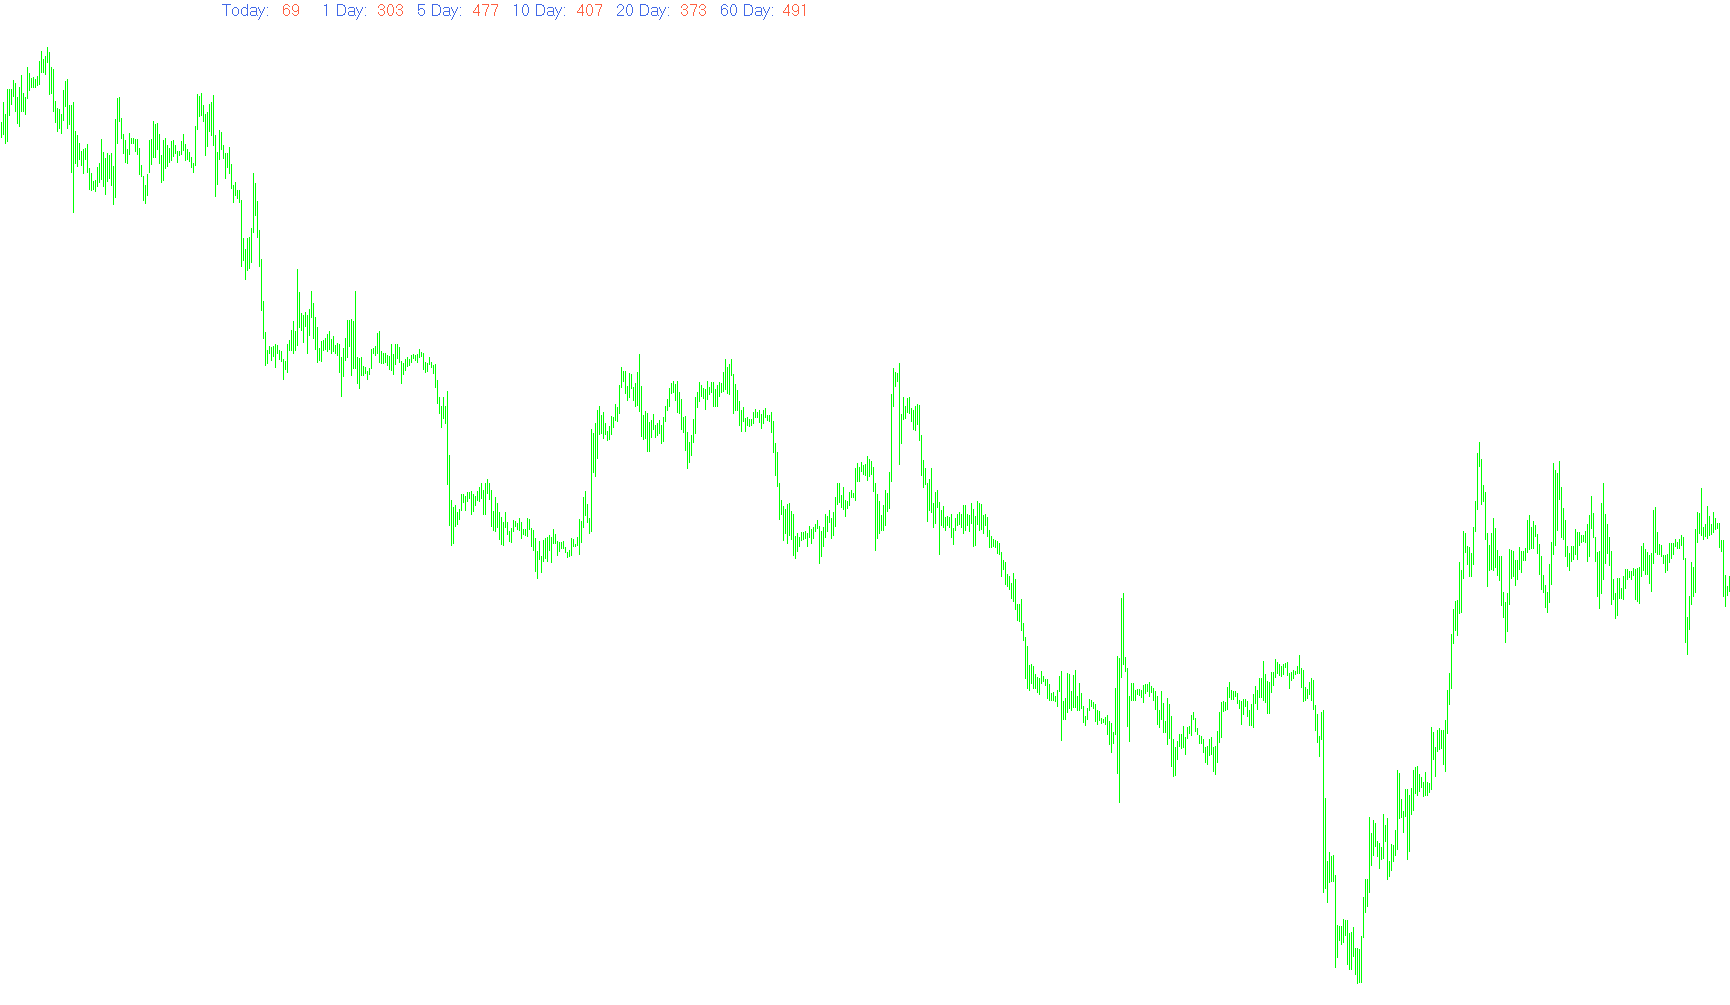
This indicator calculates multi-period Average Daily Ranges and dynamically projects stop-loss levels based on percentage offsets of historical volatility.

AdvancedGetOscillator
Indicator

AdvancedGetOscillator

iMA

This indicator calculates the divergence between two Simple Moving Averages based on median prices and applies a conditional smoothed transition to visualize directional momentum.

AdvancedGetOscillator_v1
Indicator

AdvancedGetOscillator_v1

iMA
Advanced_ADX
Indicator

Advanced_ADX

iADX

This indicator bifurcates the main ADX strength value into distinct histogram channels based on the relative dominance of the Positive and Negative Directional Indicators.

Advanced_ADX_v1
Indicator

Advanced_ADX_v1

iADX

This indicator filters the Absolute Direction Index to visualize dominant market momentum by assigning the primary trend magnitude to separate visual buffers based on the crossover of Positive and Negative Directed Indicators.

Advanced_ADX_v2
Indicator

Advanced_ADX_v2

iADX

The logic segregates the standard Average Directional Index into distinct visual streams based on the dominance of positive or negative directional movement relative to the main trend intensity.

Advanced_ADX_WithAlert
Indicator

Advanced_ADX_WithAlert

iADX

This indicator filters the ADX main line into distinct directional histograms by identifying whether the Plus DI or Minus DI dominates current market strength.

Advanced_ADX_WithAlert_001
Indicator

Advanced_ADX_WithAlert_001

iADX

This indicator visualizes market momentum strength by bifurcating the ADX main line into distinct bullish and bearish histogram components based on the directional orientation of DI+ and DI- vectors.

ADX Candles
Indicator

ADX Candles

iADX

This indicator dynamically visualizes trend direction and momentum strength by overlaying colored candles that react to PlusDI/MinusDI crossovers filtered by a specific ADX threshold.