5minYANS_IND_03_v1
Download script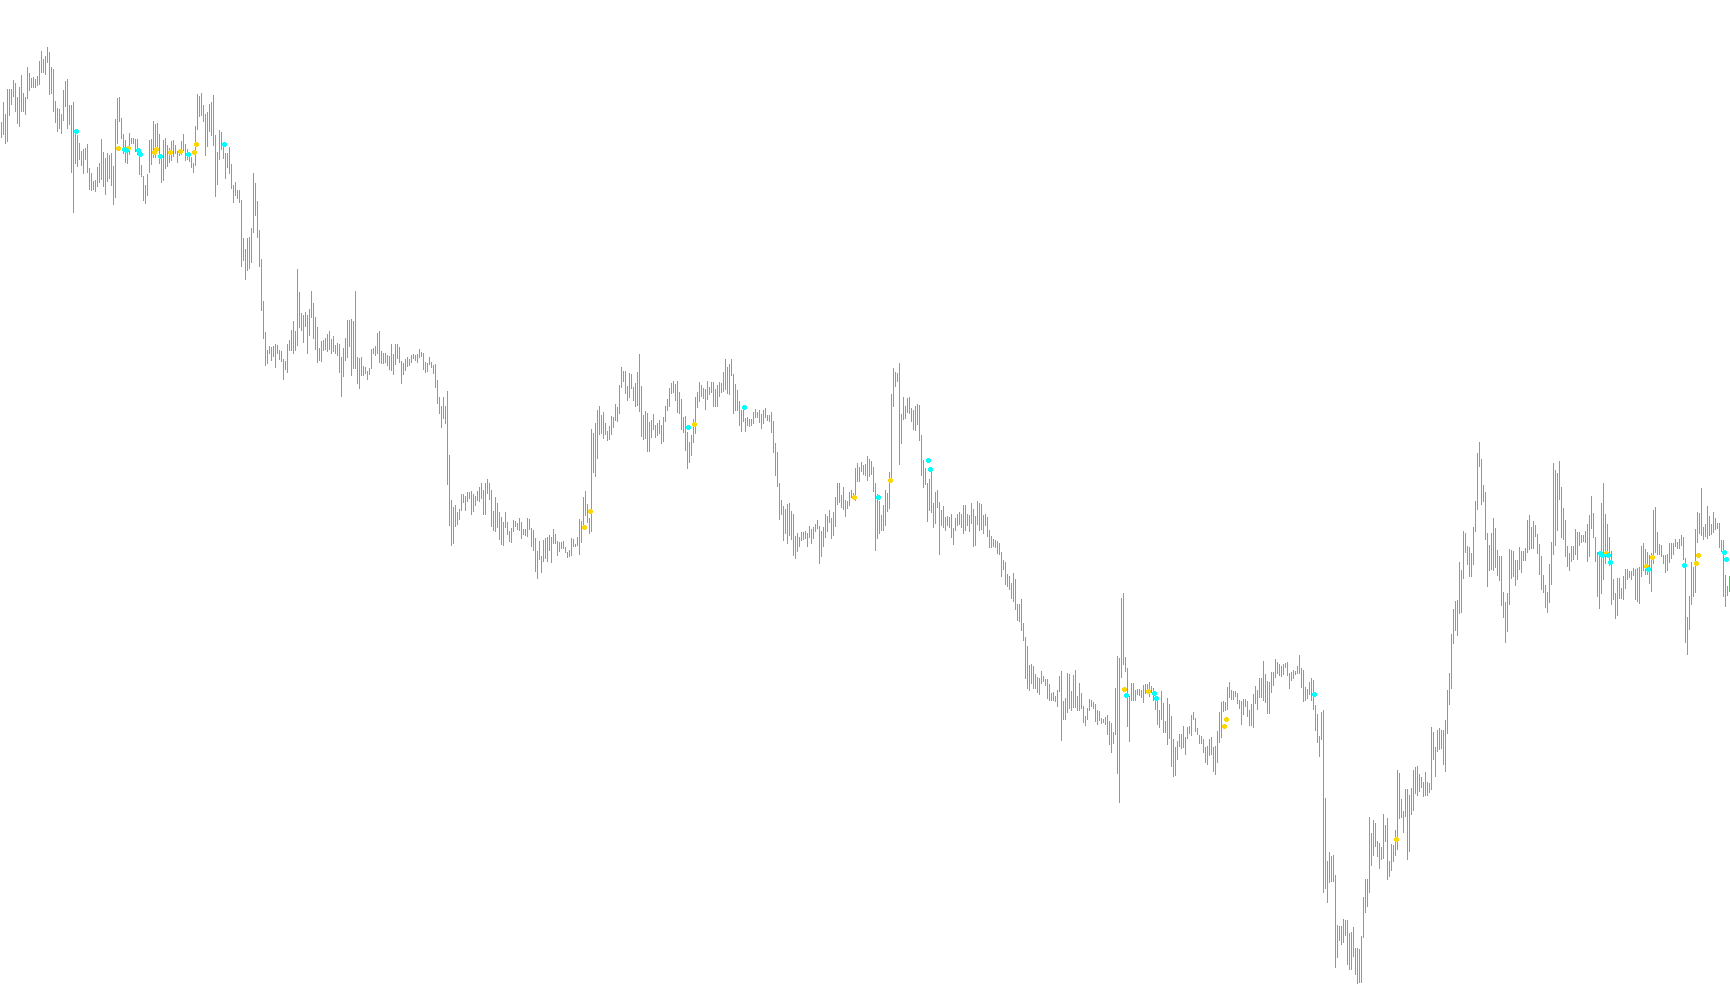
Technical Logic Overview: 5 Min RSI Qualitative Indicator
This script is designed as a visual trading assistant for MetaTrader, specifically engineered to identify trend shifts and momentum transitions on a 5-minute timeframe. Rather than providing a single line on your chart, it translates complex mathematical data into clear visual signals (arrows and boxes) to help traders distinguish between active market movements and "noise."
Core Logic & Indicators Used
The script monitors three primary technical components simultaneously to determine the overall health of the price action:
- Exponential Moving Averages (EMA): It tracks two different speeds of moving averages—a short-term (10-period) and a long-term (40-period).
- Parabolic SAR (Stop and Reverse): This is used to detect potential reversals in price momentum by measuring how quickly the price is pulling away from its mean.
How the Signal Logic Works
The script operates by looking for specific "crossovers" and "qualifications" to ensure that a signal is significant enough to act upon. Here is the step-by-step logic:
-
Trend Identification (EMA Cross): The system constantly compares the 10-period EMA against the 40-period EMA. When the short-term average crosses above the long-term average, it signals a potential bullish (rising) trend. Conversely, when it crosses below, it signals a bearish (falling) trend. These are the primary markers for identifying new directionality.
-
Momentum Filtering: One of the most important parts of this script is its "Qualitative" logic. It doesn't just fire a signal every time a line moves; it checks for "Distance from Last Cross." By counting how many periods have passed since the last major trend shift, the script attempts to filter out choppy markets where prices are oscillating back and forth without clear direction.
-
The SAR Reversal Logic: The script monitors the Parabolic SAR's position relative to the price highs and lows.
- If the SAR is trending upward and hits a specific threshold, it marks a reversal point.
- To increase accuracy, the script checks if the market has been in a stable trend for a sufficient amount of time (the "Distance" check) before confirming these points. This helps ensure you aren't entering a trade during a momentary fluctuation.
Visual Output
Instead of showing the user complex tables of numbers, the logic is translated into eight different visual buffers:
- Directional Arrows: These appear on the chart to highlight specific points where the moving averages have crossed or where the Parabolic SAR has signaled a reversal.
- Trend Boxes: The script includes logic to highlight specific "Qualitative" zones (Red and White markers) that indicate high-probability areas where momentum and trend distance align perfectly.
Summary for the Trader
In simple terms, this script acts as a filter. It looks at the "speed" of the price (EMA) and the "reversal potential" (SAR). It only places visual markers on your chart when these two factors agree that a significant trend shift is occurring, while attempting to ignore the minor, inconsistent price movements that often lead to false signals in fast-moving 5-minute markets.
/*-----------------------------+
|			       |
| Shared by www.Aptrafx.com    |
|			       |
+------------------------------*/

//+------------------------------------------------------------------+
//| 5 Min RSI 12-period qual INDICATOR                               |
//+------------------------------------------------------------------+
#property copyright "Ron T"
#property link      "http://www.lightpatch.com"

#property indicator_chart_window
#property indicator_buffers 8

#property indicator_color1 Red
#property indicator_color2 HotPink
#property indicator_color3 Red
#property indicator_color4 MistyRose

#property indicator_color5 White
#property indicator_color6 LightGray
#property indicator_color7 White
#property indicator_color8 DarkGray


//---- buffers
double Buffer1[];
double Buffer2[];
double Buffer3[];
double Buffer4[];
double Buffer5[];
double Buffer6[];
double Buffer7[];
double Buffer8[];


// User Input


//+------------------------------------------------------------------+
//| Custom indicator initialization function                         |
//|------------------------------------------------------------------|

int init()
  {

   // 233 up arrow
   // 234 down arrow
   // 159 big dot
   // 168 open square
   // 120 box with X

   SetIndexStyle(0,DRAW_ARROW);
   SetIndexBuffer(0, Buffer1);
   SetIndexArrow(0,159);  //up

   SetIndexStyle(1,DRAW_ARROW);
   SetIndexBuffer(1, Buffer2);
   SetIndexArrow(1,159);  //down

   SetIndexStyle(2,DRAW_ARROW);
   SetIndexBuffer(2, Buffer3);
   SetIndexArrow(2,120);

   SetIndexStyle(3,DRAW_ARROW);
   SetIndexBuffer(3, Buffer4);
   SetIndexArrow(3,159);

   SetIndexStyle(4,DRAW_ARROW);
   SetIndexBuffer(4, Buffer5);
   SetIndexArrow(4,159);

   SetIndexStyle(5,DRAW_ARROW);
   SetIndexBuffer(5, Buffer6);
   SetIndexArrow(5,159);

   SetIndexStyle(6,DRAW_ARROW);
   SetIndexBuffer(6, Buffer7);
   SetIndexArrow(6,120);

   SetIndexStyle(7,DRAW_ARROW);
   SetIndexBuffer(7, Buffer8);
   SetIndexArrow(7,159);

   return(0);
  }


//+------------------------------------------------------------------+
//| Custor indicator deinitialization function                       |
//+------------------------------------------------------------------+
int deinit()
  {
   int i;

   for( i=0; i<Bars; i++ ) Buffer1[i]=0;
   for( i=0; i<Bars; i++ ) Buffer2[i]=0;
   for( i=0; i<Bars; i++ ) Buffer3[i]=0;
   for( i=0; i<Bars; i++ ) Buffer4[i]=0;
   for( i=0; i<Bars; i++ ) Buffer5[i]=0;
   for( i=0; i<Bars; i++ ) Buffer6[i]=0;
   for( i=0; i<Bars; i++ ) Buffer7[i]=0;
   for( i=0; i<Bars; i++ ) Buffer8[i]=0;

   return(0);
  }


//+------------------------------------------------------------------+
//| Custom indicator iteration function                              |
//+------------------------------------------------------------------+

// Current position if 55/45 or over/under. Does any of
// the previous 'qual' period ever fall below55/above45? (last11)
//
// If qual*2 periods have been above55/below45
// then lets not try to transact any more (last22)


int start()
  {
   int      pos=Bars-100; // leave room for moving average periods

   double   cEMA10=0, pEMA10=0;
   double   cEMA40=0, pEMA40=0;
   double   cSAR=0,   pSAR=10;

   int      dCROSS;    // how many periods since last MA cross

   int      above=0;   // how long SAR has been up
   int      below=0;   // how long SAR has been down


   while(pos>=0)
     {

      cEMA10=iMA(Symbol(),0,10,0,MODE_EMA,PRICE_CLOSE, pos);
      pEMA10=iMA(Symbol(),0,10,0,MODE_EMA,PRICE_CLOSE, pos+1);
      cEMA40=iMA(Symbol(),0,40,0,MODE_EMA,PRICE_CLOSE, pos);
      pEMA40=iMA(Symbol(),0,40,0,MODE_EMA,PRICE_CLOSE, pos+1);
      cSAR=iSAR(Symbol(),0,0.02,0.2,pos);
      pSAR=iSAR(Symbol(),0,0.02,0.2,pos+1);

      // first off, mark the moving average cross
      // and clear the distance-to-last-cross counter
      // if there is a up or down cross
      if (pEMA10<cEMA40 && cEMA10>cEMA40)
        {
         Buffer1[pos]=cEMA10; // rising cross
         dCROSS=0;
        }
      if (pEMA10>cEMA40 && cEMA10<cEMA40)
        {
         Buffer5[pos]=cEMA10; // falling cross
         dCROSS=0;
        }

/*      if (pSAR<cEMA40 && cSAR>cEMA40) Buffer4[pos]=cEMA40; //rising SAR/EMA40 cross
      if (pSAR>cEMA40 && cSAR<cEMA40) Buffer8[pos]=cEMA40; //falling SAR/EMA40 cross

      if (cSAR>High[pos]) above++;  // count how long SAR has been up
      if (cSAR<Low[pos])  below++;  // count how long SAR has been down

      if (pSAR<cSAR && cSAR>=High[pos])
        {
         Buffer2[pos]=cSAR;                             // rising SAR
         if (below<=7 && dCROSS>=7) Buffer3[pos]=cSAR;  // Box Indicator RED
         above=0;
         below=0;
        }

      if (pSAR>cSAR && cSAR<=Low[pos])
        {
         Buffer6[pos]=cSAR;                             // falling SAR
         if (above<=7 && dCROSS>=7) Buffer7[pos]=cSAR;  // Box Indicator WHITE
         above=0;
         below=0;
        }
*/
      dCROSS++;                            // distance from any cross

 	   pos--;
     }

   return(0);
  }
//+------------------------------------------------------------------+
Comments