2pbIdeal3MA_nk
Indicator

2pbIdeal3MA_nk

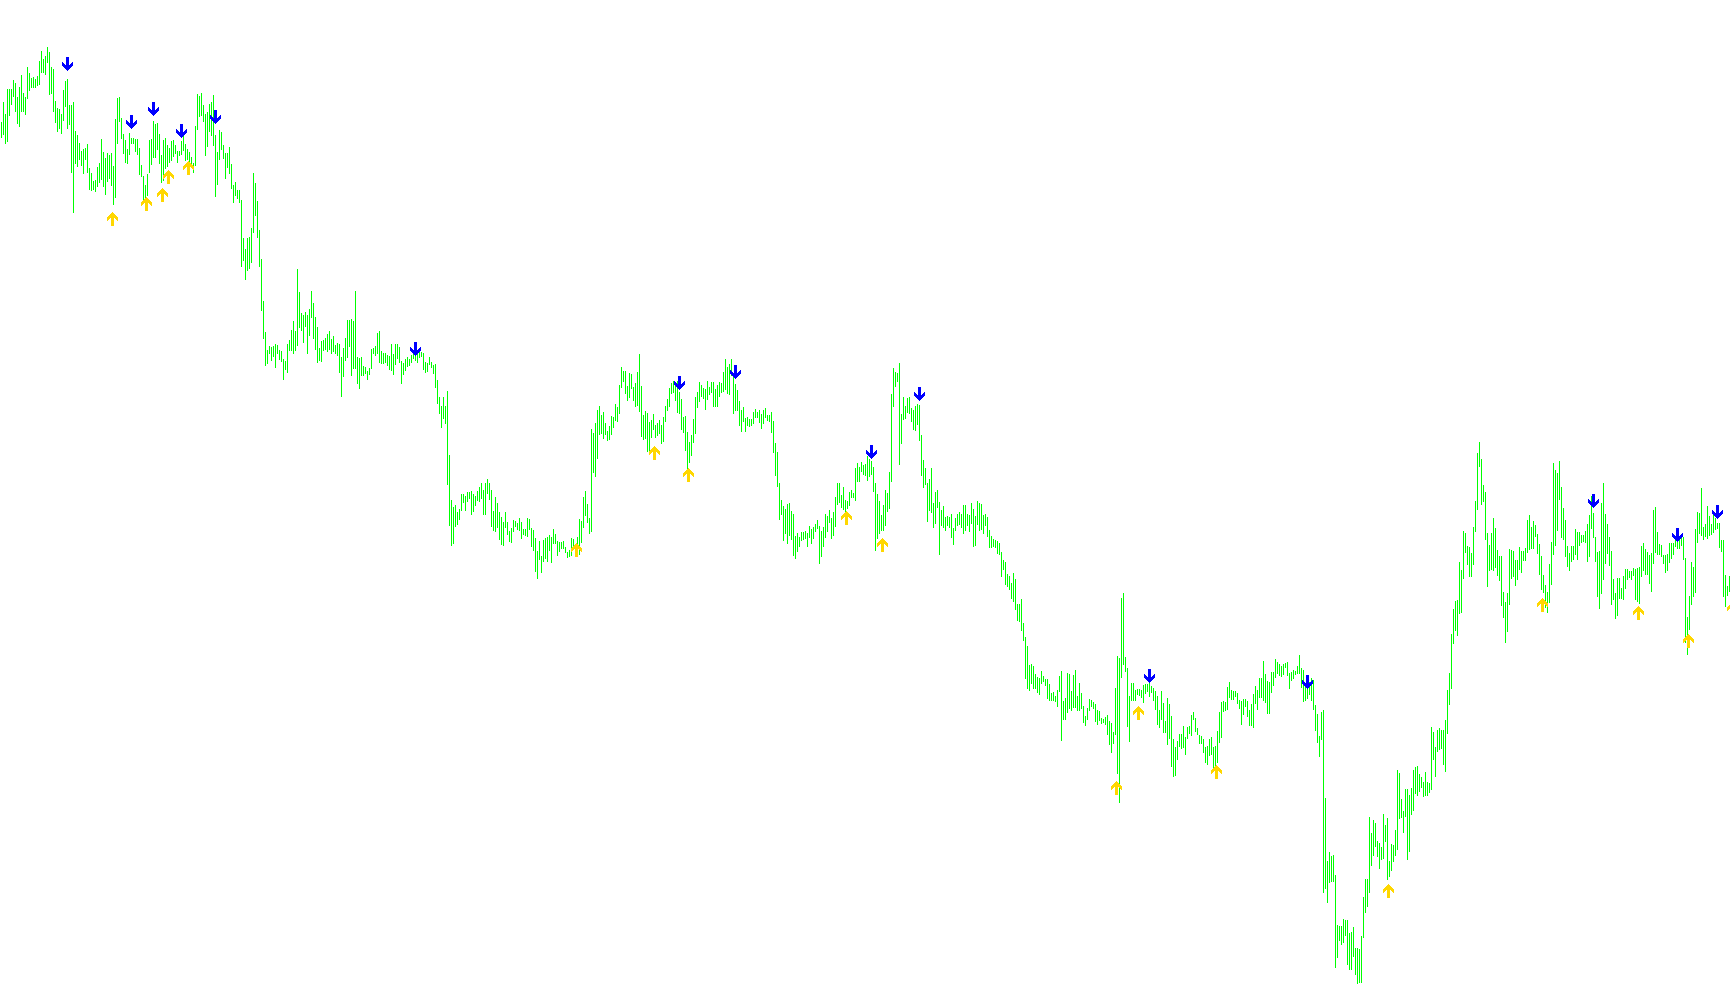
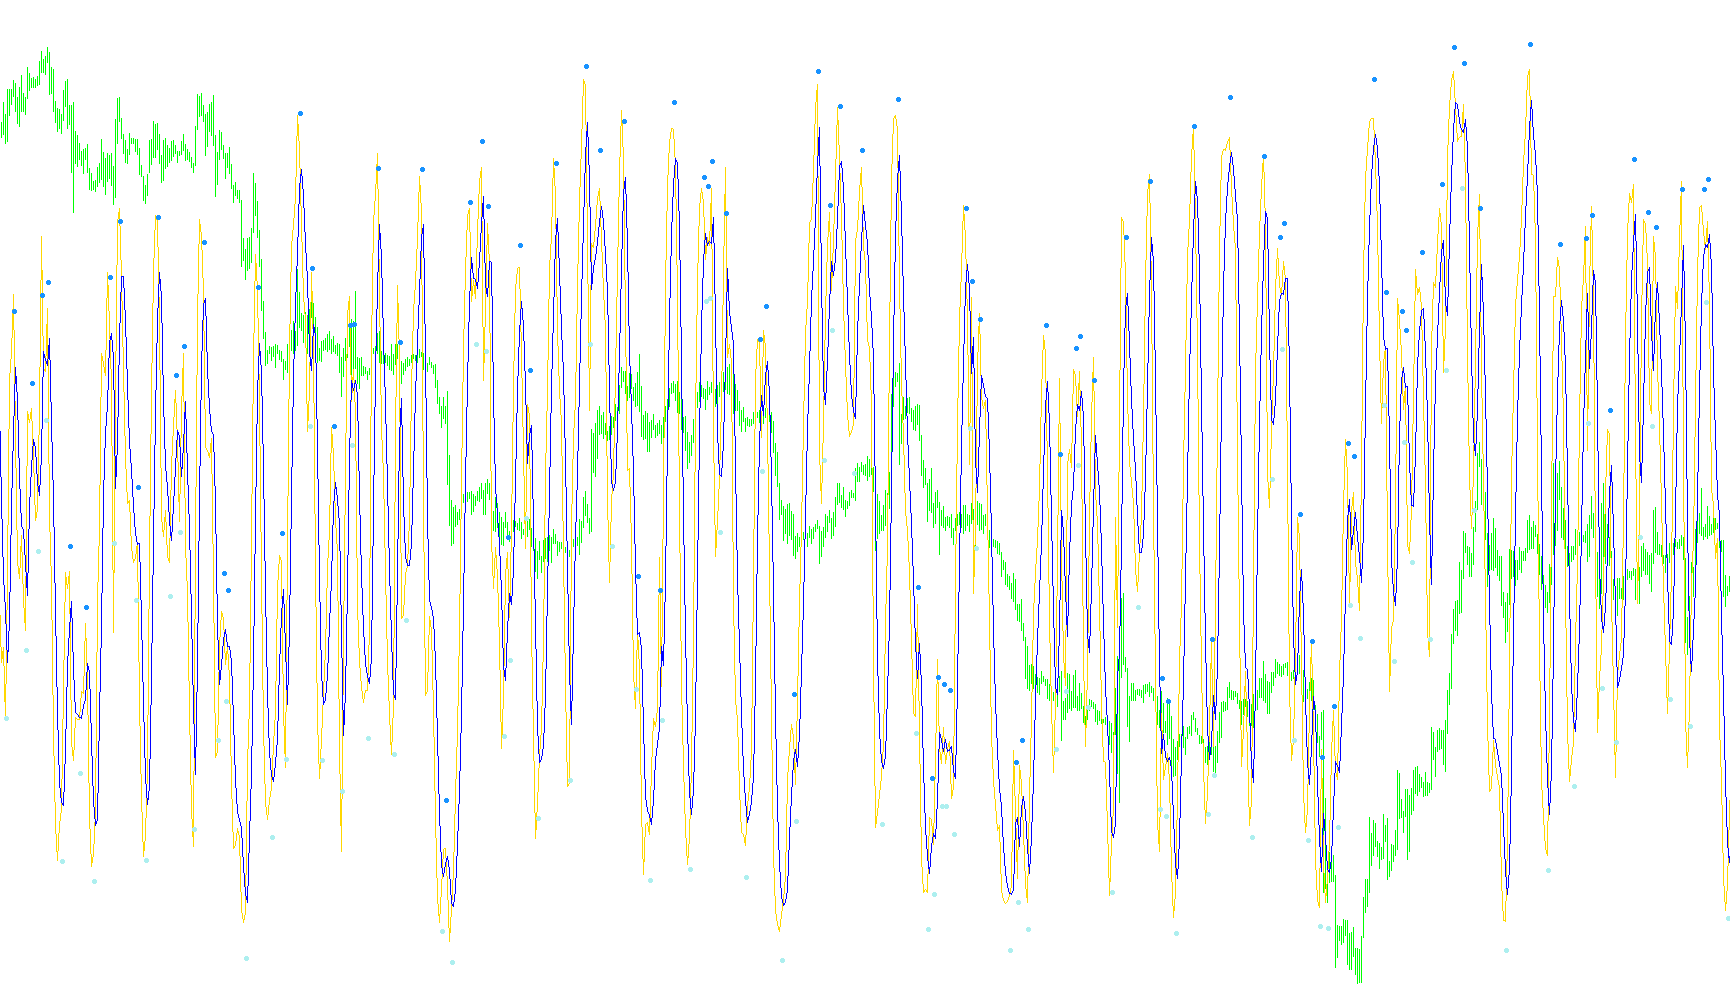
This indicator calculates a multi-layered smoothing effect by nesting three consecutive 2p-Ideal Moving Average computations to filter market noise.

2pbIdealMA_nk
Indicator

2pbIdealMA_nk

This algorithm calculates a dynamic trend line by applying a recursive weighting formula that incorporates price velocity and non-linear variance to reduce lag.

2rsi-01
Indicator

2rsi-01

iRSI

Identifies bullish and bearish trend shifts by detecting consecutive increasing or decreasing Relative Strength Index values across a multi-bar lookback period.

2rsi-01_v1
Indicator

2rsi-01_v1

iRSI
2x5 MA CROSS WITH SOUND
Indicator

2x5 MA CROSS WITH SOUND

iMA

This indicator identifies precise trend reversals by detecting geometric intersections between two customizable moving averages of varying calculation modes.

2ZZ+Signal_
Indicator

2ZZ+Signal_

This indicator identifies trend reversals by correlating multi-depth ZigZag extremes with Snake SSRC momentum filters and price volatility thresholds.

2_2_MA
Indicator

2_2_MA

iMA
3 ma cross alert
Indicator

3 ma cross alert

iMA
3 ma cross email_alert
Indicator

3 ma cross email_alert

iMA

This indicator identifies bullish or bearish momentum shifts by detecting when both the fast and medium moving averages simultaneously cross above or below a slower trend baseline.

3 MA Cross w_Alert v2
Indicator

3 MA Cross w_Alert v2

iMA
3 MA Cross w_Alert v2_001
Indicator

3 MA Cross w_Alert v2_001

iMA
3 MA Cross w_Alert v2_003
Indicator

3 MA Cross w_Alert v2_003

iMA
3 MA Cross w_Alert v2_v1
Indicator

3 MA Cross w_Alert v2_v1

iMA
3 MA Cross w_Alert
Indicator

3 MA Cross w_Alert

iMA

This indicator identifies bullish and bearish trend shifts by detecting when two fast moving averages simultaneously breach a slower primary moving average in the same direction.

3 MA Cross w_Alert_v1
Indicator

3 MA Cross w_Alert_v1

iMA
Indicator

3 MAs Cross Arrows

iMA
3 MAs Cross Arrows_001
Indicator

3 MAs Cross Arrows_001

iMA

The indicator identifies bullish and bearish trend shifts by detecting when two short-term moving averages simultaneously breach a longer-term baseline moving average.

33_M3
Indicator

33_M3

iMomentum
3barpullback
Indicator

3barpullback

This indicator identifies bullish and bearish reversals by detecting consecutive descending highs or ascending lows coupled with significant price action shifts relative to a ten-bar historical lookback.

3colorMACD
Indicator

3colorMACD

iMAiMAOnArray

This indicator visualizes the acceleration of MACD momentum by segregating price velocity into distinct color-coded histogram bars based on whether the direction is strengthening, weakening, or consolidating.

3colorMACD_001
Indicator

3colorMACD_001

iMAiMAOnArray
3colorMACD_002
Indicator

3colorMACD_002

iMAiMAOnArray

This indicator differentiates momentum velocity by categorizing MACD histogram fluctuations into distinct visual segments based on positive, negative, or stagnant directional shifts.

3colorMACD_v1
Indicator

3colorMACD_v1

iMAiMAOnArray

This indicator segments MACD volatility into three distinct visual channels to differentiate between accelerating, decelerating, and stagnant momentum shifts.

3color_ J_TPO
Indicator

3color_ J_TPO

This indicator calculates the Time Price Opportunity (TPO) variance and visualizes directional momentum shifts through a three-color histogram representing price acceleration, deceleration, and equilibrium.

3color_MACD
Indicator

3color_MACD

iMAiMAOnArray

This indicator differentiates price momentum trends by dynamically color-coding MACD histograms based on the direction of the rate of change between consecutive bars.

Indicator

3color_RSX_H

3Color_RVI_Hist
Indicator

3Color_RVI_Hist

iMAOnArray

This indicator quantifies price vigor by calculating the ratio of close-to-open movement against total candle range, then mapping its momentum shifts into a three-toned histogram based on signal line direction.

3c_dm_363
Indicator

3c_dm_363

This indicator computes a complex linear combination of historical closing prices to derive a weighted momentum differential, categorizing price movements into bullish, bearish, or neutral trends based on directional shifts.

Indicator

3c_JDemark

iDeMarker
Indicator

3c_JDemarkX

3c_JRSX_H
Indicator

3c_JRSX_H

A refined momentum indicator that utilizes Jurik Research's proprietary smoothing algorithms to reduce noise and provide a fluid curve compared to the standard RSI.

Indicator

3c_JRSX_Hs range_Alerts_v1

3c_JRSX_H_001
Indicator

3c_JRSX_H_001

3c_JRSX_H_v1
Indicator

3c_JRSX_H_v1

This indicator utilizes an advanced Jurik-style smoothing algorithm to calculate a normalized momentum oscillator with reduced noise and improved curve fluidity compared to standard RSI.

3c_JRSX_H_v2
Indicator

3c_JRSX_H_v2

This indicator employs sophisticated Jurik smoothing algorithms to calculate a momentum oscillator that minimizes noise and provides a fluid curve structure analogous to the RSI.

3c_JRSX_H_v3
Indicator

3c_JRSX_H_v3

A refined momentum oscillator that utilizes Jurik smoothing algorithms to eliminate noise and produce a fluid, high-precision curve for identifying trend reversals.

3c_Turbo_JRSX_Filtered
Indicator

3c_Turbo_JRSX_Filtered

A momentum-based oscillator utilizing triple smoothed price action and absolute variance analysis to identify directional velocity shifts.

3c_Turbo_JRSX_wAppliedPrice
Indicator

3c_Turbo_JRSX_wAppliedPrice

3D Oscilator
Indicator

3D Oscilator

iCCIiRSI

This indicator synthesizes Relative Strength Index (RSI), Stochastic behavior, and Commodity Channel Index (CCI) into a smoothed, multi-layered momentum signal for identifying trend exhaustion.

3D Oscilator_v1
Indicator

3D Oscilator_v1

iCCIiRSI

This indicator constructs a multi-layered momentum oscillator by fusing RSI relative strength, Stochastic peak normalization, and CCI tunnel dynamics into a smoothed signal curve.

3D Oscilator_v2
Indicator

3D Oscilator_v2

iCCIiRSI

This indicator synthesizes RSI relative strength, stochastic normalization, and CCI tunnel dynamics into a dual-smoothed multi-dimensional momentum oscillator.

3D_Oscilator
Indicator

3D_Oscilator

iCCIiRSI
3D_Oscilator_v1
Indicator

3D_Oscilator_v1

iCCIiRSI

This indicator synthesizes RSI relative strength, Stochastic momentum, and CCI price deviation into a dual-smoothed signal line to identify trend exhaustion and pivot crossovers.

3end
Indicator

3end

Calculates a composite momentum value derived from the mathematical relationship between three distinct currency pairs to identify price divergence.

3end_v1
Indicator

3end_v1

Indicator

3FoldTradingFilterforEA

3FoldTradingHours
Indicator

3FoldTradingHours

The indicator identifies active market sessions by validating the current server hour against three distinct user-defined temporal windows.

3FoldTradingHoursSeparateWindow
Indicator

3FoldTradingHoursSeparateWindow

A multi-layered temporal monitoring tool that provides real-time visual validation of permitted trading windows across three distinct customizable timeframes.

3FoldTradingHours_v1
Indicator

3FoldTradingHours_v1

This indicator monitors the current market time against three distinct user-defined windows to visually signal active and inactive trading zones on the chart.

3in1_ST_RSI_CCI
Indicator

3in1_ST_RSI_CCI

iCCIiMAOnArrayiRSIiStochastic

This indicator synthesizes Stochastic, RSI, and CCI oscillators into a unified momentum stream, applying linear weighting to calculate dual moving average crossovers for trend identification.