5 bar reversal v0[1][1].5
Download script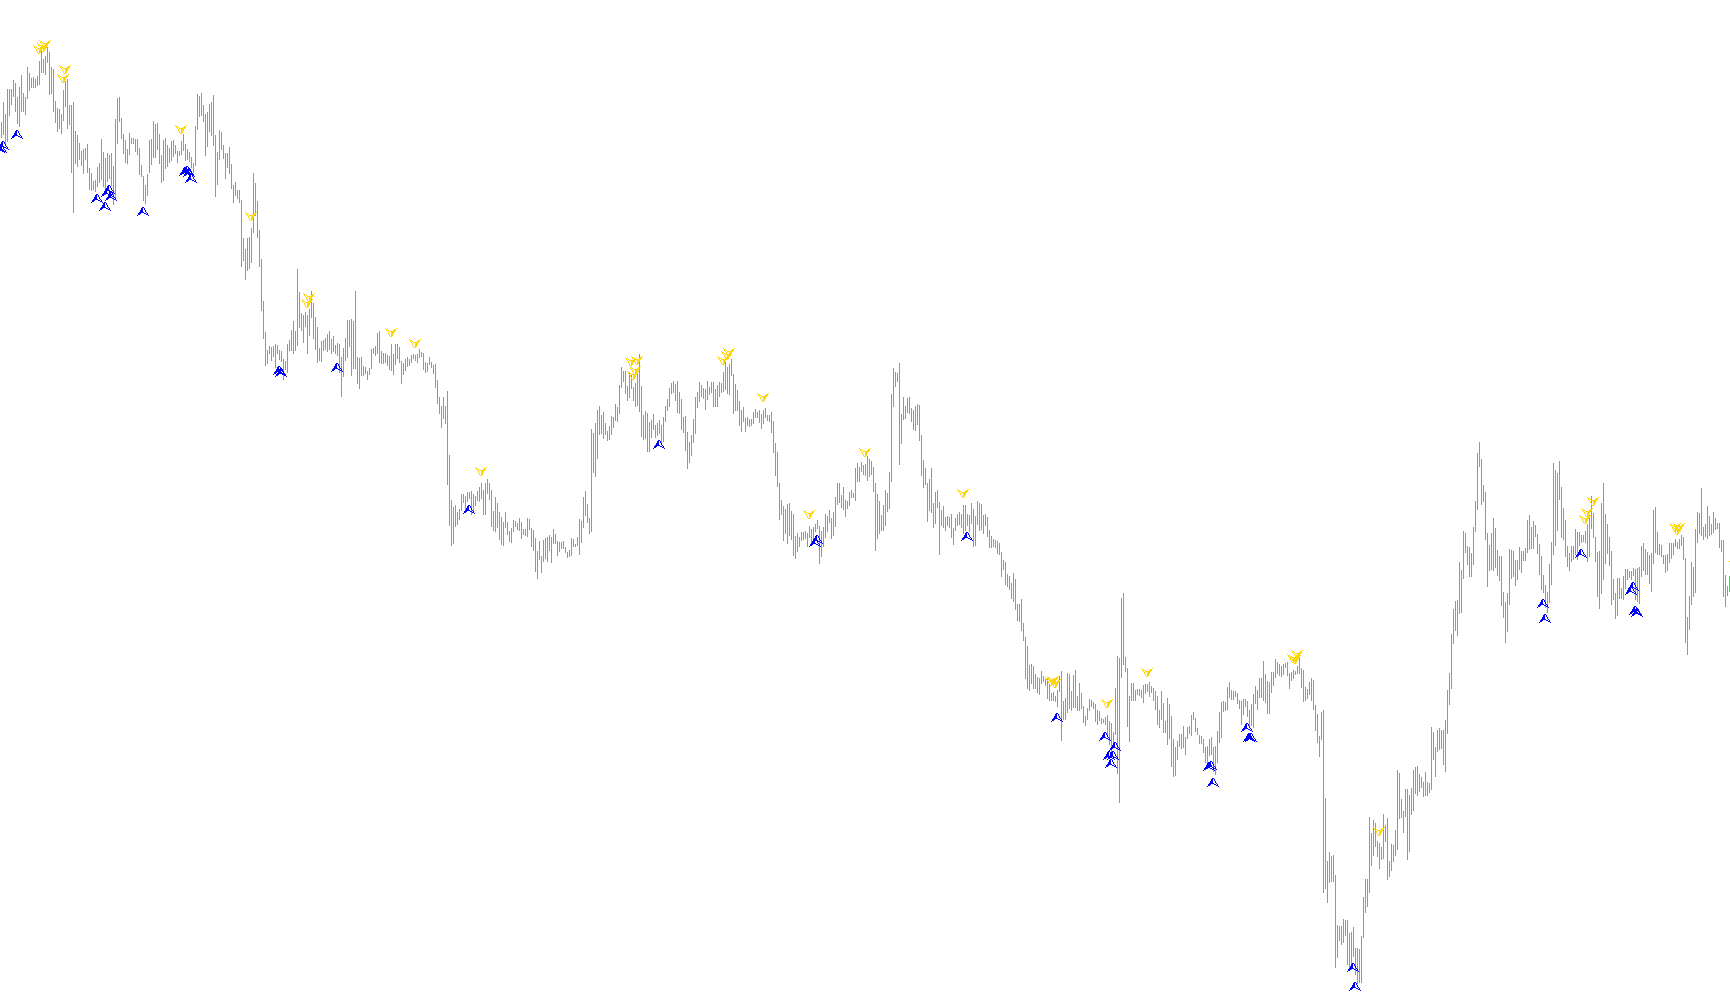
This script is designed as a visual trading tool that identifies specific price action patterns by comparing current market movements against historical data. It works by scanning the chart to detect "extremes"—specifically the highest highs and lowest lows—over a rolling window of five bars.
Core Logic and Behavior
The indicator monitors the relationship between two distinct time periods: the immediate recent candles and a slightly older set of candles (offset by five positions). By analyzing these two windows, the script looks for significant "breakout" or "rejection" behaviors in the following ways:
- Identifying Price Strength: The logic captures the highest price point reached in the most recent 5-bar period and compares it to the highest price reached in the previous 5-bar period.
- Detecting Momentum Shifts: It simultaneously tracks the lowest price points of these two periods and the closing price of the current candle.
Visual Signals
The script provides visual cues on the chart using specific arrows to highlight two distinct types of market conditions:
-
Upward Breakout Signals (Red Arrows): An arrow is triggered when the high point of the recent period surpasses the high point of the previous period, while the current closing price remains below the low of that previous period. This helps identify specific moments where the price is attempting to break out of a defined range with significant volatility.
-
Downward Breakout Signals (Yellow Arrows): An arrow is triggered when the low point of the recent period falls below the low of the previous period, while the current closing price remains above the high of that previous period. This identifies instances where the market is pushing into new territory from below.
Summary for the User
Instead of providing a constant stream of data, this script acts as a filter. It ignores standard market noise and only places an arrow on your chart when the price action satisfies a specific geometric requirement: a clear "break" in the relative highs or lows of the preceding five candles. This allows traders to visually pinpoint areas where the market may be expanding into new territory.
//+------------------------------------------------------------------+
//|                                                       5 Bars.mq4 |
//|                      Copyright © 2006, EvgeniX                   |
//|
//+------------------------------------------------------------------+
#property copyright "Copyright © 2006, EvgeniX"
#property link      "EvgeniX"

#property indicator_chart_window
#property indicator_buffers 2
#property indicator_color1 Red
#property indicator_color2 Yellow
//---- buffers
double ExtMapBuffer1[];
double ExtMapBuffer2[];

double fhigh;
double flow;
double fclose;

double shigh;
double slow;
double sclose;


//+------------------------------------------------------------------+
//| Custom indicator initialization function                         |
//+------------------------------------------------------------------+
int init()
  {
//---- indicators
   SetIndexStyle(0,DRAW_ARROW);
   SetIndexArrow(0,218);
   SetIndexBuffer(0,ExtMapBuffer1);
   SetIndexEmptyValue(0,0.0);
   SetIndexStyle(1,DRAW_ARROW);
   SetIndexArrow(1,217);
   SetIndexBuffer(1,ExtMapBuffer2);
   SetIndexEmptyValue(1,0.0);
//----
   return(0);
  }
//+------------------------------------------------------------------+
//| Custor indicator deinitialization function                       |
//+------------------------------------------------------------------+
int deinit()
  {
//----

//----
   return(0);
  }
//+------------------------------------------------------------------+
//| Custom indicator iteration function                              |
//+------------------------------------------------------------------+
int start()
  {
   int    counted_bars=IndicatorCounted();
//----
  for(int i=1;i<=5000;i++)
    {


shigh=High[Highest(NULL, 0,2,5,i)];
slow=Low[Lowest(NULL,0,1,5,i)];
sclose=Close[i];

fhigh=High[Highest(NULL, 0, 2, 5, (i+5))];
flow=Low[Lowest(NULL,0,1,5,(i+5))];
fclose=Close[i+9];

//ExtMapBuffer2[i+5]=High[i]+0.0005;

//ExtMapBuffer1[i]=High[i]+0.0005;

if ((shigh>fhigh) && (sclose<flow))
   {
      ExtMapBuffer1[i+5]=High[i+5]+0.0005;
   }

if ((slow<flow) && (sclose>fhigh))
   {
      ExtMapBuffer2[i+5]=Low[i+5]-0.0005;
   }

//     Comment(Close[i+4]+" "+" "+DoubleToStr(i,1)+"  "+TimeToStr(Time[i],TIME_MINUTES)+
//     "\n"+" "+shigh+" "+slow+" "+sclose+
//     "\n"+" "+fhigh+" "+flow+" "+fclose);
    }


//----
   return(0);
  }
//+------------------------------------------------------------------+
Comments