RSX_v2
Download script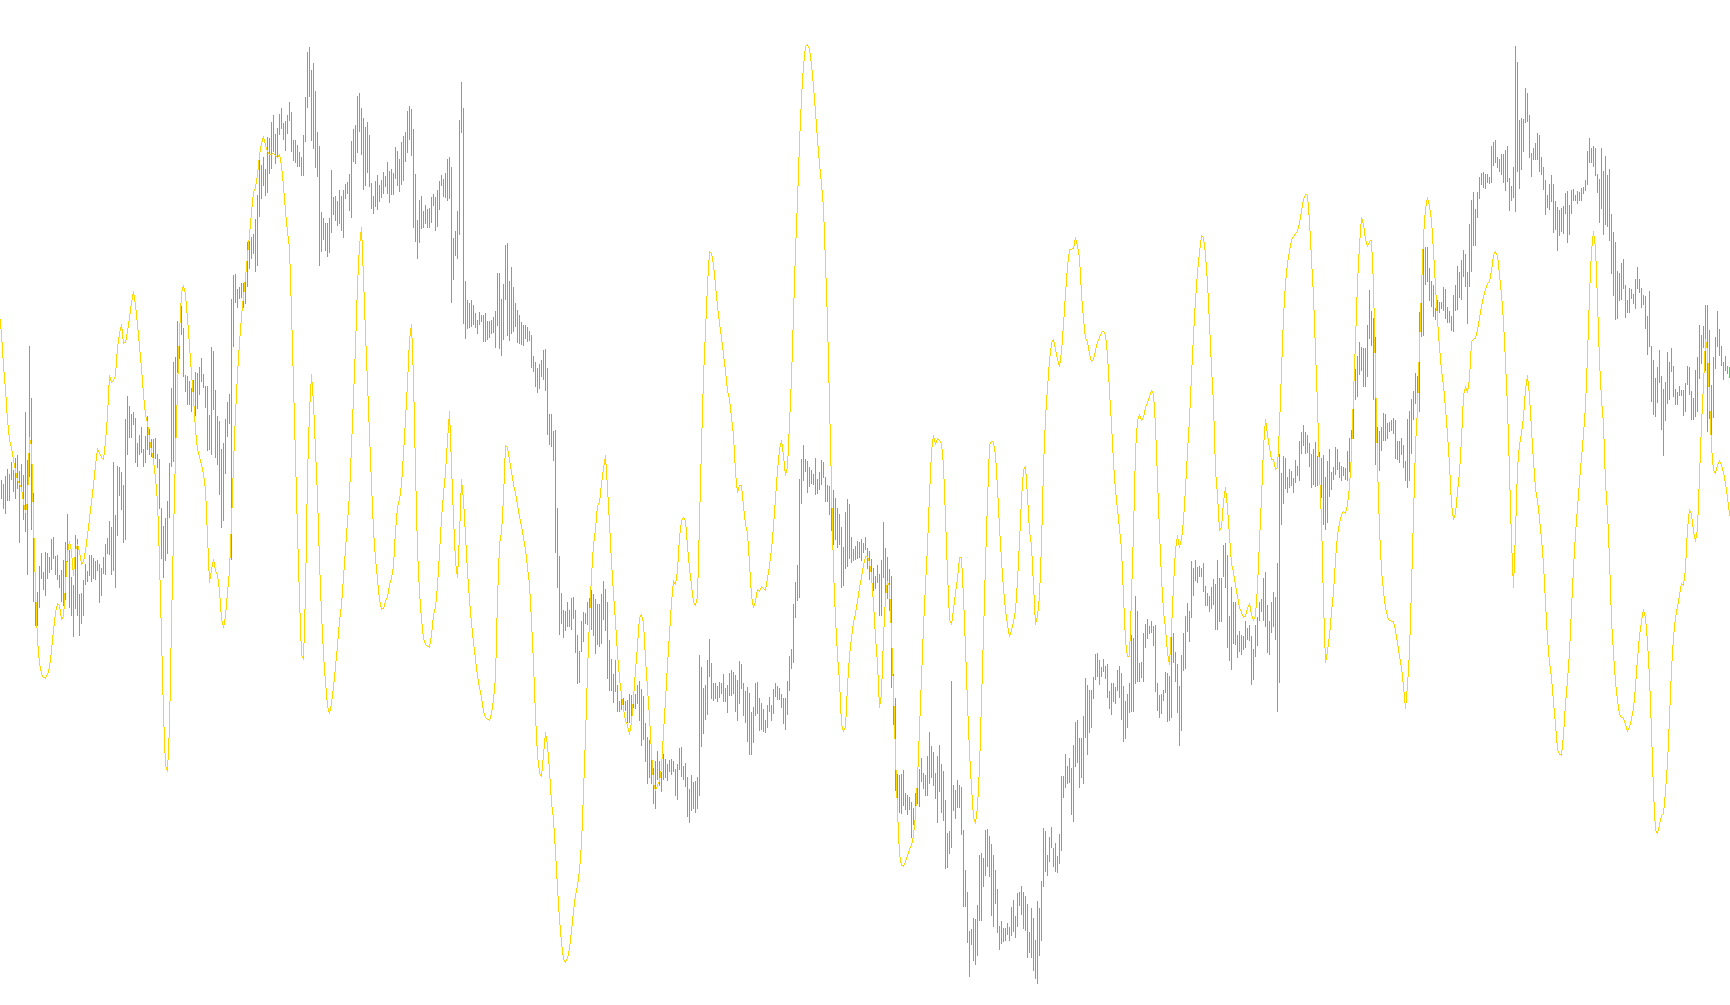
This technical indicator is designed to provide traders with a visual representation of market momentum and price fluctuations, specifically aiming to identify "overbought" or "oversold" conditions. It operates on a scale of 0 to 100, with a central equilibrium line at 50, allowing users to see how aggressively the price is moving in either direction relative to its recent history.
Core Logic and Mechanics
1. Data Smoothing and Weighting The script processes price data using a smoothing technique. Instead of reacting instantly to every single tick of price movement—which can often lead to "noise" or false signals—it calculates a moving average of the price changes. It applies specific mathematical weights to these changes, ensuring that the resulting line flows smoothly across the chart. This helps in identifying the underlying trend rather than temporary spikes.
2. Momentum Tracking The internal logic tracks the difference between the current closing price and previous prices. By calculating these differences repeatedly over a set period (defined by the length parameter), the script builds a multi-layered momentum profile. It doesn't just look at where the price is; it looks at how fast and in what direction it is moving.
3. Dynamic Scaling (The 0-100 Range) One of the primary features of this logic is its ability to normalize complex market movements into a readable percentage. It takes the momentum values calculated in the background and maps them onto a fixed scale:
- High Momentum: When the price moves strongly upward, the indicator climbs toward the 100 level.
- Low Momentum: When the price moves strongly downward, the indicator drops toward the 0 level.
- Neutrality: If there is little to no significant movement, the indicator remains anchored near the 50 midpoint.
4. Visual Interpretation for Traders For a user viewing this on a trading platform, the logic serves as a "speedometer" for price action:
- Overbought Signals: When the line pushes toward the top of the window (near 100), it suggests that the upward momentum may be reaching an exhausted state.
- Oversold Signals: When the line drops toward the bottom (near 0), it suggests that the downward pressure may be significant enough to warrant looking for a potential reversal.
- Trend Identification: By watching the slope of the magenta line, traders can gauge whether a trend is accelerating, slowing down, or losing steam.
/*-----------------------------+
|			       |
| Shared by www.Aptrafx.com    |
|			       |
+------------------------------*/

#property copyright "strategybuilderfx.com"
#property link "finger"
#property indicator_separate_window
#property indicator_buffers 1
#property indicator_color1 Magenta
#property indicator_level1 70
#property indicator_level2 30
#property indicator_level3 50
#property indicator_maximum 100
#property indicator_minimum 0

//---- input parameters
extern int Len=14; //---- buffers
double rsx[];


int init() {
   SetIndexStyle(0,DRAW_LINE);
   SetIndexBuffer(0,rsx);
   IndicatorShortName("RSX");
   return(0);
}

int deinit()
{
   return(0);
}

int start()
{

   double f88, f90;
   double f0, v4, v8, vC, v10, v14, v18, v20;
   double f8, f10, f18, f20, f28, f30, f38, f48, v1C;
   double f50, f58, f60, f68, f70, f78, f80, f40;

   //int counted_bars = IndicatorCounted(),limit,shift;

   //if (counted_bars<0) return(-1);
   //if (counted_bars>0) counted_bars--;
   double limit=Bars-(Len)-1;

   //if(counted_bars>Len) limit=Bars-counted_bars-1;

   for (int shift=limit;shift>=0;shift--) {
      if (f90 == 0.0) {

         f90 = 1.0;
         f0 = 0.0;
         if (Len-1 >= 5) f88 = Len-1.0; else f88 = 5.0;
         f8 = 100.0*(Close[shift]);
         f18 = 3.0 / (Len + 2.0);
         f20 = 1.0 - f18;

      } else{
         if (f88 <= f90) f90 = f88 + 1; else f90 = f90 + 1;
         f10 = f8;
         f8 = 100*Close[shift];
         v8 = f8 - f10;
         f28 = f20 * f28 + f18 * v8;
         f30 = f18 * f28 + f20 * f30;
         vC = f28 * 1.5 - f30 * 0.5;
         f38 = f20 * f38 + f18 * vC;
         f40 = f18 * f38 + f20 * f40;
         v10 = f38 * 1.5 - f40 * 0.5;
         f48 = f20 * f48 + f18 * v10;
         f50 = f18 * f48 + f20 * f50;
         v14 = f48 * 1.5 - f50 * 0.5;
         f58 = f20 * f58 + f18 * MathAbs(v8);
         f60 = f18 * f58 + f20 * f60;
         v18 = f58 * 1.5 - f60 * 0.5;
         f68 = f20 * f68 + f18 * v18;

         f70 = f18 * f68 + f20 * f70;
         v1C = f68 * 1.5 - f70 * 0.5;
         f78 = f20 * f78 + f18 * v1C;
         f80 = f18 * f78 + f20 * f80;
         v20 = f78 * 1.5 - f80 * 0.5;

         if ((f88 >= f90) && (f8 != f10)) f0 = 1.0;
         if ((f88 == f90) && (f0 == 0.0)) f90 = 0.0;
      }

      if ((f88 < f90) && (v20 > 0.0000000001)) {

         v4 = (v14 / v20 + 1.0) * 50.0;
         if (v4 > 100.0) v4 = 100.0;
         if (v4 < 0.0) v4 = 0.0;

      } else {
         v4 = 50.0;
      }

      rsx[shift]=v4;
   }

   return(0);

}
Comments