RVI indicator
Download script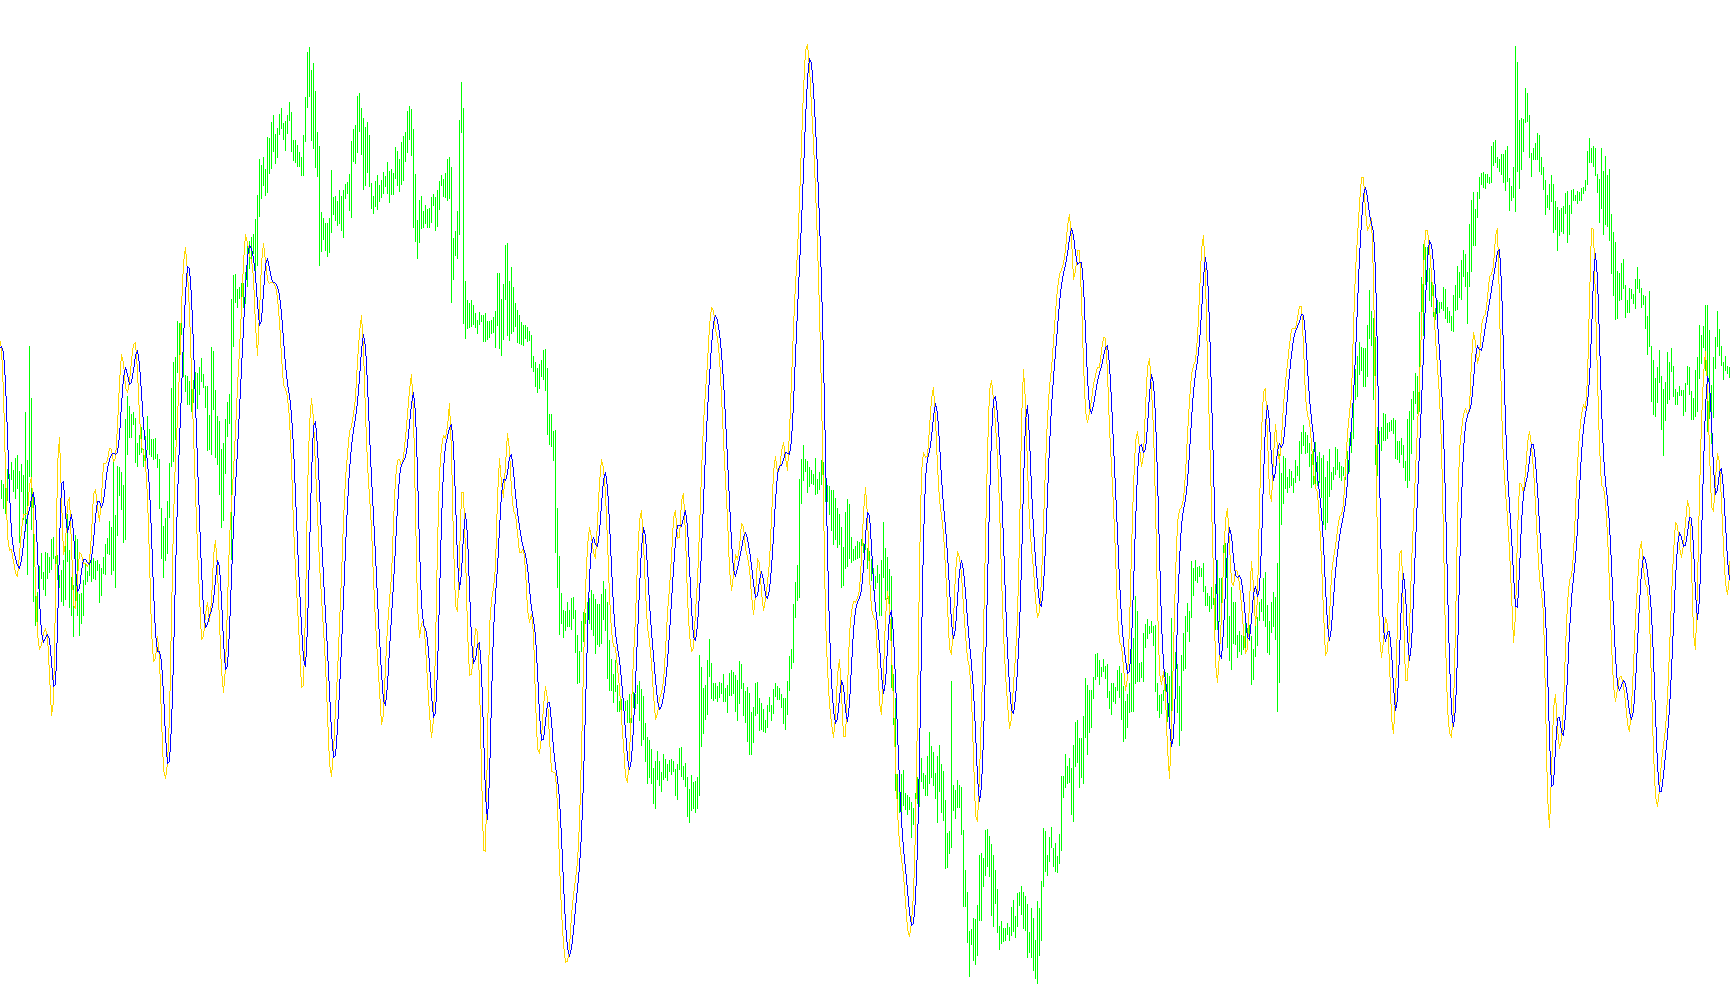
This script functions as a custom technical analysis tool designed to measure the strength and momentum of price movements in the financial markets. It operates by calculating the relationship between upward price movement (buying pressure) and downward price movement (selling pressure) over a specific period of time.
Core Logic and Methodology
1. Movement Calculation Instead of looking at simple price changes, the script analyzes the "vigor" of the market by evaluating the difference between opening and closing prices, as well as the highs and lows. It specifically focuses on:
- Upward Momentum: The difference between a candle's open and close.
- Downward Momentum: The range between a candle's high and low.
To ensure the data is smooth and not skewed by single erratic price spikes, the script applies a weighted calculation. It combines the current bar's data with the data from the three preceding bars, giving more significance to the most recent price action.
2. The Relative Vigor Index (RVI) The primary output of this logic is a ratio. For every period defined in the settings, the script sums up the weighted upward movements and divides them by the sum of the weighted downward movements.
- If the result is positive, it indicates that upward pressure is dominating.
- If the result is negative, it suggests that downward pressure is taking the lead.
3. The Signal Line To make the data easier for a human to interpret, the script produces a secondary "Signal Line." This is essentially a moving average of the RVI itself. By smoothing out the primary RVI line, this signal helps traders identify trends more clearly—when the main RVI line crosses above or below this signal line, it often suggests a shift in market momentum.
Summary of Visual Output
The script displays two distinct lines in a separate window below the main price chart:
- Primary Line (RVI): Represents the immediate strength of the current trend.
- Signal Line: Acts as a secondary reference point to confirm whether the trend is accelerating, slowing down, or reversing.
By using these two lines together, the logic allows users to visualize whether the market is gaining "vigor" in one direction or if the current momentum is beginning to exhaust.
//+------------------------------------------------------------------+
//|                                          Relativ Vigor Index.mq4 |
//|                      Copyright © 2005, MetaQuotes Software Corp. |
//|                                       http://www.metaquotes.net/ |
//+------------------------------------------------------------------+
#property  copyright "Copyright © 2005, MetaQuotes Software Corp."
#property  link      "http://www.metaquotes.net/"
//---- indicator settings
#property  indicator_separate_window
#property  indicator_buffers 2
#property  indicator_color1  Green
#property  indicator_color2  Red
//---- indicator parameters
extern int ExtRVIPeriod=10;
//---- indicator buffers
double     ExtRVIBuffer[];
double     ExtRVISignalBuffer[];

//+------------------------------------------------------------------+
//| Custom indicator initialization function                         |
//+------------------------------------------------------------------+
int init()
  {
//---- indicator buffers mapping
   SetIndexBuffer(0,ExtRVIBuffer);
   SetIndexBuffer(1,ExtRVISignalBuffer);
//---- indicator line
   SetIndexStyle(0,DRAW_LINE);
   SetIndexStyle(1,DRAW_LINE);
//---- drawing settings
   SetIndexDrawBegin(0,ExtRVIPeriod+3);
   SetIndexDrawBegin(1,ExtRVIPeriod+7);
//---- name for DataWindow and indicator subwindow label
   IndicatorShortName("RVI("+ExtRVIPeriod+")");
   SetIndexLabel(0,"RVI");
   SetIndexLabel(1,"RVIS");
//---- initialization done
   return(0);
  }
//+------------------------------------------------------------------+
//| Relativ Vigor Index                                              |
//+------------------------------------------------------------------+
int start()
  {
   int i,j,nLimit,nCountedBars;
   double dValueUp,dValueDown,dNum,dDeNum;
//----
   if(Bars<=ExtRVIPeriod+8) return(0);
//----
   nCountedBars=IndicatorCounted();
//---- check for possible errors
   if(nCountedBars<0) return(-1);
//---- last counted bar will be recounted
   nLimit=Bars-ExtRVIPeriod-4;
   if(nCountedBars>ExtRVIPeriod+4)
      nLimit=Bars-nCountedBars;
//---- RVI counted in the 1-st buffer
   for(i=0; i<=nLimit; i++)
     {
      dNum=0.0;
      dDeNum=0.0;
      for(j=i; j<i+ExtRVIPeriod; j++)
        {
         dValueUp=((Close[j]-Open[j])+2*(Close[j+1]-Open[j+1])+2*(Close[j+2]-Open[j+2])+(Close[j+3]-Open[j+3]))/6;
         dValueDown=((High[j]-Low[j])+2*(High[j+1]-Low[j+1])+2*(High[j+2]-Low[j+2])+(High[j+3]-Low[j+3]))/6;
         dNum+=dValueUp;
         dDeNum+=dValueDown;
        }
      if(dDeNum!=0.0)
         ExtRVIBuffer[i]=dNum/dDeNum;
      else
         ExtRVIBuffer[i]=dNum;
     }
//---- signal line counted in the 2-nd buffer
   nLimit=Bars-ExtRVIPeriod-7;
   if(nCountedBars>ExtRVIPeriod+8)
      nLimit=Bars-nCountedBars+1;
   for(i=0; i<=nLimit; i++)
      ExtRVISignalBuffer[i]=(ExtRVIBuffer[i]+2*ExtRVIBuffer[i+1]+2*ExtRVIBuffer[i+2]+ExtRVIBuffer[i+3])/6;
//----
   return(0);
  }
//+------------------------------------------------------------------+
Comments