RSX_in_Color
Download script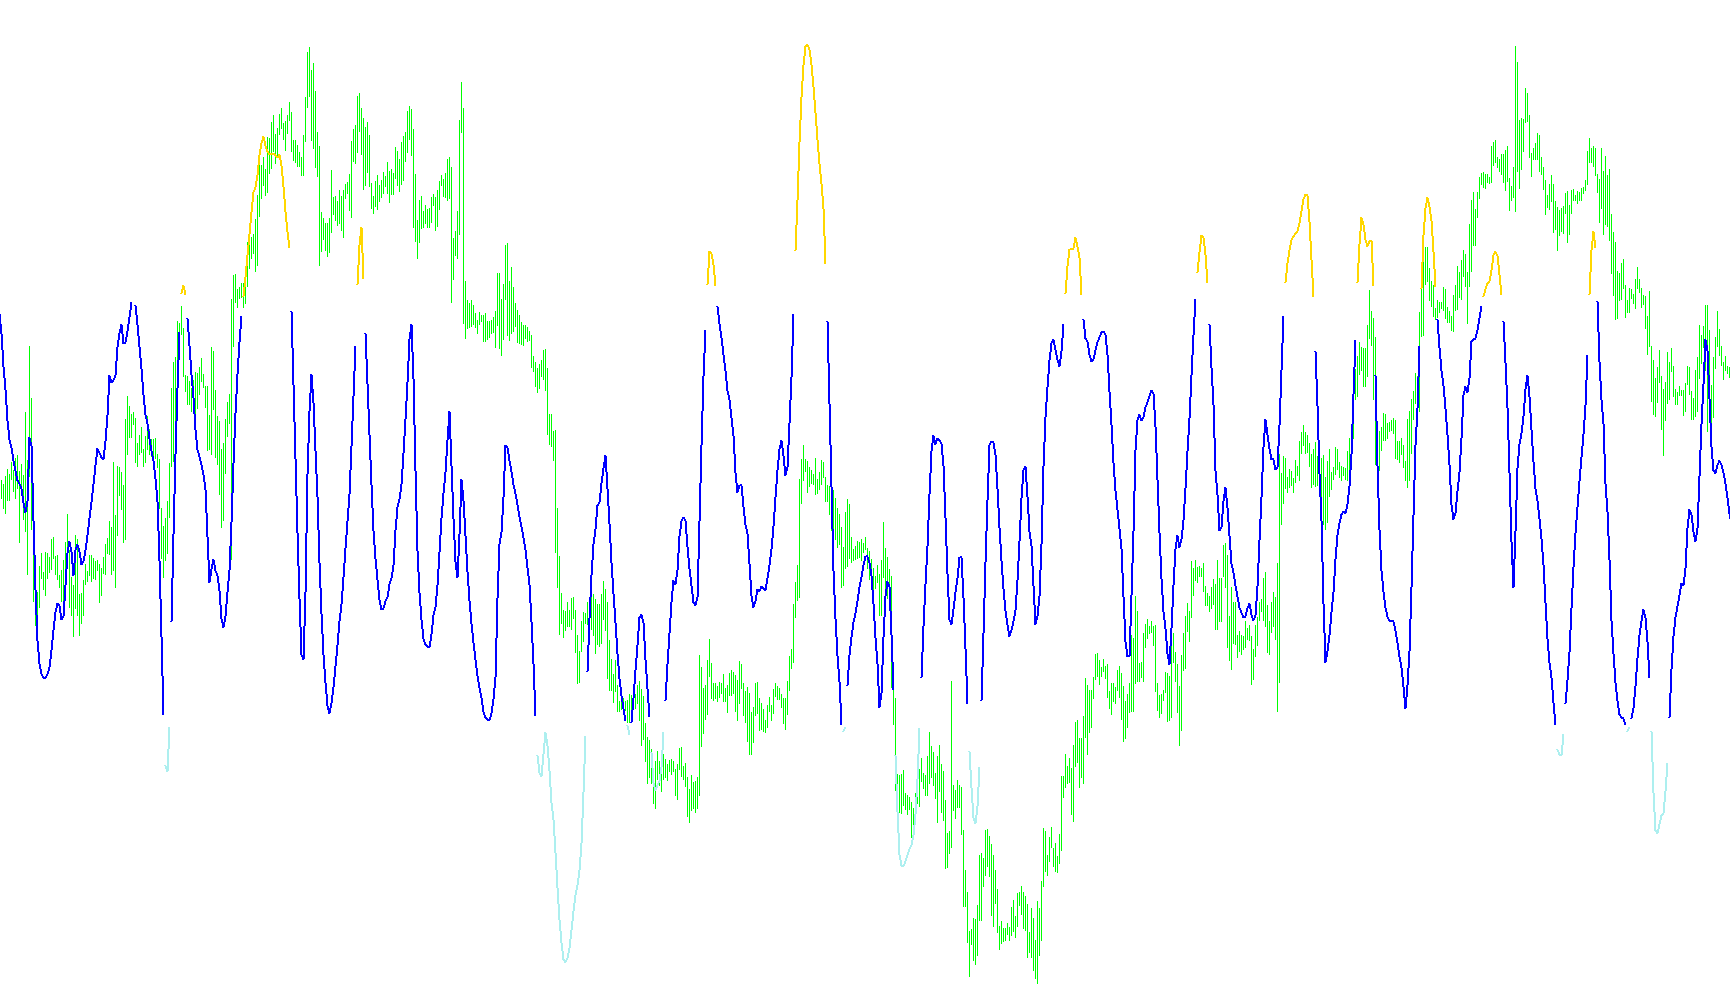
This script functions as a specialized visual indicator designed to help traders identify specific momentum trends and price extremes within the market. Instead of plotting standard price data, it creates a separate dashboard-style window that interprets complex price movements into a simplified, color-coded signal system.
Core Analytical Logic
The logic operates by analyzing the "momentum" of price changes over a defined period (set by the user as the length). It doesn't just look at whether the price is going up or down; it calculates the velocity and smoothing of those movements to determine the strength of the current trend.
Here is how the internal processing works in plain terms:
1. Data Smoothing and Momentum Calculation The script takes the raw closing prices and puts them through a series of mathematical filters. It calculates the difference between current prices and previous prices, then applies several layers of smoothing. This ensures that minor "noise" or tiny fluctuations in the market don't trigger false signals, focusing instead on the broader direction of the move.
2. Trend Intensity Scoring Once the momentum is smoothed, the script evaluates the intensity of the trend. It converts these complex movements into a numerical value scaled between 0 and 100. This allows the tool to quantify how "strong" a move is at any given moment.
3. Dynamic Signal Filtering The indicator uses specific thresholds (Upper and Lower levels) to decide which information to display on your screen:
- Overbought/Strong Momentum: When the trend strength exceeds the upper threshold, the script highlights the data to alert you of high-intensity activity.
- Oversold/Weak Momentum: When the trend falls below the lower threshold, it filters the data differently to highlight potential exhaustion or extreme lows.
- Neutral Zone: In between these levels, the script maintains a baseline status, identifying areas where the market may be consolidating or lacking clear direction.
Visual Representation
The final output is presented as a clean, three-color visual system:
- Green: Represents one side of the momentum trend (typically upward strength).
- Yellow: Serves as a middle-ground indicator for the current status.
- Red: Represents the opposite side of the momentum trend (typically downward strength).
By translating raw price data into these specific colors and levels, the script helps traders quickly identify whether the market is currently experiencing strong momentum, reaching an extreme point, or resting in a neutral state, allowing for faster visual recognition of trading opportunities.
/*-----------------------------+
|			       |
| Shared by www.Aptrafx.com    |
|			       |
+------------------------------*/

#property copyright "strategybuilderfx.com"
#property link "finger"
#property indicator_separate_window
#property indicator_buffers 3
#property indicator_color1 Green
#property indicator_color2 Yellow
#property indicator_color3 Red
//#property indicator_level1 70
//#property indicator_level2 30
//#property indicator_level3 46
//#property indicator_level4 54
//#property indicator_maximum 100
//#property indicator_minimum 0

//---- input parameters
extern int Len=14; //---- buffers
extern double UpperLevel = 70;
extern double LowerLevel = 30;
double rsxHigh[];
double rsxMid[];
double rsxLow[];

int init() {
//---- 1 additional buffer is used for counting.
   SetIndexBuffer(0,rsxHigh);
   SetIndexBuffer(1,rsxMid);
   SetIndexBuffer(2,rsxLow);
   SetIndexStyle(2,DRAW_LINE,STYLE_SOLID,2);
   SetIndexStyle(1,DRAW_LINE,STYLE_SOLID,2);
   SetIndexStyle(0,DRAW_LINE,STYLE_SOLID,2);
   IndicatorShortName("RSXinColor(" +Len+")");
   return(0);
}

int deinit()
{
   return(0);
}

int start()
{

   double f88, f90;
   double f0, v4, v8, vC, v10, v14, v18, v20;
   double f8, f10, f18, f20, f28, f30, f38, f48, v1C;
   double f50, f58, f60, f68, f70, f78, f80, f40;

   //int counted_bars = IndicatorCounted(),limit,shift;

   //if (counted_bars<0) return(-1);
   //if (counted_bars>0) counted_bars--;
   double limit=Bars-(Len)-1;

   //if(counted_bars>Len) limit=Bars-counted_bars-1;

   for (int shift=limit;shift>=0;shift--) {
      if (f90 == 0.0) {

         f90 = 1.0;
         f0 = 0.0;
         if (Len-1 >= 5) f88 = Len-1.0; else f88 = 5.0;
         f8 = 100.0*(Close[shift]);
         f18 = 3.0 / (Len + 2.0);
         f20 = 1.0 - f18;

      } else{
         if (f88 <= f90) f90 = f88 + 1; else f90 = f90 + 1;
         f10 = f8;
         f8 = 100*Close[shift];
         v8 = f8 - f10;
         f28 = f20 * f28 + f18 * v8;
         f30 = f18 * f28 + f20 * f30;
         vC = f28 * 1.5 - f30 * 0.5;
         f38 = f20 * f38 + f18 * vC;
         f40 = f18 * f38 + f20 * f40;
         v10 = f38 * 1.5 - f40 * 0.5;
         f48 = f20 * f48 + f18 * v10;
         f50 = f18 * f48 + f20 * f50;
         v14 = f48 * 1.5 - f50 * 0.5;
         f58 = f20 * f58 + f18 * MathAbs(v8);
         f60 = f18 * f58 + f20 * f60;
         v18 = f58 * 1.5 - f60 * 0.5;
         f68 = f20 * f68 + f18 * v18;

         f70 = f18 * f68 + f20 * f70;
         v1C = f68 * 1.5 - f70 * 0.5;
         f78 = f20 * f78 + f18 * v1C;
         f80 = f18 * f78 + f20 * f80;
         v20 = f78 * 1.5 - f80 * 0.5;

         if ((f88 >= f90) && (f8 != f10)) f0 = 1.0;
         if ((f88 == f90) && (f0 == 0.0)) f90 = 0.0;
      }

      if ((f88 < f90) && (v20 > 0.0000000001)) {

         v4 = (v14 / v20 + 1.0) * 50.0;
         if (v4 > 100.0) v4 = 100.0;
         if (v4 < 0.0) v4 = 0.0;

      } else {
         v4 = 50.0;
      }

      rsxHigh[shift]=v4;
      rsxMid[shift]=v4;
      rsxLow[shift]=v4;

      if (v4 >= UpperLevel)
      {
          rsxMid[shift] = EMPTY_VALUE;
          rsxLow[shift] = EMPTY_VALUE;
      }
      else if (v4 <= LowerLevel)
      {
          rsxHigh[shift] = EMPTY_VALUE;
          rsxMid[shift] = EMPTY_VALUE;
      }
      else
      {

         rsxHigh[shift]=EMPTY_VALUE;//EMPTY_VALUE;
         rsxLow[shift]=EMPTY_VALUE;//EMPTY_VALUE;
      }

   }

   return(0);

}
Comments