RSI_v1
Download script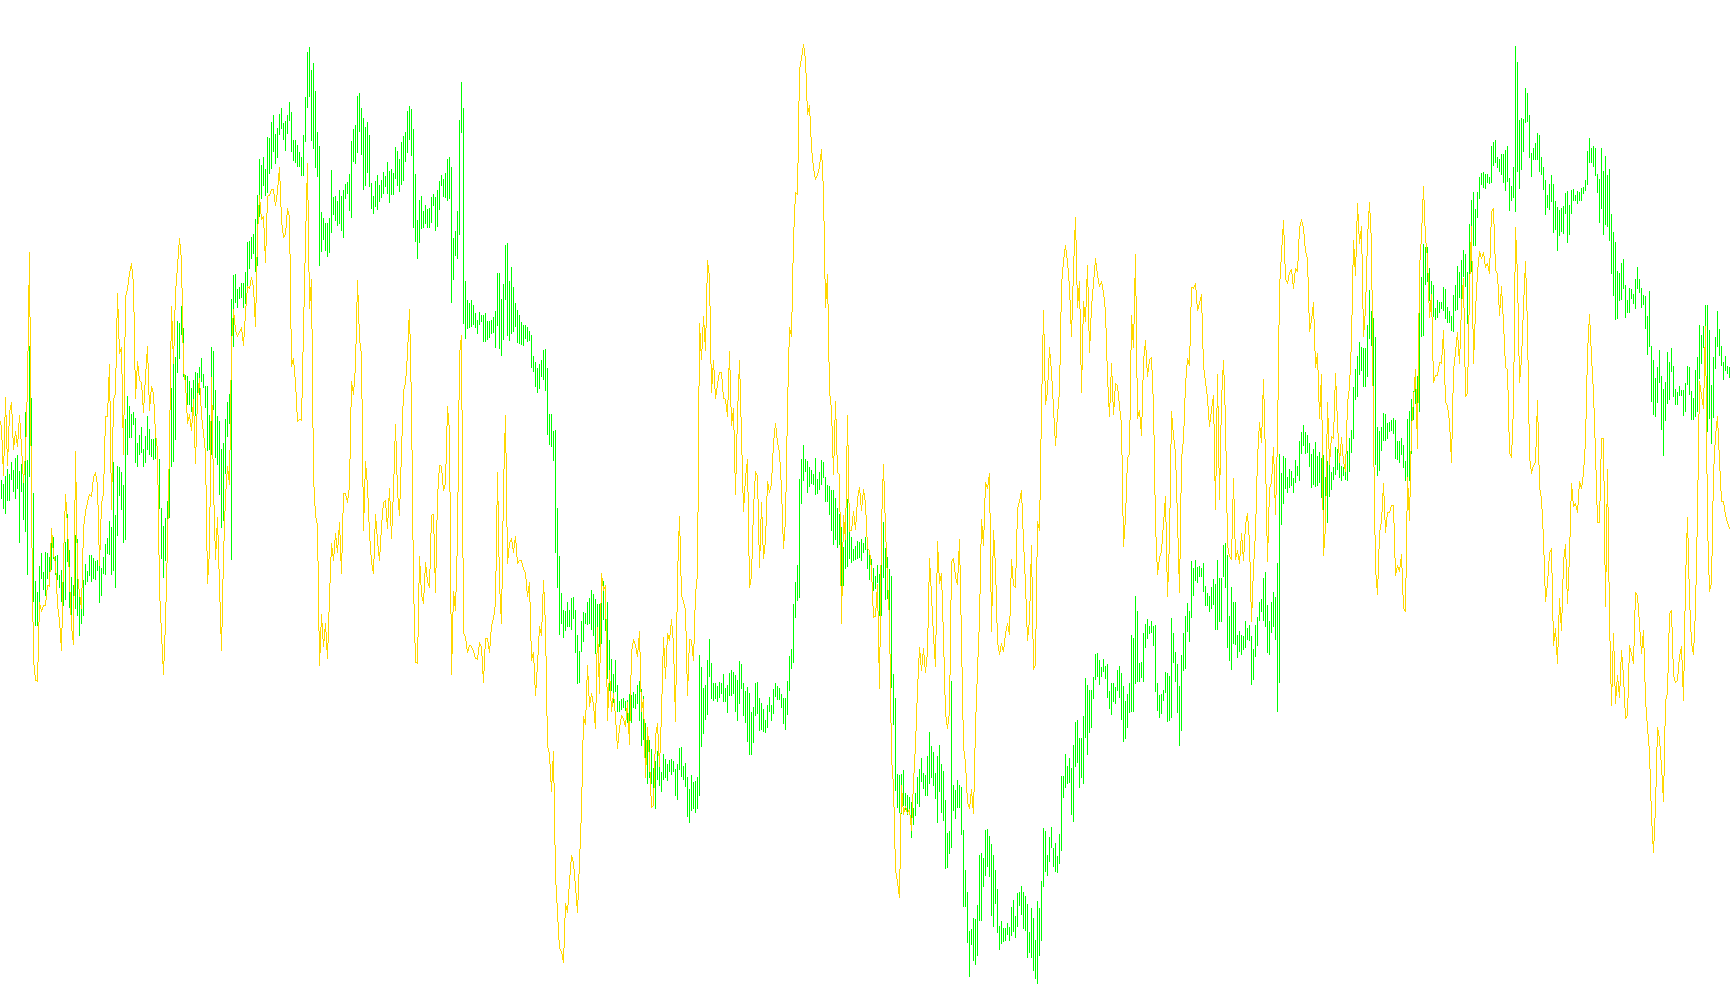
This tool is a technical analysis indicator designed to help traders gauge the momentum and strength of a financial asset's price movements. By analyzing historical price data, it provides a visual representation of whether an asset is being bought or sold with significant force, helping users identify potentially overextended market conditions.
Core Logic and Methodology
The script operates by calculating a "Relative Strength Index" (RSI) based on a user-defined period (defaulting to 14 bars). Rather than looking at raw price changes in isolation, the logic breaks down the movement into two distinct components: Positive Momentum and Negative Momentum.
1. Data Collection and Accumulation The indicator looks back at the closing prices of the last few candles. It calculates the difference between each consecutive price to determine the "relative" change.
- If the price moved up, that value is added to the positive momentum category.
- If the price moved down, that value is added to the negative momentum category.
2. Smoothing the Data To prevent the indicator from reacting too wildly to tiny, insignificant price flickers, the script uses a smoothing technique. While the very first calculation in a series is a simple average of all movements over the period, subsequent calculations use a moving average approach. This ensures that the current momentum value is balanced against the previous values, creating a fluid and readable line on your chart rather than erratic jumps.
3. The Final Calculation The final result is expressed as a percentage scale from 0 to 100. This is achieved by comparing the ratio of positive momentum against negative momentum.
- When positive momentum significantly outweighs negative momentum, the indicator moves toward the 100 level, suggesting bullish strength.
- When negative momentum dominates, the indicator moves toward the 0 level, suggesting bearish strength.
How to Interpret the Results
By visualizing this logic as a line in a separate window, traders can see the "velocity" of the market. Because the result is normalized between 0 and 100, it allows for easy identification of extremes. When the line reaches the upper or lower boundaries, it often signals that the current trend may be exhausted and a price correction or reversal could be approaching.
/*-----------------------------+
|			       |
| Shared by www.Aptrafx.com    |
|			       |
+------------------------------*/

//+------------------------------------------------------------------+
//|                                                          RSI.mq4 |
//|                      Copyright © 2004, MetaQuotes Software Corp. |
//|                                       http://www.metaquotes.net/ |
//+------------------------------------------------------------------+
#property copyright "Copyright © 2004, MetaQuotes Software Corp."
#property link      "http://www.metaquotes.net/"

#property indicator_separate_window
#property indicator_minimum 0
#property indicator_maximum 100
#property indicator_buffers 1
#property indicator_color1 DodgerBlue
//---- input parameters
extern int RSIPeriod=14;
//---- buffers
double RSIBuffer[];
double PosBuffer[];
double NegBuffer[];
//+------------------------------------------------------------------+
//| Custom indicator initialization function                         |
//+------------------------------------------------------------------+
int init()
  {
   string short_name;
//---- 2 additional buffers are used for counting.
   IndicatorBuffers(3);
   SetIndexBuffer(1,PosBuffer);
   SetIndexBuffer(2,NegBuffer);
//---- indicator line
   SetIndexStyle(0,DRAW_LINE);
   SetIndexBuffer(0,RSIBuffer);
//---- name for DataWindow and indicator subwindow label
   short_name="RSI("+RSIPeriod+")";
   IndicatorShortName(short_name);
   SetIndexLabel(0,short_name);
//----
   SetIndexDrawBegin(0,RSIPeriod);
//----
   return(0);
  }
//+------------------------------------------------------------------+
//| Relative Strength Index                                          |
//+------------------------------------------------------------------+
int start()
  {
   int    i,counted_bars=IndicatorCounted();
   double rel,negative,positive;
//----
   if(Bars<=RSIPeriod) return(0);
//---- initial zero
   if(counted_bars<1)
      for(i=1;i<=RSIPeriod;i++) RSIBuffer[Bars-i]=0.0;
//----
   i=Bars-RSIPeriod-1;
   if(counted_bars>=RSIPeriod) i=Bars-counted_bars-1;
   while(i>=0)
     {
      double sumn=0.0,sump=0.0;
      if(i==Bars-RSIPeriod-1)
        {
         int k=Bars-2;
         //---- initial accumulation
         while(k>=i)
           {
            rel=Close[k]-Close[k+1];
            if(rel>0) sump+=rel;
            else      sumn-=rel;
            k--;
           }
         positive=sump/RSIPeriod;
         negative=sumn/RSIPeriod;
        }
      else
        {
         //---- smoothed moving average
         rel=Close[i]-Close[i+1];
         if(rel>0) sump=rel;
         else      sumn=-rel;
         positive=(PosBuffer[i+1]*(RSIPeriod-1)+sump)/RSIPeriod;
         negative=(NegBuffer[i+1]*(RSIPeriod-1)+sumn)/RSIPeriod;
        }
      PosBuffer[i]=positive;
      NegBuffer[i]=negative;
      if(negative==0.0) RSIBuffer[i]=0.0;
      else RSIBuffer[i]=100.0-100.0/(1+positive/negative);
      i--;
     }
//----
   return(0);
  }
//+------------------------------------------------------------------+
Comments