RSI_WithAlert
Download script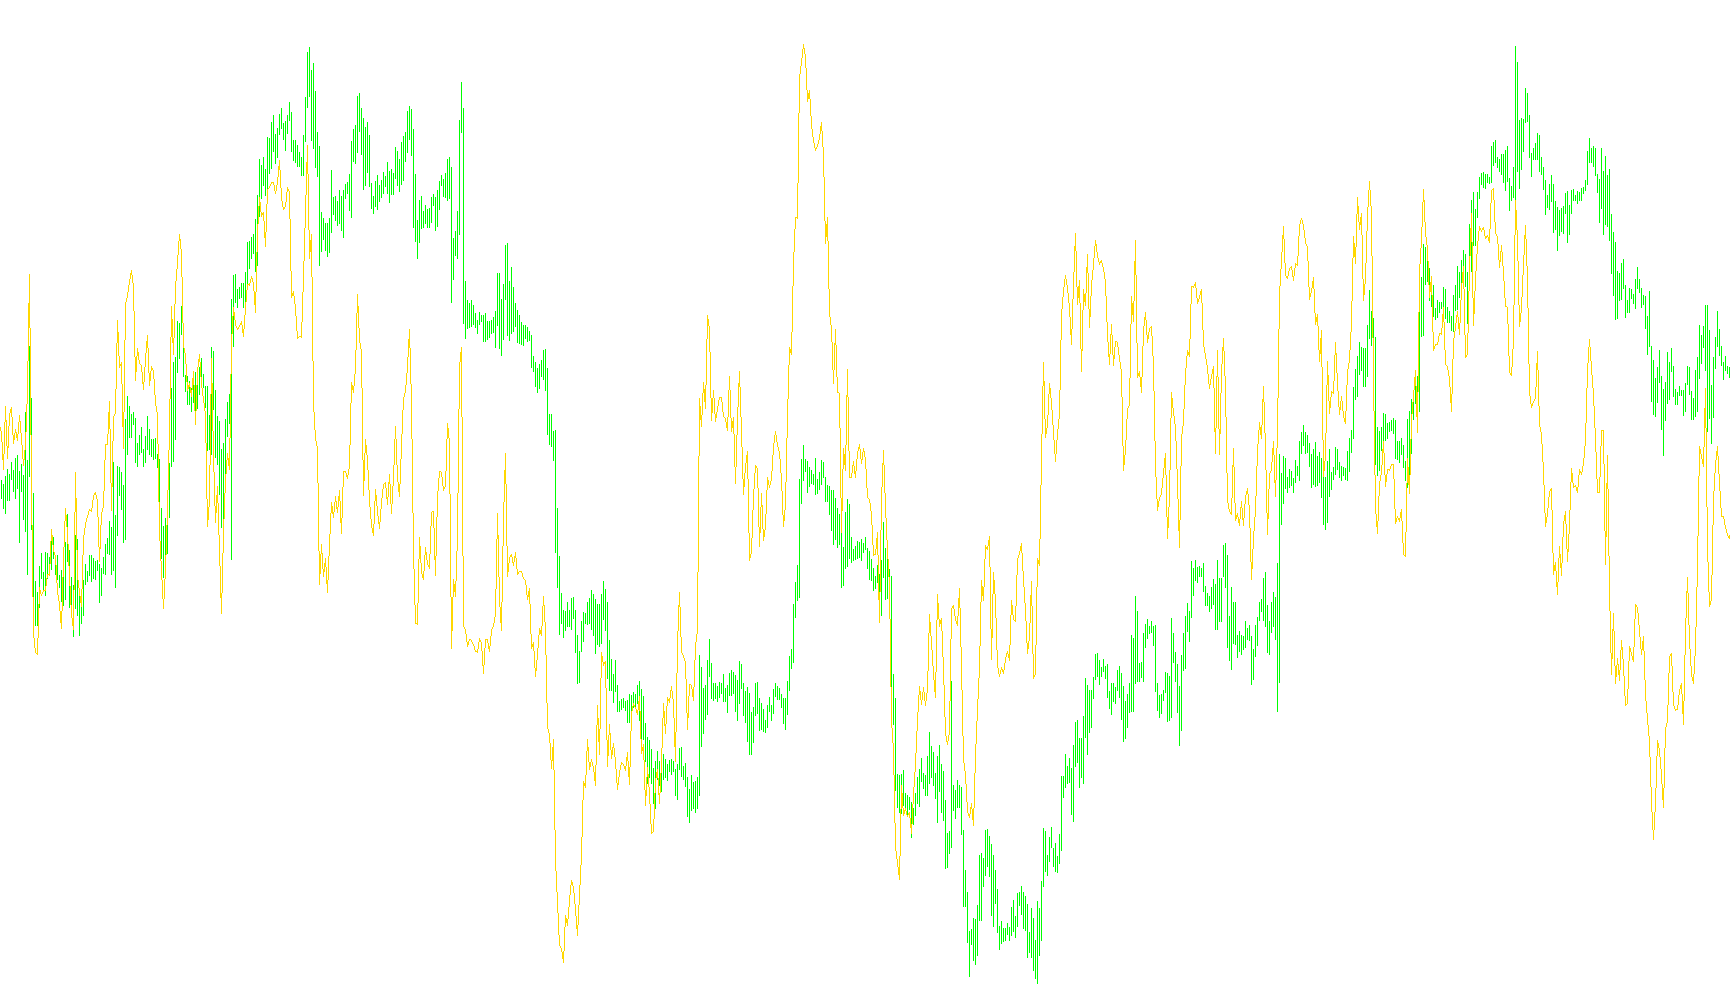
This tool is designed for traders using the MetaTrader platform to monitor market momentum through a specialized technical indicator. It visualizes price strength and provides automated notifications when specific price movements occur.
Core Functionality
The script focuses on the Relative Strength Index (RSI), a standard technical analysis tool used to determine whether an asset is overbought or oversold. This specific version calculates the momentum by looking at the average gains versus the average losses over a set period of time (defaulting to 21 bars).
How the Logic Works
The script processes market data in three distinct stages:
1. Data Calculation & Smoothing Instead of just looking at raw price changes, the logic calculates two separate values: "Positive Strength" and "Negative Strength." It uses a smoothing technique where the current price movement is blended with previous data points. This ensures that the resulting line on your chart is fluid rather than jagged, making it easier to identify long-term trends versus temporary market "noise."
2. Momentum Visualization The script then converts these strengths into a single numerical value between 0 and 100. This is plotted in a separate window below your main price chart.
- Higher values indicate that upward momentum is dominating.
- Lower values indicate that downward momentum is taking over.
3. Automated Alert System The most practical feature for the user is the automated monitoring system. The script constantly watches the "current" and "previous" data points to detect specific crossovers:
- Buy Alerts: If the indicator value rises from below a specific threshold (e.g., 50) to above it, the script triggers a notification.
- Sell Alerts: If the indicator value drops from above a specific threshold to below it, the script triggers a notification.
The logic is designed to ensure you are notified only at the moment the "breakout" occurs, preventing redundant alerts during a single candle's movement. This allows traders to react quickly to momentum shifts without needing to stare at the screen constantly.
//+------------------------------------------------------------------+
//|                                                RSI_WithAlert.mq4 |
//|                        Copyright © 2007,MetaQuotes Software Corp |
//|                                           http://www.sarmaye.com |
//+------------------------------------------------------------------+
#property copyright "Copyright © 2007, MetaQuotes Software Corp."
#property link      "http://www.sarmaye.com/"

#property indicator_separate_window
#property indicator_buffers 1
#property indicator_color1 DodgerBlue

#property indicator_level1 60
#property indicator_level2 50
#property indicator_level3 40

//---- input parameters
extern int RSIPeriod=21;
extern int LevelBuy= 50;
extern int LevelSell= 50;
extern bool AlertOn=true;
//---- buffers
double RSIBuffer[];
double PosBuffer[];
double NegBuffer[];
//+------------------------------------------------------------------+
//| Custom indicator initialization function                         |
//+------------------------------------------------------------------+
int init()
  {
   string short_name;
//---- 2 additional buffers are used for counting.
   IndicatorBuffers(3);
   SetIndexBuffer(1,PosBuffer);
   SetIndexBuffer(2,NegBuffer);
//---- indicator line
   SetIndexStyle(0,DRAW_LINE);
   SetIndexBuffer(0,RSIBuffer);
//---- name for DataWindow and indicator subwindow label
   short_name="RSI("+RSIPeriod+")";
   IndicatorShortName(short_name);
   SetIndexLabel(0,short_name);
//----
   SetIndexDrawBegin(0,RSIPeriod);
//----
   return(0);
  }
//+------------------------------------------------------------------+
//| Relative Strength Index                                          |
//+------------------------------------------------------------------+
int start()
  {
   int    i,counted_bars=IndicatorCounted();
   double rel,negative,positive;
   static datetime prevtime = 0;
//----
   if(Bars<=RSIPeriod) return(0);
//---- initial zero
   if(counted_bars<1)
      for(i=1;i<=RSIPeriod;i++) RSIBuffer[Bars-i]=0.0;
//----
   i=Bars-RSIPeriod-1;
   if(counted_bars>=RSIPeriod) i=Bars-counted_bars-1;
   while(i>=0)
     {
      double sumn=0.0,sump=0.0;
      if(i==Bars-RSIPeriod-1)
        {
         int k=Bars-2;
         //---- initial accumulation
         while(k>=i)
           {
            rel=Close[k]-Close[k+1];
            if(rel>0) sump+=rel;
            else      sumn-=rel;
            k--;
           }
         positive=sump/RSIPeriod;
         negative=sumn/RSIPeriod;
        }
      else
        {
         //---- smoothed moving average
         rel=Close[i]-Close[i+1];
         if(rel>0) sump=rel;
         else      sumn=-rel;
         positive=(PosBuffer[i+1]*(RSIPeriod-1)+sump)/RSIPeriod;
         negative=(NegBuffer[i+1]*(RSIPeriod-1)+sumn)/RSIPeriod;
        }
      PosBuffer[i]=positive;
      NegBuffer[i]=negative;
      if(negative==0.0) RSIBuffer[i]=0.0;
      else RSIBuffer[i]=100.0-100.0/(1+positive/negative);
      i--;
     }
     if(AlertOn)
   {
     if(prevtime == Time[0])
      {
         return(0);
      }
        prevtime = Time[0];
       if (RSIBuffer[1]>LevelBuy && RSIBuffer[2]<=LevelBuy)
       {
         Alert(Symbol(), " M", Period(), " Buy Alert");
       }
       if (RSIBuffer[1]<LevelSell && RSIBuffer[2]>=LevelSell)
       {
         Alert(Symbol(), " M", Period(), " Sell Alert");
       }
    }
       return(0);
       }
//+------------------------------------------------------------------+
Comments