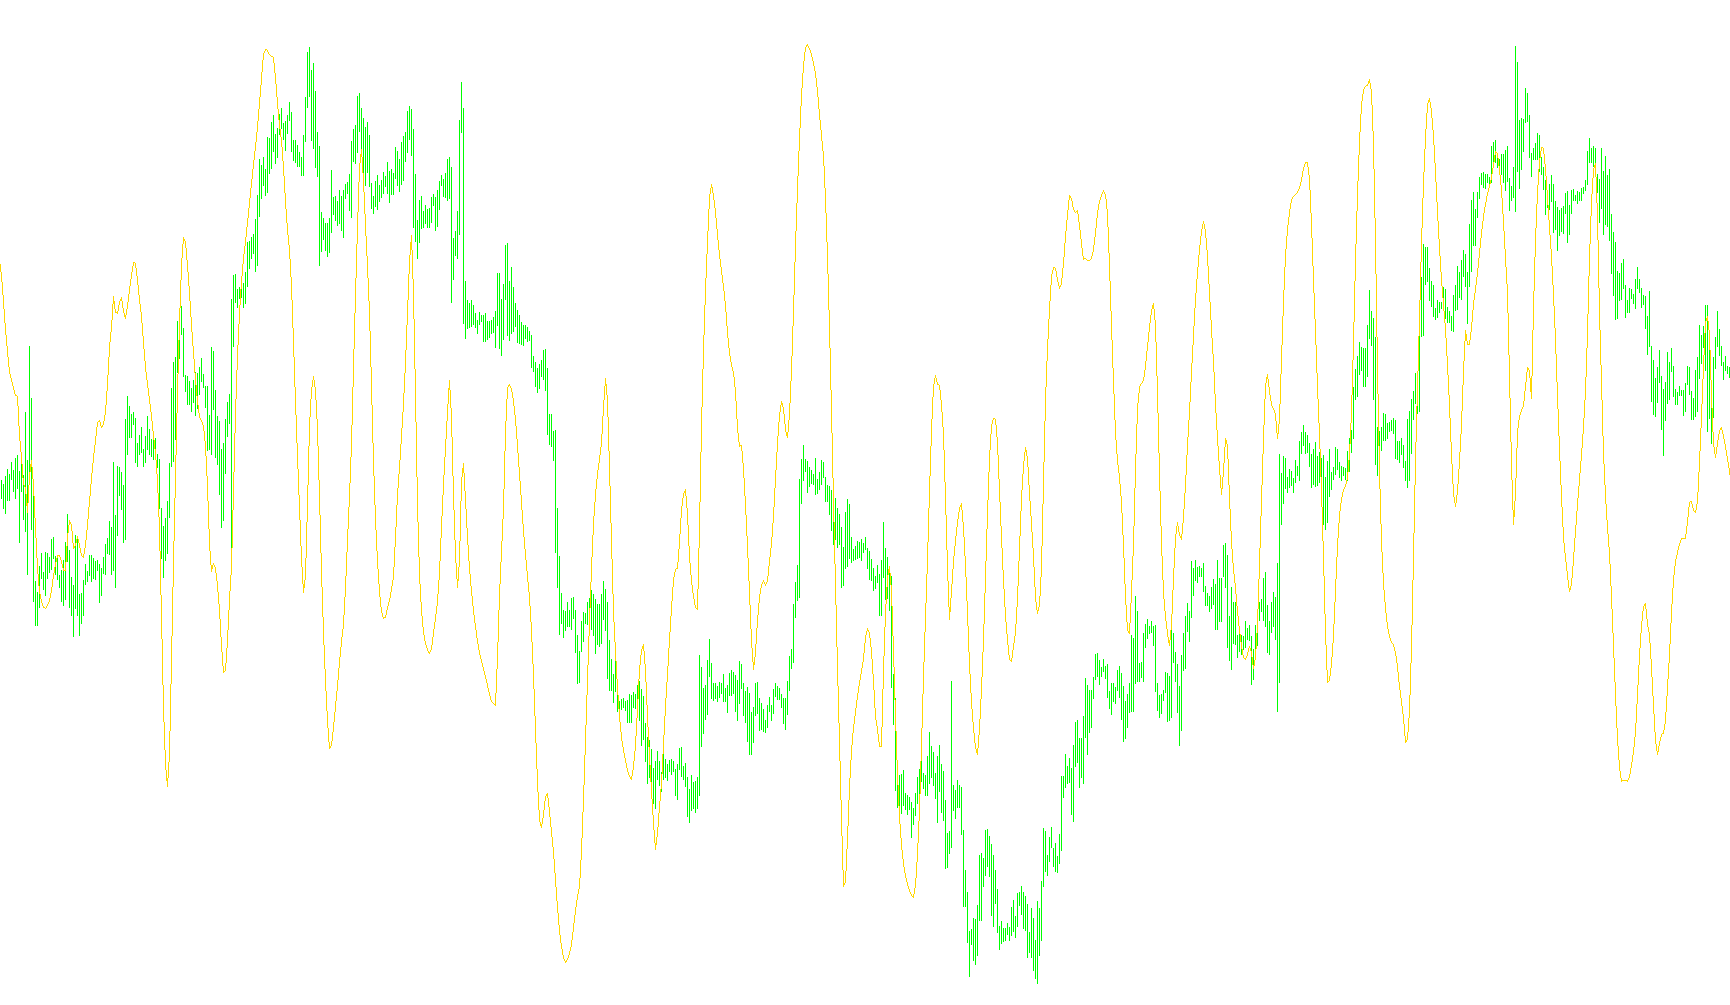
This script functions as a specialized technical analysis tool designed to measure and visualize market momentum. Instead of simply showing the price of an asset, it translates price fluctuations into a standardized oscillation, typically displayed in a separate window below your main trading chart.
Core Logic and Functionality
1. Momentum Smoothing The script analyzes a specific number of recent data points (defined by a user-adjustable "Length" parameter) to calculate the speed at which a market is moving. It looks at the high and low prices of each candle to determine the range of movement, filtering out minor noise to identify more significant trends.
2. Multi-Stage Weighted Calculations The logic employs a sophisticated series of mathematical weights. Rather than reacting instantly to every price tick—which can lead to "false signals"—the script processes the data through multiple layers of accumulation. This ensures that the resulting line is smooth and reflects the underlying strength of the trend rather than erratic volatility.
3. Relative Strength Tracking A key component of this logic is its ability to differentiate between various types of price action. It tracks the relationship between current price movement and previous historical movement. By calculating the ratios of these changes, the script determines whether the current momentum is accelerating, decelerating, or remaining stagnant.
4. The 0–100 Scale Output The final output is normalized onto a fixed scale from 0 to 100. This provides a clear visual representation of market "velocity":
- Upper Thresholds: When the line moves toward the top of the scale (near 100), it indicates strong upward momentum.
- Lower Thresholds: When the line moves toward the bottom (near 0), it indicates strong downward momentum.
- Center Point: The middle of the scale (50) represents a neutral zone where momentum is balanced or transitioning.
Summary for the Trader
In practical terms, this script acts as a "speedometer" for your trades. It helps you identify when a trend is gaining significant power and when it may be losing steam. By observing the magenta line, you can better gauge whether the market is trending strongly in one direction or if the current move is becoming exhausted.
//+------------------------------------------------------------------+
//|                                                          rsx.mq4 |
//|                Copyright © 2005, Nick Bilak, beluck[AT]gmail.com |
//+------------------------------------------------------------------+
#property copyright "Copyright © 2005, Nick Bilak"
#property link      "http://metatrader.50webs.com/"
//----
#property indicator_separate_window
#property indicator_buffers 1
#property indicator_color1 Magenta
#property indicator_level1 70
#property indicator_level2 30
#property indicator_level3 50
#property indicator_maximum 100
#property indicator_minimum 0
//---- input parameters
extern int       Len=14;
//---- buffers
double rsx[];
double f88, f90;
double f0, v4, v8, vC, v10, v14, v18, v20;
double f8, f10, f18, f20, f28, f30, f38, f48, v1C;
double f50, f58, f60, f68, f70, f78, f80, f40;
//+------------------------------------------------------------------+
//| Custom indicator initialization function                         |
//+------------------------------------------------------------------+
int init()
  {
//---- indicators
   SetIndexStyle(0,DRAW_LINE);
   SetIndexBuffer(0,rsx);
   IndicatorShortName("rsx ("+Len+") ");
//----
   return(0);
  }
//+------------------------------------------------------------------+
//| Custor indicator deinitialization function                       |
//+------------------------------------------------------------------+
int deinit()
  {
   return(0);
  }
//+------------------------------------------------------------------+
//| Custom indicator iteration function                              |
//+------------------------------------------------------------------+
int start()
  {
   int counted_bars=IndicatorCounted(),limit,shift;
   if (counted_bars<0) return(-1);
   if (counted_bars>0) counted_bars--;
   limit=Bars-Len-1;
   if(counted_bars>Len) limit=Bars-counted_bars-1;
   if (limit<2) limit=100;
//----
   for(shift=limit;shift>=0;shift--)
     {
      if (f90==0.0)
        {
         f90=1.0;
         f0=0.0;
         if (Len-1>=5) f88=Len-1.0; else f88=5.0;
         f8=100.0*(High[shift]+Low[shift]);
         f18=3.0/(Len + 2.0);
         f20=1.0 - f18;
        }
      else
        {
         if (f88<=f90)
            f90=f88 + 1;
         else
            f90=f90 + 1;
         f10=f8;
         f8 =100*(High[shift]+Low[shift]);
         v8 =f8 - f10;
         f28=f20 * f28 + f18 * v8;
         f30=f18 * f28 + f20 * f30;
         vC =f28 * 1.5 - f30 * 0.5;
         f38=f20 * f38 + f18 * vC;
         f40=f18 * f38 + f20 * f40;
         v10=f38 * 1.5 - f40 * 0.5;
         f48=f20 * f48 + f18 * v10;
         f50=f18 * f48 + f20 * f50;
         v14=f48 * 1.5 - f50 * 0.5;
         f58=f20 * f58 + f18 * MathAbs(v8);
         f60=f18 * f58 + f20 * f60;
         v18=f58 * 1.5 - f60 * 0.5;
         f68=f20 * f68 + f18 * v18;
         f70=f18 * f68 + f20 * f70;
         v1C=f68 * 1.5 - f70 * 0.5;
         f78=f20 * f78 + f18 * v1C;
         f80=f18 * f78 + f20 * f80;
         v20=f78 * 1.5 - f80 * 0.5;
         if ((f88>=f90) && (f8!=f10)) f0=1.0;
         if ((f88==f90) && (f0==0.0)) f90=0.0;
        }
      if ((f88 < f90) && (v20 > 0.0000000001))
        {
         v4=(v14/v20 + 1.0) * 50.0;
         if (v4 > 100.0) v4=100.0;
         if (v4 < 0.0) v4=0.0;
         } else {
         v4=50.0;
        }
      rsx[shift]=v4;
     }
   return(0);
  }
//+------------------------------------------------------------------+
Comments