rsx
Download script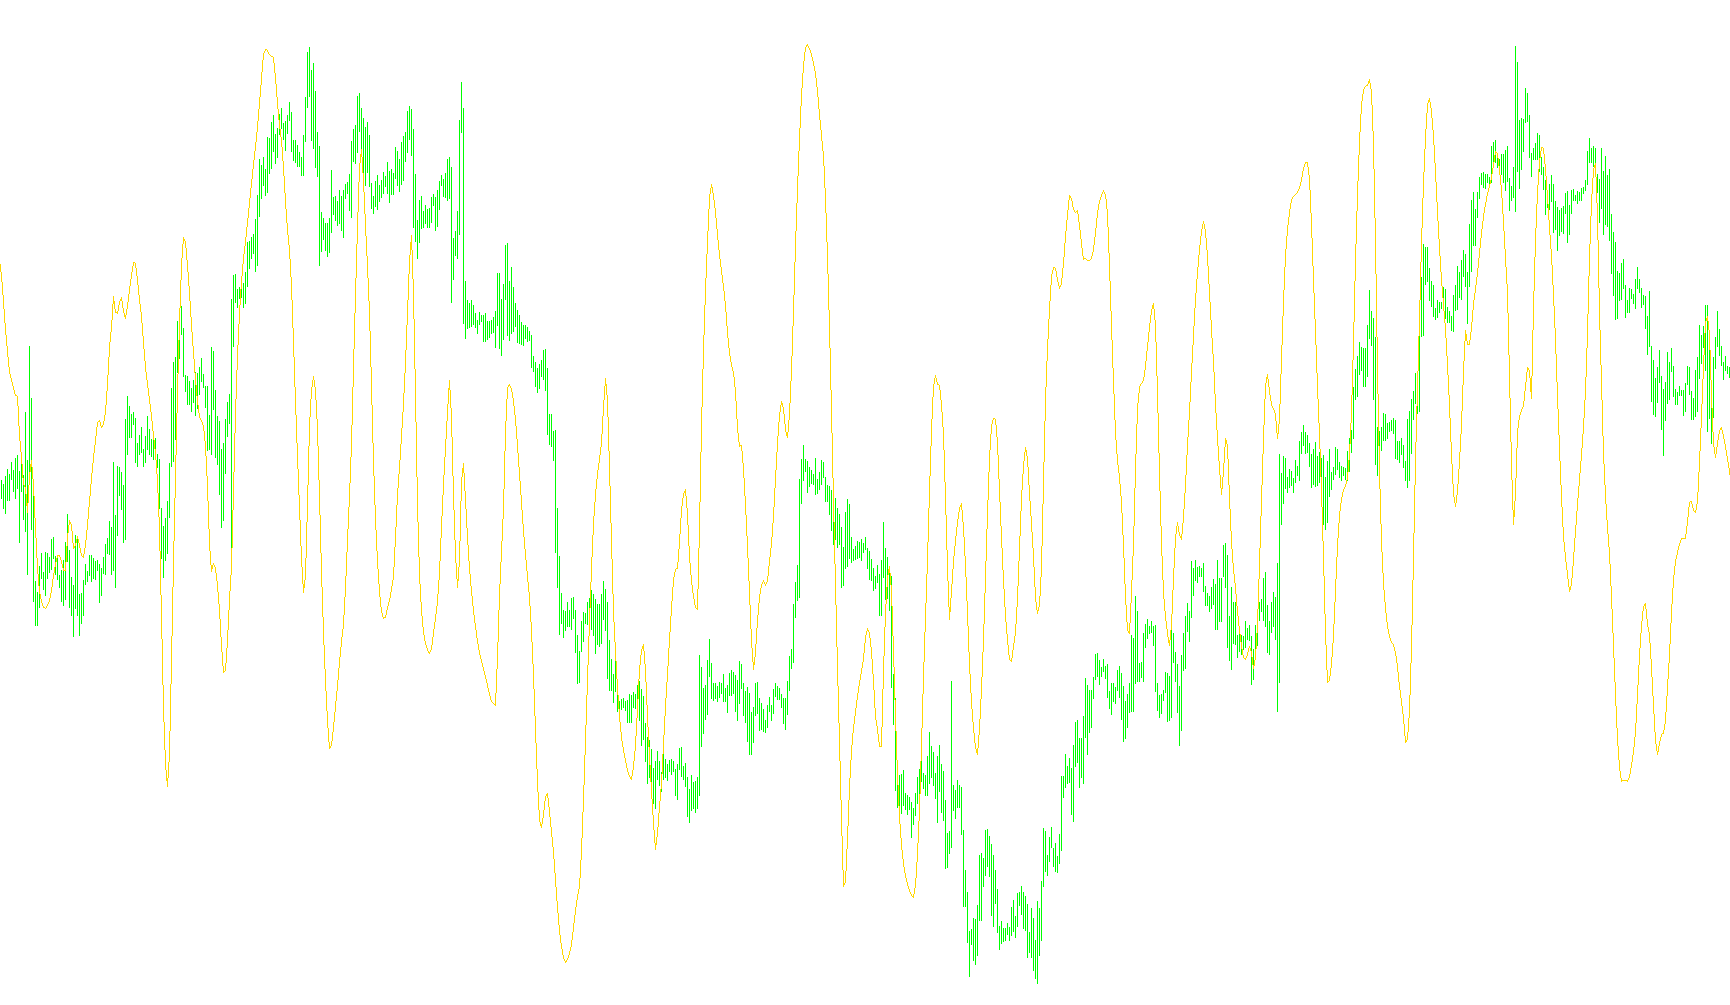
This technical tool is designed to function as a momentum oscillator, providing visual feedback on the strength and direction of price movements within a specific timeframe. By analyzing historical data, it helps traders identify whether a market trend is accelerating, slowing down, or reaching an exhaustive point.
Core Operational Logic
The script operates by processing a user-defined period of price action (the "Length") to calculate a smoothed representation of market volatility. Instead of simply looking at where the price ends, it evaluates the relationship between the high and low points of each bar to determine the "energy" behind the move.
Data Processing & Smoothing The tool uses a multi-stage smoothing process. It captures the raw difference between consecutive price movements and applies a series of mathematical filters. These filters work together to eliminate "noise"—the minor, insignificant fluctuations in price—allowing the underlying trend to become clearer. By layering these calculations, the script ensures that the resulting line movesFluidly rather than jumping erratically from one candle to the next.
Momentum Analysis At its heart, the logic focuses on comparing current momentum against a rolling average. It evaluates:
- Velocity: How fast the price is moving in a specific direction.
- Acceleration: Whether that movement is gaining strength or beginning to lose steam.
Visual Output & Interpretation The final result is plotted on a separate window as a line oscillating between 0 and 100. The logic interprets these values to provide a clear "health check" of the market trend:
- Baseline: A value of 50 represents a neutral state where no significant momentum is detected.
- Overbought/Oversold Dynamics: When the line moves toward the upper limits (approaching 100) or lower limits (approaching 0), it indicates high-intensity momentum.
- Trend Identification: The tool specifically looks for instances where price movement is significant enough to pull the oscillator away from the center. If the momentum stays above or below the midpoint, it suggests a sustained trend; if it begins to flatten or reverse toward the center, it suggests the current move may be losing its power.
In summary, this script transforms complex price volatility into a readable, smoothed line that helps traders visualize whether the market is currently "charging" in one direction or cooling off.
//+------------------------------------------------------------------+
//|                                                          rsx.mq4 |
//|                Copyright © 2005, Nick Bilak, beluck[AT]gmail.com |
//+------------------------------------------------------------------+
#property copyright "Copyright © 2005, Nick Bilak"
#property link      "http://metatrader.50webs.com/"
//----
#property indicator_separate_window
#property indicator_buffers 1
#property indicator_color1 Magenta
#property indicator_level1 70
#property indicator_level2 30
#property indicator_level3 50
#property indicator_maximum 100
#property indicator_minimum 0
//---- input parameters
extern int       Len=14;
//---- buffers
double rsx[];
double f88, f90;
double f0, v4, v8, vC, v10, v14, v18, v20;
double f8, f10, f18, f20, f28, f30, f38, f48, v1C;
double f50, f58, f60, f68, f70, f78, f80, f40;
//+------------------------------------------------------------------+
//| Custom indicator initialization function                         |
//+------------------------------------------------------------------+
int init()
  {
//---- indicators
   SetIndexStyle(0,DRAW_LINE);
   SetIndexBuffer(0,rsx);
   IndicatorShortName("rsx("+Len+")");
//----
   return(0);
  }
//+------------------------------------------------------------------+
//| Custor indicator deinitialization function                       |
//+------------------------------------------------------------------+
int deinit()
  {
   return(0);
  }
//+------------------------------------------------------------------+
//| Custom indicator iteration function                              |
//+------------------------------------------------------------------+
int start()
  {
   int counted_bars=IndicatorCounted(),limit,shift;
   if (counted_bars<0) return(-1);
   if (counted_bars>0) counted_bars--;
   limit=Bars-Len-1;
   if(counted_bars>Len) limit=Bars-counted_bars-1;
   if (limit<2) limit=100;
//----
   for(shift=limit;shift>=0;shift--)
     {
      if (f90==0.0)
        {
         f90=1.0;
         f0=0.0;
         if (Len-1>=5) f88=Len-1.0; else f88=5.0;
         f8=100.0*(High[shift]+Low[shift]);
         f18=3.0/(Len + 2.0);
         f20=1.0 - f18;
        }
      else
        {
         if (f88<=f90)
            f90=f88 + 1;
         else
            f90=f90 + 1;
         f10=f8;
         f8 =100*(High[shift]+Low[shift]);
         v8 =f8 - f10;
         f28=f20 * f28 + f18 * v8;
         f30=f18 * f28 + f20 * f30;
         vC =f28 * 1.5 - f30 * 0.5;
         f38=f20 * f38 + f18 * vC;
         f40=f18 * f38 + f20 * f40;
         v10=f38 * 1.5 - f40 * 0.5;
         f48=f20 * f48 + f18 * v10;
         f50=f18 * f48 + f20 * f50;
         v14=f48 * 1.5 - f50 * 0.5;
         f58=f20 * f58 + f18 * MathAbs(v8);
         f60=f18 * f58 + f20 * f60;
         v18=f58 * 1.5 - f60 * 0.5;
         f68=f20 * f68 + f18 * v18;
         f70=f18 * f68 + f20 * f70;
         v1C=f68 * 1.5 - f70 * 0.5;
         f78=f20 * f78 + f18 * v1C;
         f80=f18 * f78 + f20 * f80;
         v20=f78 * 1.5 - f80 * 0.5;
         if ((f88>=f90) && (f8!=f10)) f0=1.0;
         if ((f88==f90) && (f0==0.0)) f90=0.0;
        }
      if ((f88 < f90) && (v20 > 0.0000000001))
        {
         v4=(v14/v20 + 1.0) * 50.0;
         if (v4 > 100.0) v4=100.0;
         if (v4 < 0.0) v4=0.0;
         } else {
         v4=50.0;
        }
      rsx[shift]=v4;
     }
   return(0);
  }
//+------------------------------------------------------------------+
Comments