Range
Download script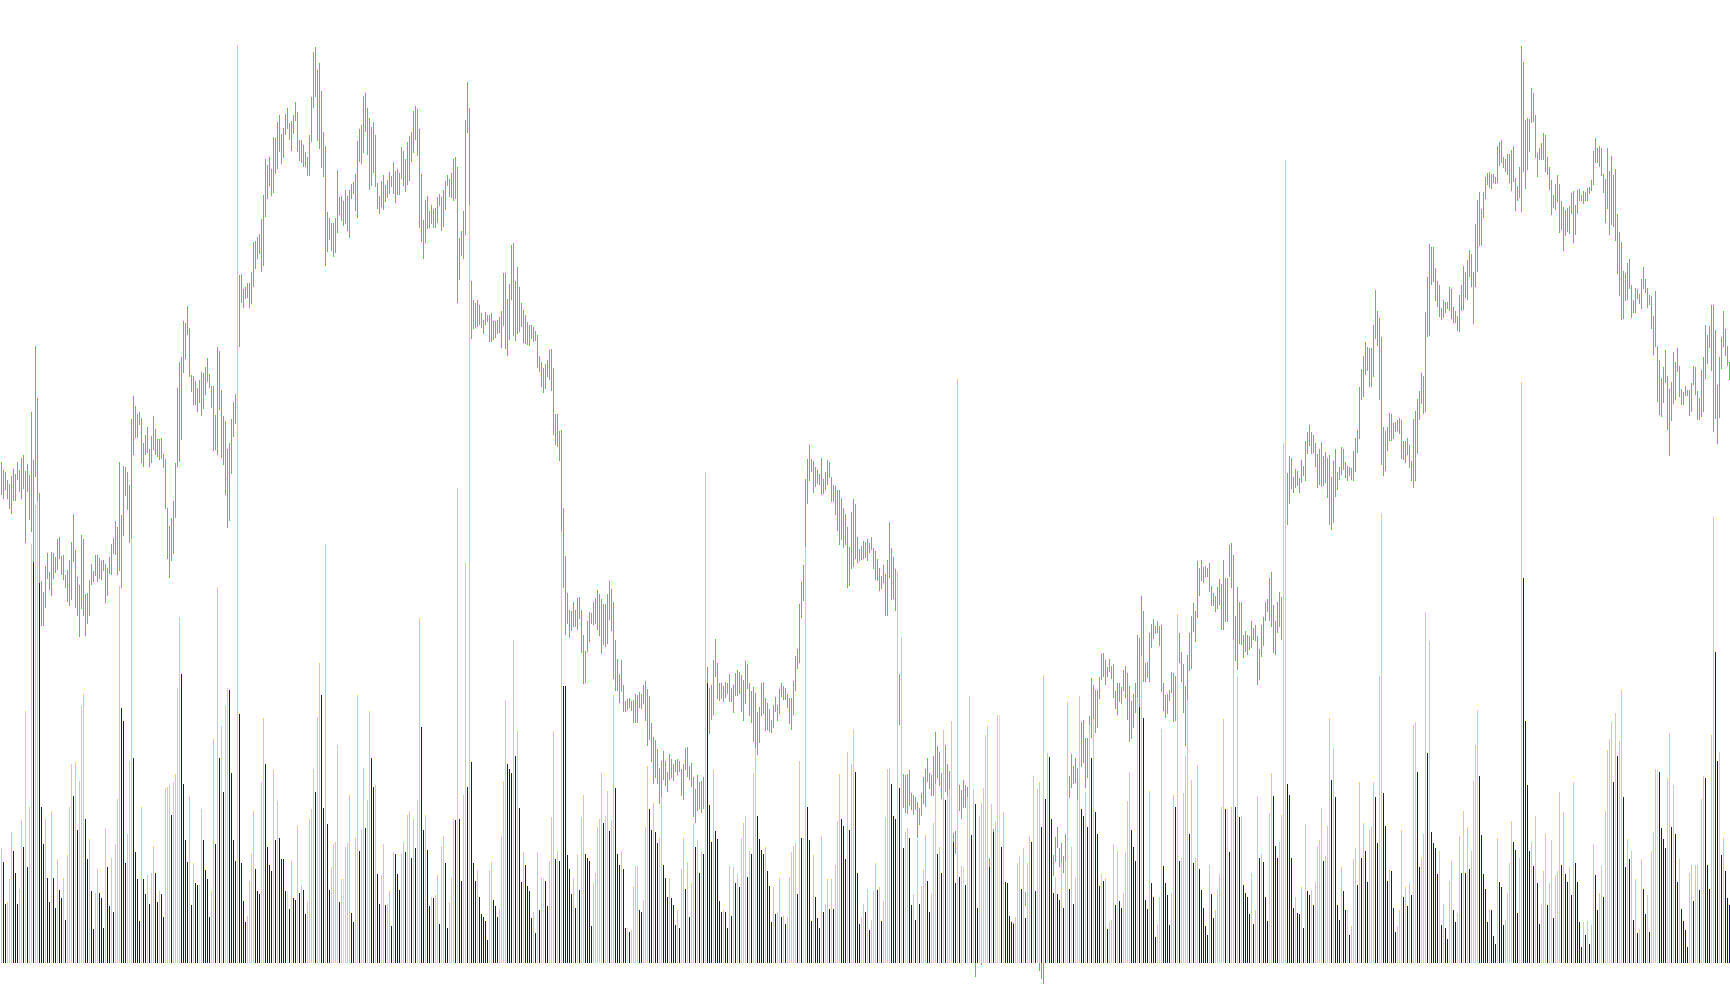
The Range V1.0 indicator is designed to provide traders with a clear visual representation of price volatility by comparing the current price movement to the preceding period. Its primary purpose is to identify whether the "range"—the distance between the highest and lowest price points—is expanding, contracting, or remaining stagnant.
How the Logic Works
The tool operates by analyzing the price action of each candle (bar) on your chart. It specifically looks at the mathematical difference between the high and low prices for the current candle and compares it to the difference found in the previous candle.
Based on this comparison, the logic categorizes each movement into one of three distinct states:
- Expansion (Higher): If the current candle's range is larger than the one before it, the indicator identifies this as an increase in volatility. This is visually represented to highlight growing price momentum.
- Contraction (Lower): If the current candle's range is smaller than the previous one, the indicator flags this as a decrease in volatility. This helps identify periods where price action may be tightening or losing steam.
- Neutral (No Change): If the range of the current candle is exactly equal to the previous one, the indicator recognizes that there has been no change in the volatility level.
Visual Display and Information
To make this data easy to interpret at a glance, the script handles the output in two ways:
- Histogram Visualization: The tool uses three different colored bars (Green, FireBrick, and Black) to distinguish between higher, lower, and no-change scenarios. This allows you to quickly scan your chart to see trends in market volatility.
- Real-Time Data Label: In addition to the visual bars, the script dynamically creates a text label on the chart. This label displays the exact numerical value of the current candle's range, updated automatically as new price data arrives.
Summary for the User
Essentially, this tool removes the guesswork from measuring volatility. Instead of manually calculating the distance between highs and lows, the indicator does the math instantly, telling you whether the market is getting "bigger" or "smaller" in its movements compared to just a moment ago.
//+------------------------------------------------------------------+
//|                                                      Range V1.0  |
//|                                                                  |
//|              Copyright © 2005, Jason Robinson                    |
//|               (jasonrobinsonuk,  jnrtrading)                     |
//|                http://www.jnrtrading.co.uk                       |
//|                                                                  |
//|               THIS VERSION IS FROM MY WEBSITE                    |
//|         (unless it has been posted by me on a forum)             |
//|                                                                  |
//+------------------------------------------------------------------+
#property copyright "Copyright © 2005, Jason Robinson"
#property link      "http://www.jnrtrading.co.uk"

#property indicator_separate_window
#property indicator_buffers 3
#property indicator_color1 Green
#property indicator_color2 FireBrick
#property indicator_color3 Black
#property indicator_minimum 0

double higher[];
double lower[];
double noChange[];

//+------------------------------------------------------------------+
//| Custom indicator initialization function                         |
//+------------------------------------------------------------------+
int init() {
//---- indicators
   SetIndexStyle(0,DRAW_HISTOGRAM);
   SetIndexBuffer(0, higher);
   SetIndexLabel(0, "Higher");
   SetIndexStyle(1,DRAW_HISTOGRAM);
   SetIndexBuffer(1, lower);
   SetIndexLabel(1, "Lower");
   SetIndexStyle(2,DRAW_HISTOGRAM);
   SetIndexBuffer(2, noChange);
   SetIndexLabel(2, "No Change");

   IndicatorShortName("Range (H L nC)");

//----

   return(0);
}
//+------------------------------------------------------------------+
//| Custor indicator deinitialization function                       |
//+------------------------------------------------------------------+
int deinit() {
//----

//----
   return(0);
  }
//+------------------------------------------------------------------+
//| Custom indicator iteration function                              |
//+------------------------------------------------------------------+
int start()
  {
   int limit, i;
   int counted_bars=IndicatorCounted();
//---- check for possible errors
   if(counted_bars<0) return(-1);
//---- last counted bar will be recounted
   if(counted_bars>0) counted_bars--;

   limit=Bars-counted_bars;

   for(i = 0; i <= limit; i++) {
      if (High[i] - Low[i] > High[i+1] - Low[i+1]) {
         higher[i] = High[i] - Low[i];
         lower[i] = 0;
         noChange[i] = 0;
      }
      else if (High[i] - Low[i] < High[i+1] - Low[i+1]) {
         lower[i] = High[i] - Low[i];
         higher[i] = 0;
         noChange[i] = 0;
      }
      else {
         noChange[i] = High[i] - Low[i];
         lower[i] = 0;
         higher[i] = 0;
      }
      ObjectDelete("Range");
      ObjectCreate("Range", OBJ_TEXT, 1, Time[0], High[0] - Low[0]);
      ObjectSetText("Range", "             " + DoubleToStr(High[0] - Low[0], 4), 10, "Verdana", Black);
   }


   return(0);
}
Comments