Rads T3 Stochastic-3
Download script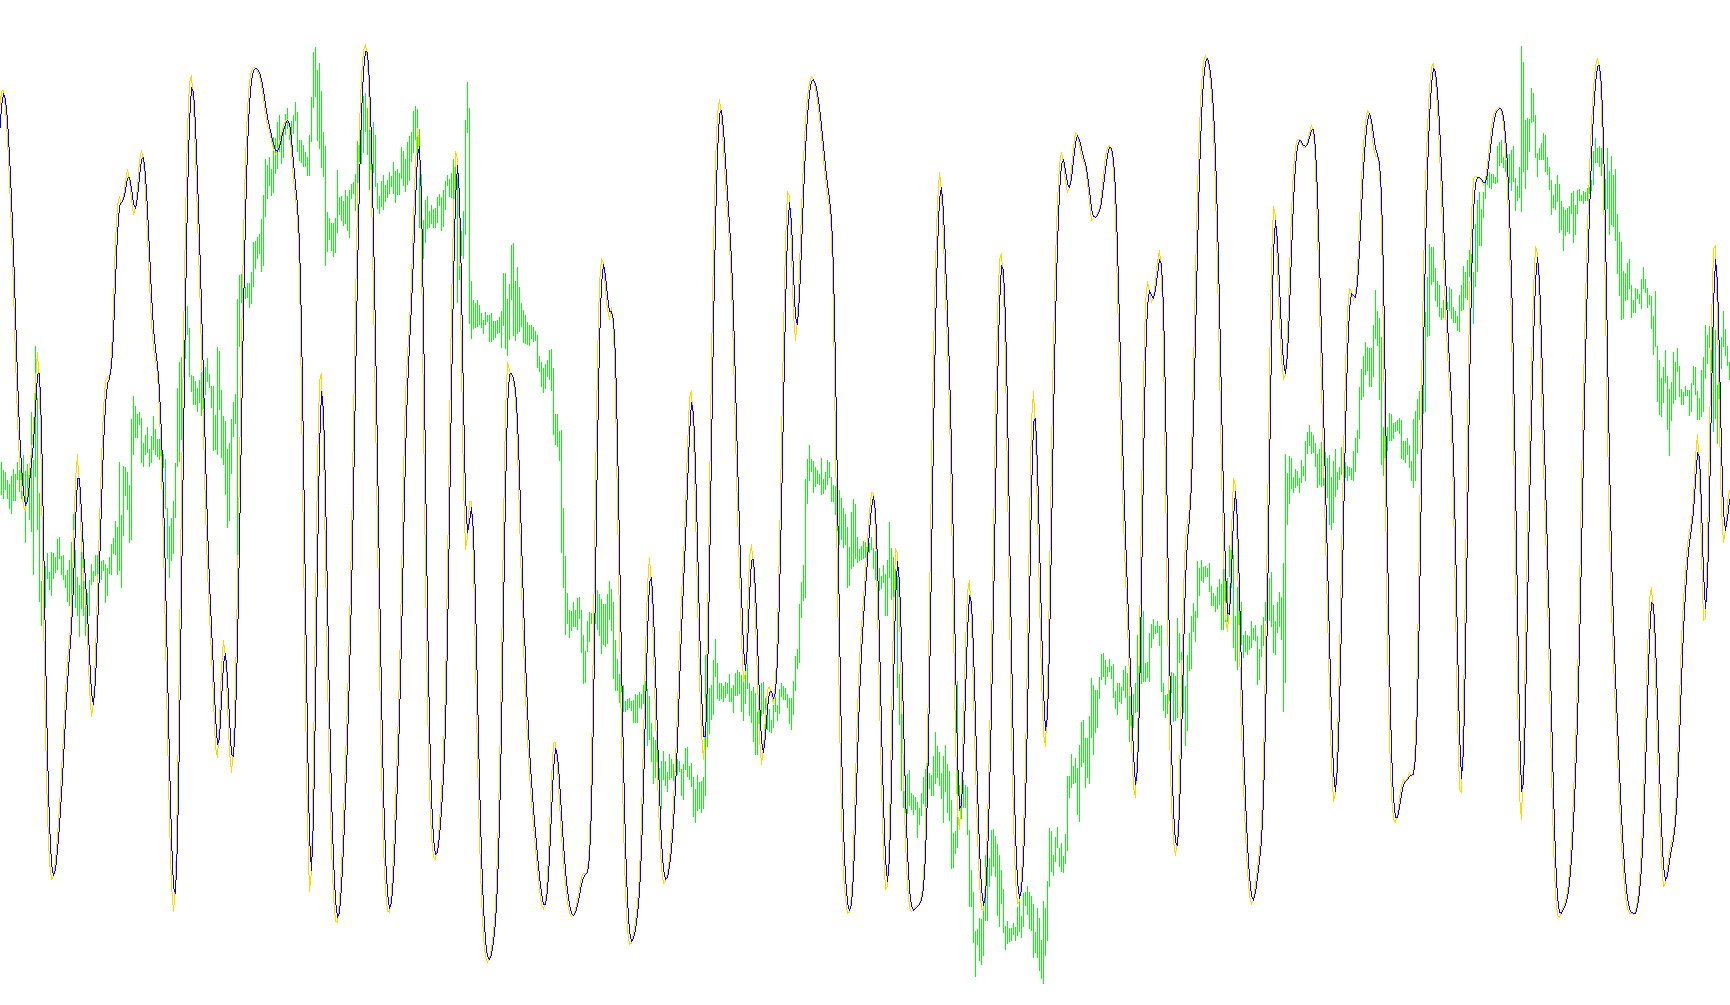
This tool is a specialized technical indicator designed for the MetaTrader trading platform. It combines two well-known trading concepts—the Stochastic Oscillator and the T3 Moving Average—to create a smoother, more refined visual representation of market momentum.
Core Purpose
The primary goal of this script is to identify whether an asset (like a currency pair or stock) is overbought, oversold, or trending in a specific direction. While standard oscillators can sometimes be "noisy" or jump around erratically, this tool applies a sophisticated mathematical filter to stabilize those movements, helping traders spot clearer trends and more reliable entry points.
How the Logic Works
The indicator functions through a multi-step processing sequence:
-
Base Stochastic Calculation: First, the script calculates the standard Stochastic values. This measures the current price relative to its price range over a specific period. It identifies the "speed" of price movement and where it sits within that recent range.
-
The T3 Smoothing Filter: Once the base Stochastic values are obtained, the script passes them through a "T3" calculation. Unlike a simple moving average, which can be slow to react, or an exponential moving average, which can be too sensitive, the T3 logic uses complex weighted coefficients. This allows the indicator to:
- Reduce market "noise" and random price fluctuations.
- Maintain high sensitivity to actual trend changes while remaining visually smooth.
-
Dual-Line Output: The script produces two distinct lines on your chart:
- Main Line (Stochastic): This represents the primary smoothed momentum of the market.
- Signal Line: This is a secondary smoothing calculation applied to the main line. It acts as a reference point; when the Main Line crosses this Signal Line, it is often interpreted by traders as a signal that momentum is shifting.
User Experience & Visuals
The indicator appears in a separate window below your main price chart. It features two horizontal levels (typically 80 and 20):
- When the lines move toward or above the upper level, it suggests the market might be overextended to the upside (overbought).
- When the lines move toward or below the lower level, it suggests the market might be overextended to the downside (oversold).
By combining these elements, the script provides a cleaner, more "fluid" view of market momentum compared to standard indicators, aiming to give traders a clearer picture of where the price is heading with less visual distraction.
//+------------------------------------------------------------------+
//|                                                T3 Stochastic.mq4 |
//|                                       Original Code by FX Sniper |
//|                                  Copyright © 2007, Forex-TSD.com |
//|                                              Written by Linuxser |
//+------------------------------------------------------------------+
#property copyright "Copyright © 2007, Forex-TSD.com "
#property link      "http://www.forex-tsd.com/"

#property indicator_separate_window
#property indicator_buffers 2
#property indicator_color1 Black
#property  indicator_color2  DarkBlue
#property  indicator_level1  80
#property  indicator_level2  20
#property  indicator_levelcolor DarkGray
#property  indicator_levelstyle 2
//----
extern int KPeriod=13;
extern int DPeriod=3;
extern int Slowing=3;
extern int Price_field = 1; //Price field parameter. Can be one of this values: 0 - Low/High or 1 - Close/Close.
extern int MA_Method  =  3; //MODE_SMA :	0 // MODE_EMA:	1 // MODE_SMMA: 2 // MODE_LWMA: 3 //
extern int T3_Period = 9;
extern double b = 0.81;
extern int Style  = 0;

//----
double e1, e2, e3, e4, e5, e6;
double e1a, e2a, e3a, e4a, e5a, e6a;
double c1, c2, c3, c4;
double c1a, c2a, c3a, c4a;
double n, w1, w2, b2, b3;
double na, w1a, w2a, b2a, b3a;
double Stochastic[];
double Stochastic_Signal[];

//+------------------------------------------------------------------+
//| Custom indicator initialization function                         |
//+------------------------------------------------------------------+
int init()
  {
//---- indicators setting
    SetIndexBuffer(0, Stochastic);
    SetIndexBuffer(1, Stochastic_Signal);

//----
    SetIndexStyle(0, DRAW_LINE,0);
    SetIndexStyle(1, DRAW_LINE,0);


//----
    IndicatorShortName("Rads Stochastic T3("+KPeriod+","+DPeriod+","+Slowing+", T3 "+T3_Period+ ")");
    SetIndexLabel(0, "Stochastic");
    SetIndexLabel(1, "Signal");

//---- variable reset
    b2 = b*b;
    b3 = b2*b;
    c1 = -b3;
    c2 = (3*(b2 + b3));
    c3 = -3*(2*b2 + b + b3);
    c4 = (1 + 3*b + b3 + 3*b2);
    n = T3_Period;

    b2a = b*b;
    b3a = b2a*b;
    c1a = -b3a;
    c2a = (3*(b2a + b3a));
    c3a = -3*(2*b2a + b + b3a);
    c4a = (1 + 3*b + b3a + 3*b2a);
    na = T3_Period;
//----
    if(n < 1)
        n = 1;
    n = 1 + 0.5*(n - 1);
    w1 = 2 / (n + 1);
    w2 = 1 - w1;

        na = 1;
    na = 1 + 0.5*(na - 1);
    w1a = 2 / (na + 1);
    w2a = 1 - w1a;
//----
    return(0);
  }
//+------------------------------------------------------------------+
//| Custom indicator iteration function                              |
//+------------------------------------------------------------------+
int start()
  {
   int limit;
   int counted_bars = IndicatorCounted();
//---- check for possible errors
   if(counted_bars < 0)
       return(-1);
//---- last counted bar will be recounted
   if(counted_bars > 0)
       counted_bars--;
   limit = Bars - counted_bars;
//---- indicator calculation
   for(int i = Bars - 1; i >= 0; i--)
     {
       Stochastic[i] = iStochastic(NULL,0,KPeriod,DPeriod,Slowing,MA_Method,Price_field,MODE_MAIN,i);
       e1 = w1*Stochastic[i]  + w2*e1;
       e2 = w1*e1 + w2*e2;
       e3 = w1*e2 + w2*e3;
       e4 = w1*e3 + w2*e4;
       e5 = w1*e4 + w2*e5;
       e6 = w1*e5 + w2*e6;
       Stochastic[i]  = c1*e6 + c2*e5 + c3*e4 + c4*e3;
     }
     for(i = Bars - 1 ; i >= 0; i--)
     {
       Stochastic_Signal[i] = iStochastic(NULL,0,KPeriod,DPeriod,Slowing,MA_Method,Price_field,MODE_SIGNAL,i);
       e1 = w1*Stochastic_Signal[i]  + w2*e1;
       e2 = w1*e1 + w2*e2;
       e3 = w1*e2 + w2*e3;
       e4 = w1*e3 + w2*e4;
       e5 = w1*e4 + w2*e5;
       e6 = w1*e5 + w2*e6;
       Stochastic_Signal[i] = c1*e6 + c2*e5 + c3*e4 + c4*e3;
      }

//----
   return(0);
  }
//+------------------------------------------------------------------+
Comments