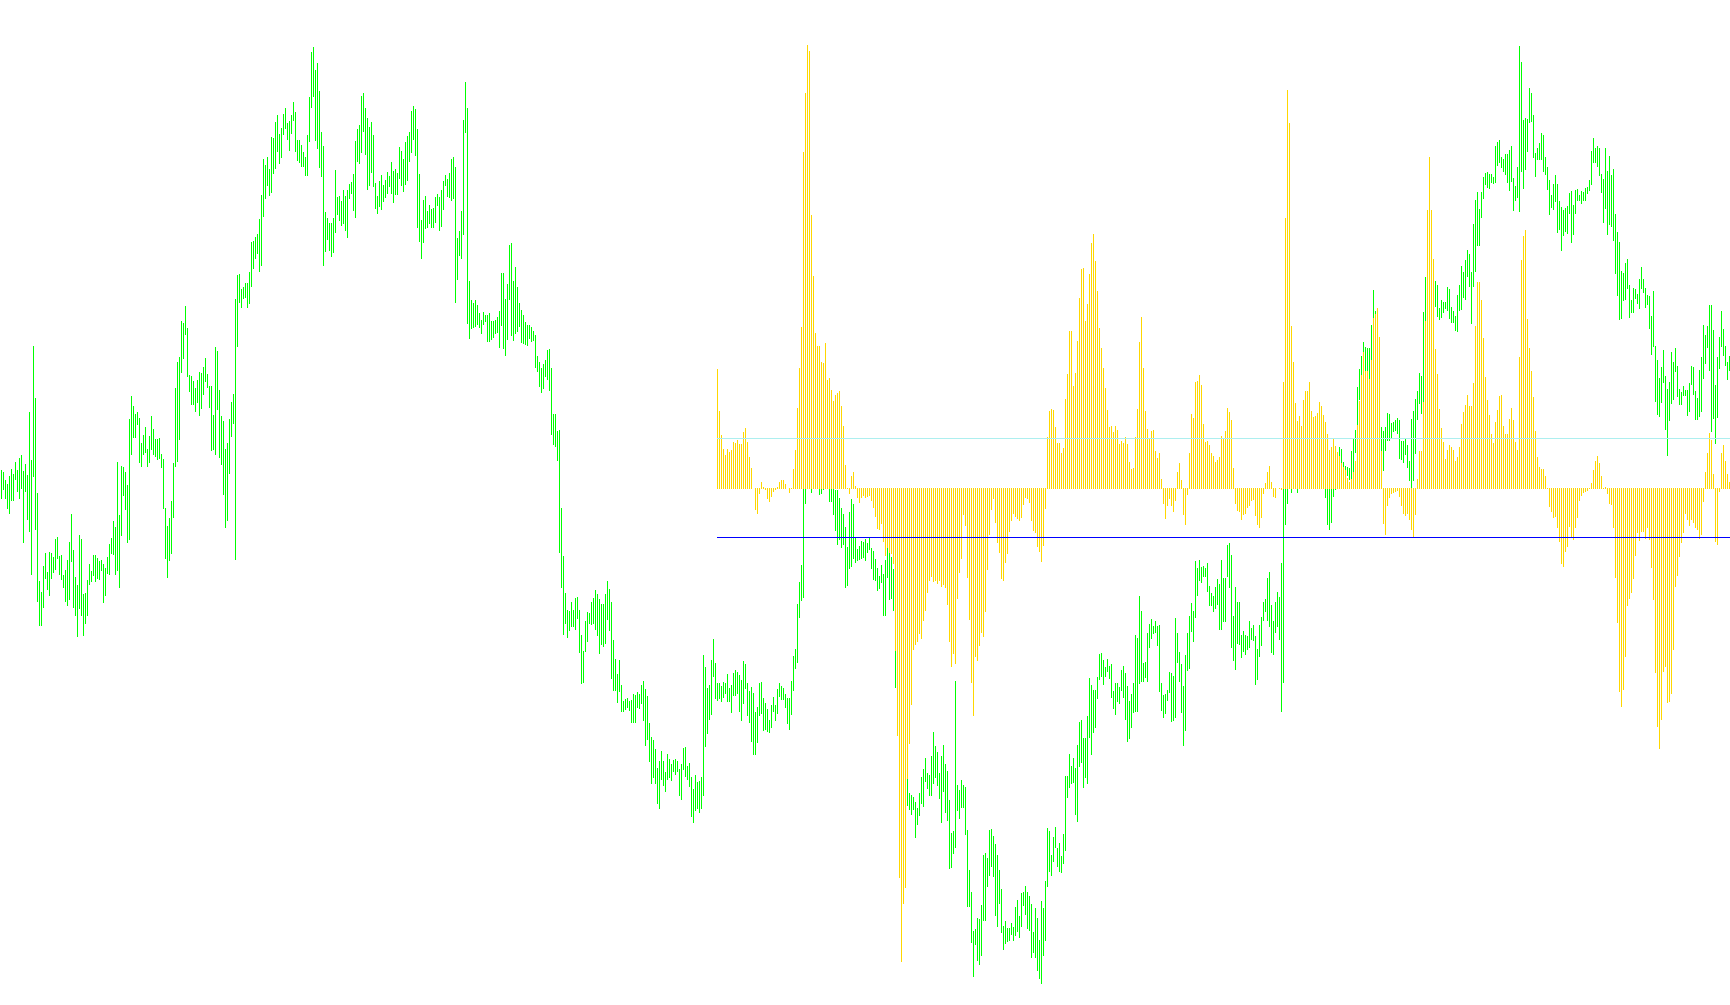
This tool is designed as a visual aid for traders to help identify momentum and potential trend reversals in financial markets. It operates by analyzing the relationship between two different moving averages while factoring in market volatility.
Core Logic and Functionality
1. Dual Moving Average Comparison The script calculates the distance between a "fast" moving average (which reacts quickly to price changes) and a "slow" moving average (which reflects long-term trends). By comparing these two, the tool seeks to determine how much the current price is deviating from its historical average.
2. Volatility Normalization To ensure that the data remains consistent regardless of whether the market is highly volatile or relatively calm, the script incorporates an Average True Range (ATR) calculation. This "normalizes" the difference between the moving averages, preventing the indicator from showing exaggerated swings during periods of extreme price movement.
3. Mathematical Transformation Once the normalized difference is calculated, it undergoes a specific mathematical transformation (using exponential functions). The purpose of this step is to convert raw price data into a standardized oscillator format. This allows the results to be viewed within a compact range, making it easier for the user to see clearly when momentum is shifting.
4. Visual Output and Thresholds The indicator renders three distinct visual elements on the chart:
- The Main Histogram: This shows the current momentum level. It moves up and down based on the strength of the price trend.
- Trigger Lines: The script establishes fixed upper and lower boundary lines (based on a user-defined trigger value). These act as "thresholds." When the histogram crosses above or below these lines, it provides a visual cue that the momentum may be reaching an extreme point or entering a new phase.
Summary for Traders
In simple terms, this script takes complex price data and boils it down into a single oscillating histogram. It tells you how fast the market is moving relative to its recent history, adjusted for how "choppy" the market currently is. By watching the histogram interact with the trigger lines, traders can better identify potential overextended moves or shifts in trend direction.
/*-----------------------------+
|			       |
| Shared by www.Aptrafx.com    |
|			       |
+------------------------------*/

//+------------------------------------------------------------------+
//|                                               RAVI FX Fisher.mq4 |
//|                         Copyright © 2005, Luis Guilherme Damiani |
//|                                      http://www.damianifx.com.br |
//+------------------------------------------------------------------+
#property copyright "Copyright © 2005, Luis Guilherme Damiani"
#property link      "http://www.damianifx.com.br"

#property indicator_separate_window
#property indicator_buffers 3
#property indicator_color1 MediumSeaGreen
#property indicator_color2 MediumVioletRed
#property indicator_color3 MediumVioletRed
//---- input parameters
extern int       MAfast=4;
extern int       MAslow=49;
extern double trigger=0.07;
extern int       maxbars=500;

//---- buffers
double RAVIfxFishBuffer[];
double LoTrigBuff[];
double HiTrigBuff[];
//+------------------------------------------------------------------+
//| Custom indicator initialization function                         |
//+------------------------------------------------------------------+
int init()
  {
//---- indicators
   SetIndexStyle(0,DRAW_HISTOGRAM);
   SetIndexBuffer(0,RAVIfxFishBuffer);
   SetIndexStyle(1,DRAW_LINE);
   SetIndexBuffer(1,LoTrigBuff);
   SetIndexStyle(2,DRAW_LINE);
   SetIndexBuffer(2,HiTrigBuff);
//----
   return(0);
  }
//+------------------------------------------------------------------+
//| Custor indicator deinitialization function                       |
//+------------------------------------------------------------------+
int deinit()
  {
//----

//----
   return(0);
  }
//+------------------------------------------------------------------+
//| Custom indicator iteration function                              |
//+------------------------------------------------------------------+

int start()
  {
      int    counted_bars=IndicatorCounted();
      double MAValue=0;
      double IFish=0;
      //---- check for possible errors
      if(counted_bars<0) return(-1);
      int limit=Bars-counted_bars;
      if(limit>maxbars)limit=maxbars;
      if (limit>Bars-MAslow-1)limit=Bars-MAslow-1;
      //----
      for (int shift = 0; shift<=limit;shift++)
      {
	     //if period >70 then {LoTrigger=-0.15;HiTrigger=0.15;}else {LoTrigger=-0.07;HiTrigger=0.07;};

	     MAValue = 100 * (iMA(NULL,0,MAfast,0,MODE_LWMA,PRICE_TYPICAL,shift) - iMA(NULL,0,MAslow,0,MODE_LWMA,PRICE_TYPICAL,shift))*iATR(NULL,0,MAfast,shift)
	              /iMA(NULL,0,MAslow,0,MODE_LWMA,PRICE_TYPICAL,shift)/iATR(NULL,0,MAslow,shift);
	     IFish=(MathExp(2*MAValue)-1)/(MathExp(2*MAValue)+1);


         RAVIfxFishBuffer[shift]=IFish;
         LoTrigBuff[shift]=-trigger;
         HiTrigBuff[shift]=trigger;
       }

//----
   return(0);
  }
//+------------------------------------------------------------------+
Comments