RAVI FX
Download script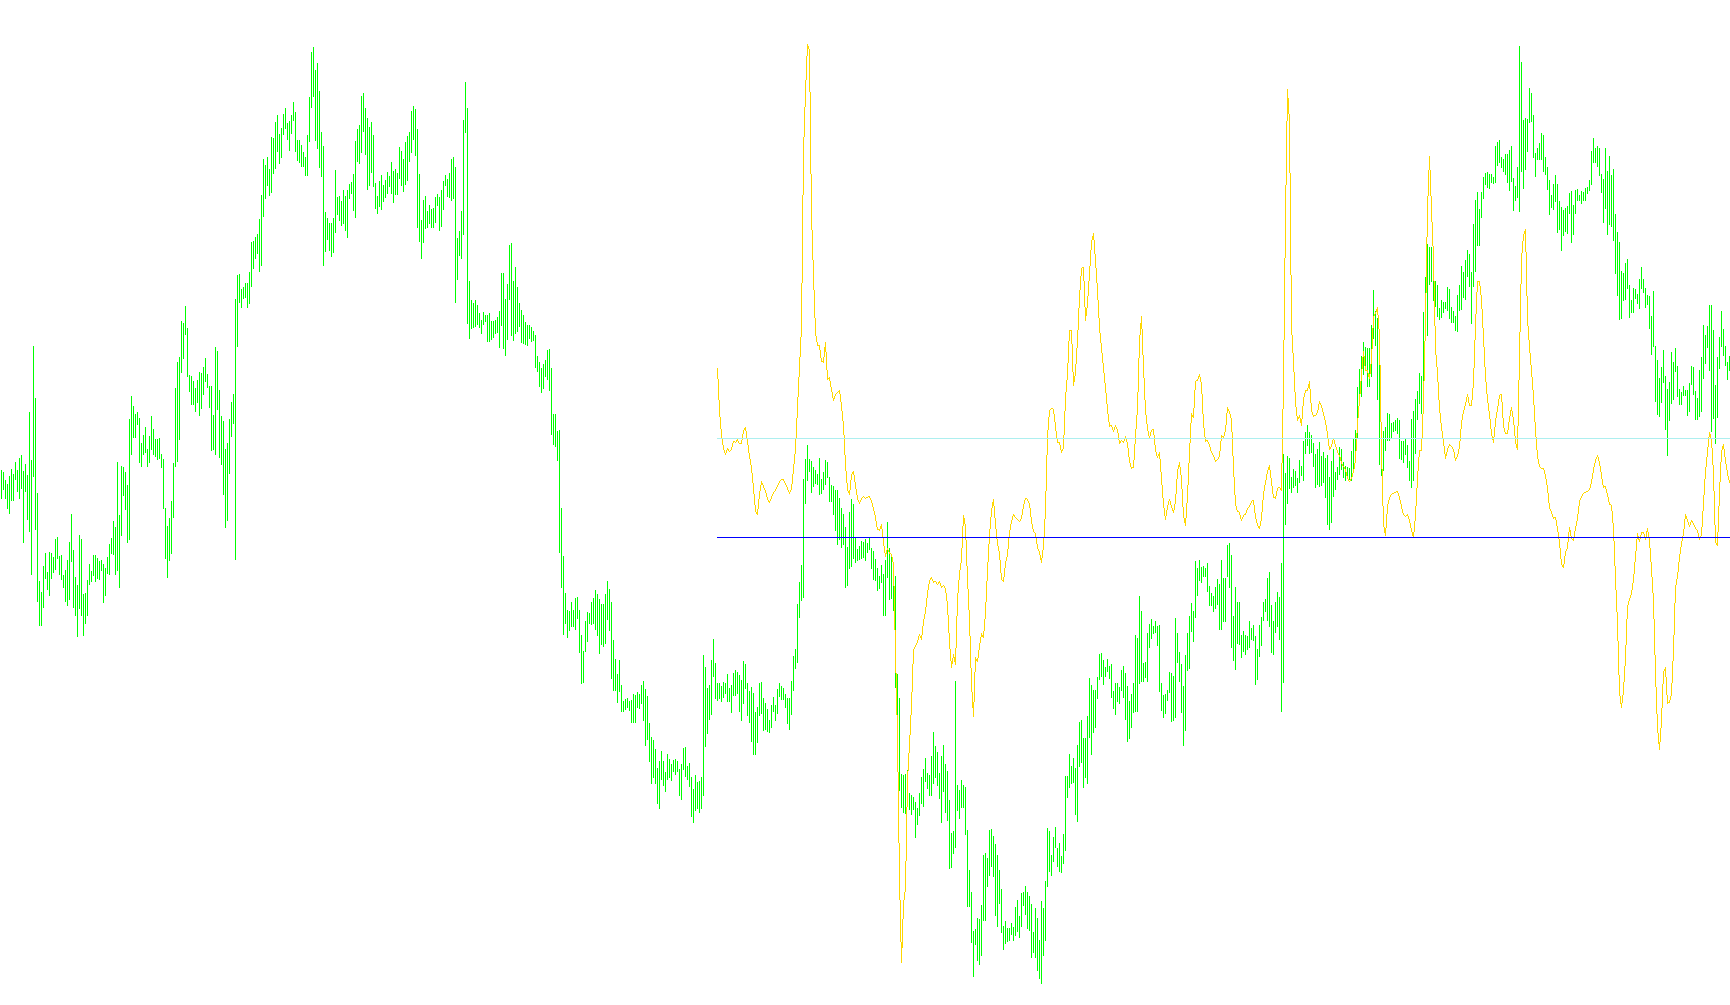
The RAVI FX Fisher is a custom technical analysis tool designed to help traders visualize and identify market momentum by distilling complex price movements into a simplified, readable format. Rather than looking at raw price charts, this script calculates a specific momentum value that oscillates between set boundaries, making it easier to spot significant shifts in market sentiment.
How the Logic Works
The indicator operates through a three-step mathematical process to transform standard market data into a visual signal:
1. Trend Comparison and Normalization The script begins by comparing two different moving averages—a "fast" one (which reacts quickly to recent price changes) and a "slow" one (which tracks the broader trend). It calculates the percentage difference between these two averages. To ensure the data remains consistent across different assets (like switching from Forex to Gold), it normalizes this difference using the Average True Range (ATR). This step essentially tells the script, "How much is the current price deviating from its long-term average relative to its usual volatility?"
2. The Momentum Transformation Once the script has a raw value of the trend's strength, it applies an exponential function (a hyperbolic tangent calculation). This is the "Fisher" element of the logic. It compresses the wide range of possible price movements into a much narrower, controlled scale. This prevents the indicator from "wandering" off the chart during extreme moves and keeps the focus on the core momentum.
3. Visual Boundaries and Signals The final output is plotted in a separate window beneath your main price chart. The script generates three distinct lines:
- The Momentum Line: A central line that fluctuates based on the current market strength.
- The Upper and Lower Triggers: Two horizontal boundaries set at specific thresholds.
How to Interpret the Results
By observing where the momentum line sits in relation to the trigger boundaries, traders can look for specific behaviors:
- Overextended Movements: When the momentum line pushes significantly above or below the triggers, it suggests that the current trend might be reaching an exhaustion point.
- Momentum Shifts: Sharp turns in the momentum line can indicate a loss of steam in the current direction, potentially signaling a reversal or a period of consolidation before the next move.
In summary, this tool acts as a "momentum speedometer," stripping away the noise of the price chart to show you the underlying strength and health of the current market trend.
//+------------------------------------------------------------------+
//|                                               RAVI FX Fisher.mq4 |
//|                         Copyright © 2005, Luis Guilherme Damiani |
//|                                      http://www.damianifx.com.br |
//+------------------------------------------------------------------+
#property copyright "Copyright © 2005, Luis Guilherme Damiani"
#property link      "http://www.damianifx.com.br"

#property indicator_separate_window
#property indicator_buffers 3
#property indicator_color1 MediumSeaGreen
#property indicator_color2 MediumVioletRed
#property indicator_color3 MediumVioletRed
//---- input parameters
extern int       MAfast=4;
extern int       MAslow=49;
extern double trigger=0.07;
extern int       maxbars=500;

//---- buffers
double RAVIfxFishBuffer[];
double LoTrigBuff[];
double HiTrigBuff[];
//+------------------------------------------------------------------+
//| Custom indicator initialization function                         |
//+------------------------------------------------------------------+
int init()
  {
//---- indicators
   SetIndexStyle(0,DRAW_LINE);
   SetIndexBuffer(0,RAVIfxFishBuffer);
   SetIndexStyle(1,DRAW_LINE);
   SetIndexBuffer(1,LoTrigBuff);
   SetIndexStyle(2,DRAW_LINE);
   SetIndexBuffer(2,HiTrigBuff);
//----
   return(0);
  }
//+------------------------------------------------------------------+
//| Custor indicator deinitialization function                       |
//+------------------------------------------------------------------+
int deinit()
  {
//----

//----
   return(0);
  }
//+------------------------------------------------------------------+
//| Custom indicator iteration function                              |
//+------------------------------------------------------------------+

int start()
  {
      int    counted_bars=IndicatorCounted();
      double MAValue=0;
      double IFish=0;
      //---- check for possible errors
      if(counted_bars<0) return(-1);
      int limit=Bars-counted_bars;
      if(limit>maxbars)limit=maxbars;
      if (limit>Bars-MAslow-1)limit=Bars-MAslow-1;
      //----
      for (int shift = 0; shift<=limit;shift++)
      {
	     //if period >70 then {LoTrigger=-0.15;HiTrigger=0.15;}else {LoTrigger=-0.07;HiTrigger=0.07;};

	     MAValue = 100 * (iMA(NULL,0,MAfast,0,MODE_LWMA,PRICE_TYPICAL,shift) - iMA(NULL,0,MAslow,0,MODE_LWMA,PRICE_TYPICAL,shift))*iATR(NULL,0,MAfast,shift)
	              /iMA(NULL,0,MAslow,0,MODE_LWMA,PRICE_TYPICAL,shift)/iATR(NULL,0,MAslow,shift);
	     IFish=(MathExp(2*MAValue)-1)/(MathExp(2*MAValue)+1);


         RAVIfxFishBuffer[shift]=IFish;
         LoTrigBuff[shift]=-trigger;
         HiTrigBuff[shift]=trigger;
       }

//----
   return(0);
  }
//+------------------------------------------------------------------+
Comments