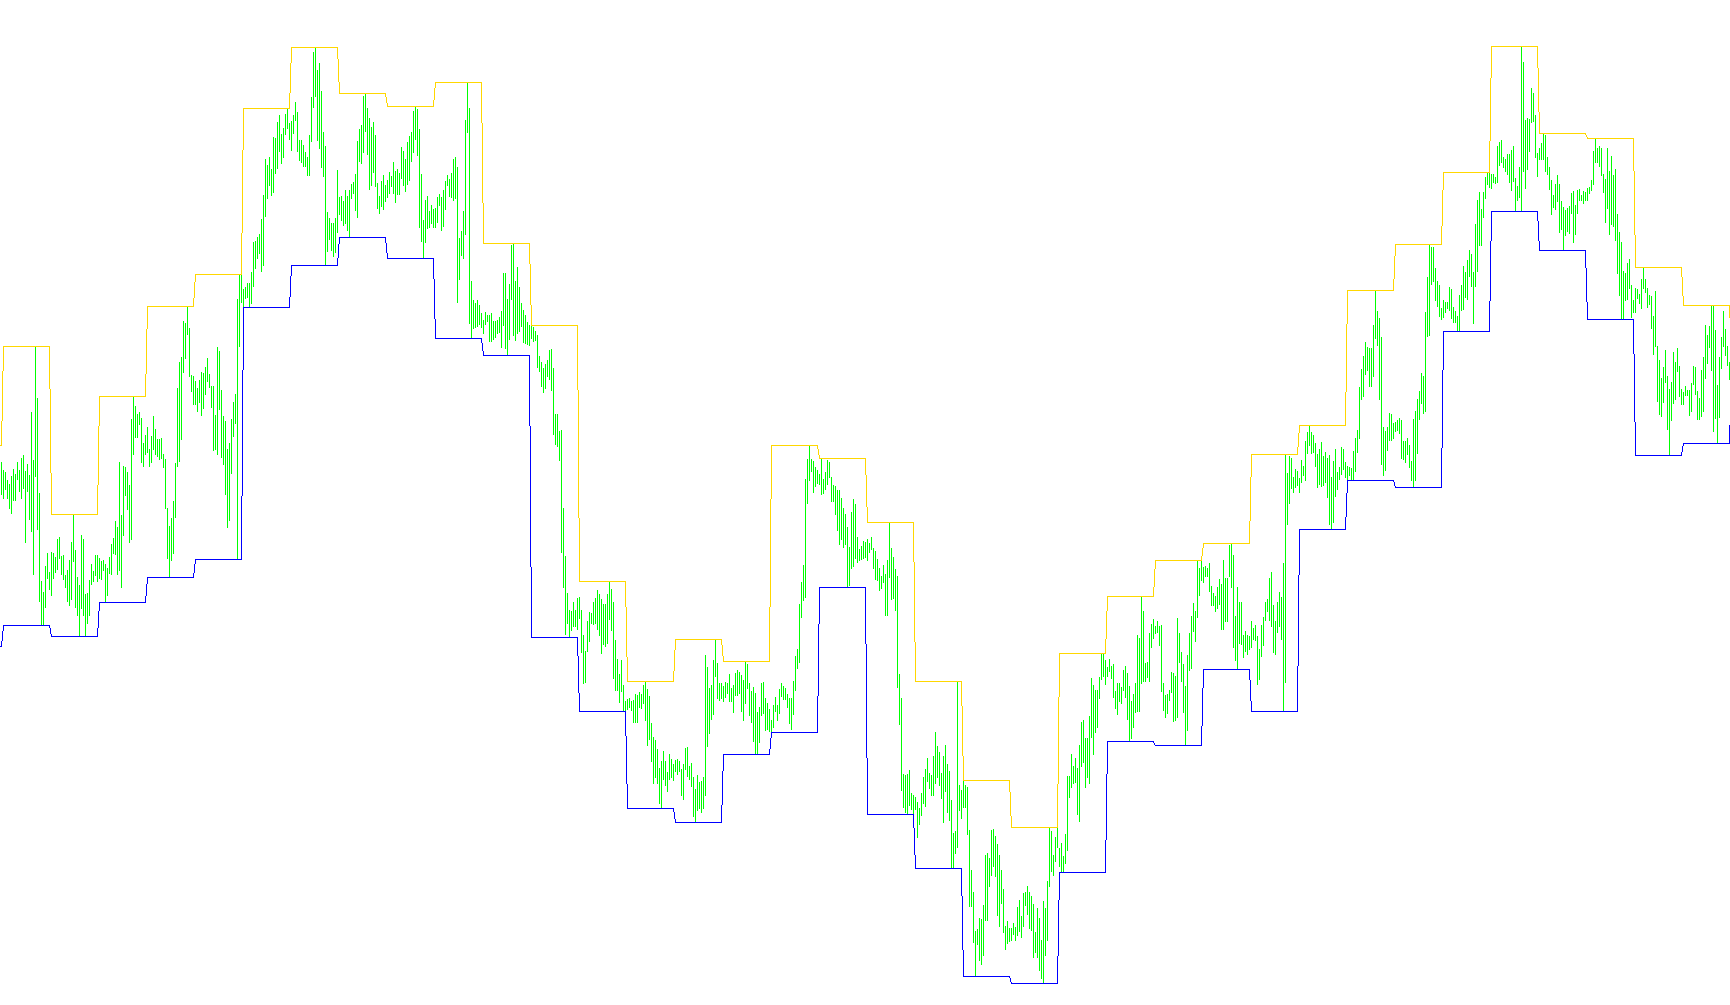
This tool is designed to provide traders with a clear visualization of significant price boundaries by identifying the highest and lowest points across larger timeframes. Instead of focusing solely on the immediate, rapid fluctuations of the current chart, this script pulls data from a broader perspective to help define the overall "range" of the market.
Core Functionality
The primary logic of the script revolves around Multi-Timeframe Analysis. It allows you to view price extremes—specifically the peaks (Highs) and valleys (Lows)—from a higher timeframe (such as Daily, Weekly, or Hourly charts) directly on your current active chart.
By doing this, the indicator helps filter out "market noise." It identifies where the price has historically peaked and bottomed over a longer duration, allowing you to see the overarching structure of the market more clearly.
How the Logic Works
- Timeframe Selection: The script allows you to choose a specific reference timeframe (e.g., looking at Daily data while on a 15-minute chart). If the selected timeframe is smaller than your current chart, the script will alert you that the settings are incorrect, ensuring the data remains logically consistent.
- Data Synchronization: The script automatically scans through historical data to match up specific dates and times from your chosen larger timeframe with the candles on your current screen.
- Dynamic Boundary Mapping: For every point on your current chart, the script looks back to find the corresponding period in the higher timeframe. It then "projects" the High and Low prices of that larger period onto your current chart.
- Visual Output: The result is a pair of lines on your screen:
- One line represents the High boundary of the selected timeframe.
- The second line represents the Low boundary of the selected timeframe.
Practical Application
This logic is intended to help traders identify "support" and "resistance" levels more effectively. By seeing where a Daily or Weekly range begins and ends, you can better understand whether the current price action is approaching a major historical turning point or if it is moving within a established trading zone. It essentially provides a "big picture" map while you are executing trades on a smaller, more detailed scale.
//+------------------------------------------------------------------+
//|                                                     Range_v2.mq4 |
//|                                  Copyright © 2006, Forex-TSD.com |
//|                         Written by IgorAD,igorad2003@yahoo.co.uk |
//|            http://finance.groups.yahoo.com/group/TrendLaboratory |
//+------------------------------------------------------------------+
#property copyright "Copyright © 2006, Forex-TSD.com "
#property link      "http://www.forex-tsd.com/"

#property indicator_chart_window
#property indicator_buffers 2
#property indicator_color1 DodgerBlue
#property indicator_color2 DodgerBlue
#property indicator_width1 2
#property indicator_width2 2

extern int TimeFrame=1440;

double UpBuffer[];
double DnBuffer[];
double Buffer1[];
double Buffer2[];

int init()
{
   string short_name;
   IndicatorBuffers(4);

   SetIndexStyle(0,DRAW_LINE);
   SetIndexBuffer(0,UpBuffer);
   SetIndexLabel(0,"Up");
   SetIndexDrawBegin(0,0);

   SetIndexStyle(1,DRAW_LINE);
   SetIndexBuffer(1,DnBuffer);
   SetIndexLabel(1,"Down");
   SetIndexDrawBegin(1,0);

   SetIndexBuffer(2,Buffer1);
   SetIndexBuffer(3,Buffer2);
   short_name="Range_v2("+TimeFrame+")";
   IndicatorShortName(short_name);


   switch(TimeFrame)
   {
   case 1    : TimeFrame=PERIOD_M1;  break;
   case 5    : TimeFrame=PERIOD_M5;  break;
   case 15   : TimeFrame=PERIOD_M15; break;
   case 30   : TimeFrame=PERIOD_M30; break;
   case 60   : TimeFrame=PERIOD_H1;  break;
   case 240  : TimeFrame=PERIOD_H4;  break;
   case 1440 : TimeFrame=PERIOD_D1;  break;
   case 7200 : TimeFrame=PERIOD_W1;  break;
   case 28800: TimeFrame=PERIOD_MN1; break;
   default  : TimeFrame=Period();   break;
   }
return(0);
}

int start()
{
   datetime TimeArray[];
   int i=0,y=0;
   int counted_bars=IndicatorCounted();
   double LowArray[],HighArray[];


      if (TimeFrame<Period())
      {
      SetIndexDrawBegin(0,Bars);
      SetIndexDrawBegin(1,Bars);
      Comment("Incorrect TimeFrame");
      return(0);
      }

   if ( counted_bars > 0 )  int limit=Bars-counted_bars;
   if ( counted_bars < 0 )  return(0);
   if ( counted_bars ==0 )  limit=Bars-1;

   ArrayCopySeries(TimeArray,MODE_TIME,Symbol(),TimeFrame);
   ArrayCopySeries(LowArray,MODE_LOW,Symbol(),TimeFrame);
   ArrayCopySeries(HighArray,MODE_HIGH,Symbol(),TimeFrame);

      for(i=0,y=0;i<Bars;i++)
      {
      if (Time[i]<TimeArray[y]) y++;
      UpBuffer[i]=HighArray[y];
      DnBuffer[i]=LowArray[y];
      }
   return(0);
}
Comments