RAVI FX Fisher_v2
Download script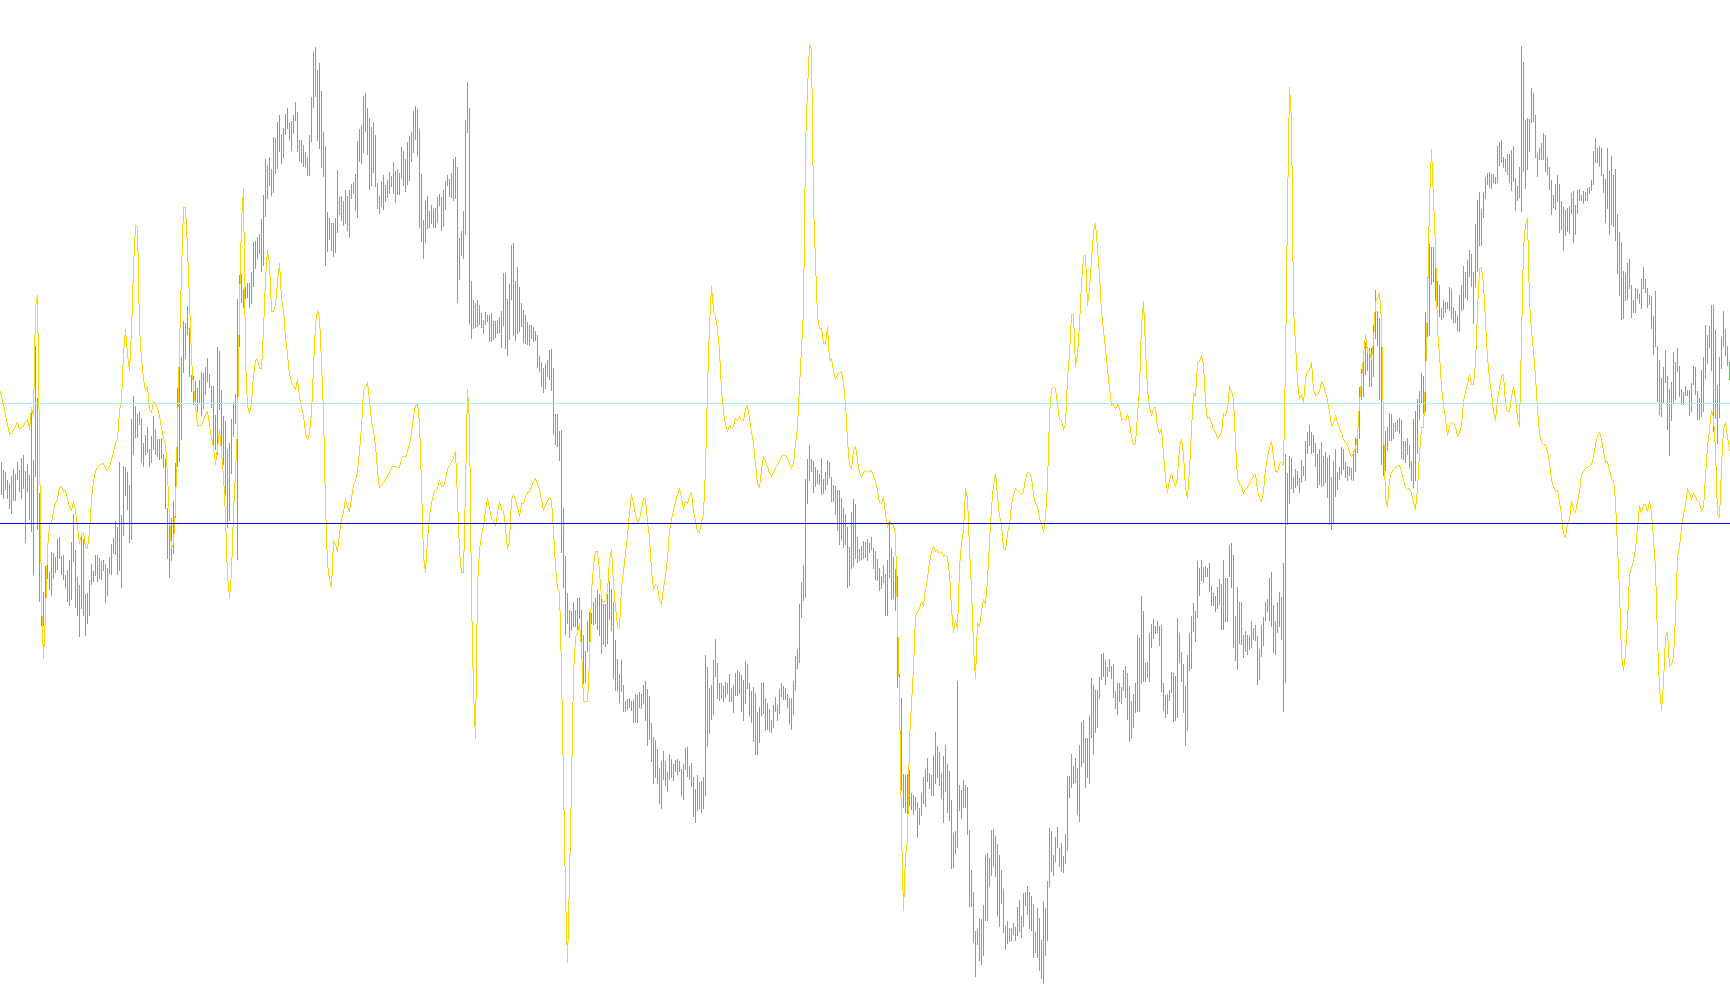
The RAVI FX Fisher is a technical analysis tool designed to help traders visualize market momentum and price fluctuations. Unlike standard indicators that might simply show you the direction of price, this script transforms complex volatility data into a normalized "oscillator" format, making it easier to identify overextended moves or potential trend shifts at a glance.
How the Logic Works
The indicator functions by processing three main types of market data: moving averages, average true range (volatility), and exponential scaling. Here is the step-by-step breakdown of how it arrives at its visual output:
1. Measuring Momentum Distance The script begins by comparing two different moving averages—a "fast" one that reacts quickly to price changes and a "slow" one that tracks the broader trend. By calculating the difference between these two, the tool determines the current strength of the trend.
2. Adjusting for Volatility To ensure the data isn't skewed by sudden, erratic price spikes, the script incorporates an Average True Range (ATR) calculation. This acts as a stabilizer; it adjusts the momentum reading based on how much the market is currently "swinging." This allows the indicator to remain consistent whether the market is in a quiet period or a high-intensity news event.
3. Normalizing the Signal The raw data gathered from the steps above can often result in large, unmanageable numbers. To fix this, the script applies an exponential mathematical formula (a hyperbolic tangent function). This compresses all the complex calculations into a specific range. This transformation creates a smooth wave that is much easier for a human trader to read on a chart.
Visual Interpretation
On your trading platform, the logic produces three distinct elements:
- The Primary Wave: This is the main line you will see moving across the indicator window. It represents the smoothed momentum of the asset. When the line moves upward significantly, it indicates strong bullish momentum; when it moves downward, it signals bearish momentum.
- Upper and Lower Boundaries (Triggers): The script automatically plots two horizontal boundary lines at fixed levels. These act as "thresholds."
- When the primary wave pushes toward or exceeds the Upper Trigger, it suggests the current move may be reaching an extreme point.
- When the wave pushes toward or exceeds the Lower Trigger, it signals that the downward pressure may be reaching a peak.
By observing where the main wave interacts with these trigger boundaries, traders can better identify potential turning points in the market cycle without being distracted by the "noise" of constant price fluctuations.
//+------------------------------------------------------------------+
//|                                               RAVI FX Fisher.mq4 |
//|                         Copyright © 2005, Luis Guilherme Damiani |
//|                                      http://www.damianifx.com.br |
//+------------------------------------------------------------------+
#property copyright "Copyright © 2005, Luis Guilherme Damiani"
#property link      "http://www.damianifx.com.br"

#property indicator_separate_window
#property indicator_buffers 3
#property indicator_color1 MediumSeaGreen
#property indicator_color2 MediumVioletRed
#property indicator_color3 MediumVioletRed
//---- input parameters
extern int       MAfast=4;
extern int       MAslow=49;
extern double trigger=0.09;
extern int       maxbars=5000;

//---- buffers
double RAVIfxFishBuffer[];
double LoTrigBuff[];
double HiTrigBuff[];
//+------------------------------------------------------------------+
//| Custom indicator initialization function                         |
//+------------------------------------------------------------------+
int init()
  {
//---- indicators
   SetIndexStyle(0,DRAW_LINE);
   SetIndexBuffer(0,RAVIfxFishBuffer);
   SetIndexStyle(1,DRAW_LINE);
   SetIndexBuffer(1,LoTrigBuff);
   SetIndexStyle(2,DRAW_LINE);
   SetIndexBuffer(2,HiTrigBuff);
//----
   return(0);
  }
//+------------------------------------------------------------------+
//| Custor indicator deinitialization function                       |
//+------------------------------------------------------------------+
int deinit()
  {
//----

//----
   return(0);
  }
//+------------------------------------------------------------------+
//| Custom indicator iteration function                              |
//+------------------------------------------------------------------+

int start()
  {
      int    counted_bars=IndicatorCounted();
      double MAValue=0;
      double IFish=0;
      //---- check for possible errors
      if(counted_bars<0) return(-1);
      int limit=Bars-counted_bars;
      if(limit>maxbars)limit=maxbars;
      if (limit>Bars-MAslow-1)limit=Bars-MAslow-1;
      //----
      for (int shift = 0; shift<=limit;shift++)
      {
	     //if period >70 then {LoTrigger=-0.15;HiTrigger=0.15;}else {LoTrigger=-0.07;HiTrigger=0.07;};

	     MAValue = 100 * (iMA(NULL,0,MAfast,0,MODE_LWMA,PRICE_TYPICAL,shift) - iMA(NULL,0,MAslow,0,MODE_LWMA,PRICE_TYPICAL,shift))*iATR(NULL,0,MAfast,shift)
	              /iMA(NULL,0,MAslow,0,MODE_LWMA,PRICE_TYPICAL,shift)/iATR(NULL,0,MAslow,shift);
	     IFish=(MathExp(2*MAValue)-1)/(MathExp(2*MAValue)+1);


         RAVIfxFishBuffer[shift]=IFish;
         LoTrigBuff[shift]=-trigger;
         HiTrigBuff[shift]=trigger;
       }

//----
   return(0);
  }
//+------------------------------------------------------------------+
Comments