Parabolic SAR Color - Alerts
Download script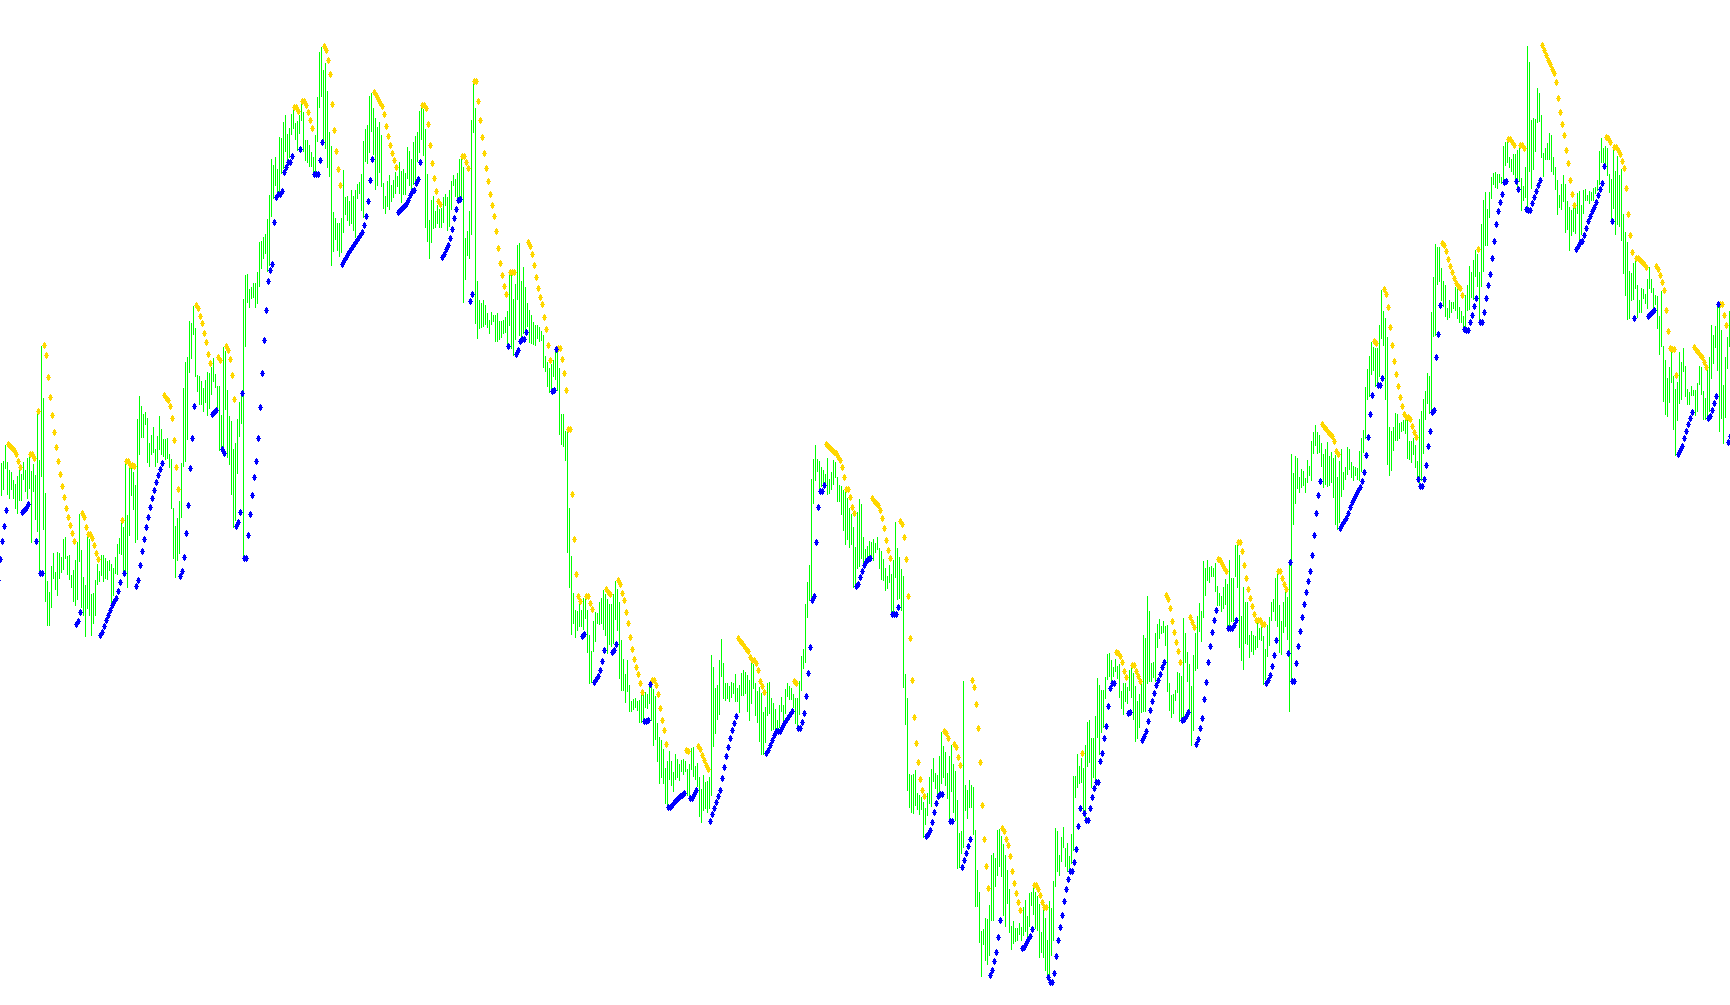
This custom indicator is designed to enhance the visual representation of the Parabolic SAR (Stop and Reverse) tool on your trading charts. It simplifies market analysis by providing clear, color-coded signals that help identify potential trend shifts in real-time.
Core Functionality
The primary objective of this script is to differentiate between upward and downward market movements using two distinct colors. Instead of viewing a standard single-colored indicator, this tool separates the Parabolic SAR values into two separate "channels" based on their position relative to the price action:
- Upward Trend (Magenta): When the indicator detects that the Parabolic SAR is positioned above the current high of the price bar, it highlights this as an upward trend signal.
- Downward Trend (Yellow): When the indicator detects that the Parabolic SAR has moved below the high of the price bar, it switches the signal to a downward trend.
Key Features & Logic
- Dynamic Visual Tracking: The script continuously monitors the relationship between the "Step" and "Maximum" variables—standard parameters for Parabolic SAR—and compares them against live market highs. It then paints the corresponding dots on your chart in either Magenta or Yellow.
- Real-Time Notifications: Beyond visual aids, the tool includes a comprehensive alert system. If enabled by the user, the script will monitor for trend "flips." When the Parabolic SAR switches from an upward to a downward position (or vice versa), the system can automatically trigger:
- On-Screen Alerts: Instant pop-up notifications on your trading platform.
- Email Notifications: Direct messages sent to your registered email address, ensuring you stay informed of trend changes even when you are away from your terminal.
- Smart Filtering: The logic is designed to ensure that alerts are only triggered once per trend shift, preventing the system from sending multiple repetitive notifications for the same move.
User Experience
For the trader, this tool provides a cleaner, more intuitive way to read market momentum. By translating the technical calculations of the Parabolic SAR into a two-color visual system, it allows for quicker identification of trend reversals and provides a systematic way to stay updated on price movement through automated alerts.
//+------------------------------------------------------------------+
//|                                                    SAR_COLOR.mq4 |
//|                                                          Kalenzo |
//|                                       http://www.foreksik.prv.pl |
//+------------------------------------------------------------------+
#property copyright "Kalenzo"
#property link      "http://www.foreksik.prv.pl"

#property indicator_color1 Magenta
#property indicator_color2 Yellow
#property indicator_chart_window
#property indicator_buffers 2
#property indicator_width1 2
#property indicator_width2 2

double sarUp[],sarDn[];//buffers
extern bool AlertsEnabled=false;
extern double Step = 0.04;//was .01
extern double Maximum = 0.5;
extern int Precision = 7;
double alertBar;

//+------------------------------------------------------------------+
//| Custom indicator initialization function                         |
//+------------------------------------------------------------------+
int init()
  {
//---- indicators
   SetIndexStyle(0,DRAW_ARROW,STYLE_DOT);
   SetIndexStyle(1,DRAW_ARROW,STYLE_DOT);
   SetIndexBuffer(0,sarUp);
   SetIndexBuffer(1,sarDn);
   SetIndexArrow(0,115);
   SetIndexArrow(1,115);

   IndicatorShortName("SAR COLORED");
   SetIndexLabel(0,"SAR Up Channel");
   SetIndexLabel(1,"SAR Down Channel");

   SetIndexDrawBegin(0,2);
   SetIndexDrawBegin(1,2);
//----
   return(0);
  }
//+------------------------------------------------------------------+
//| Custor indicator deinitialization function                       |
//+------------------------------------------------------------------+
int deinit()
  {
//----

//----
   return(0);
  }
//+------------------------------------------------------------------+
//| Custom indicator iteration function                              |
//+------------------------------------------------------------------+
int start()
  {

   int limit;
   int counted_bars=IndicatorCounted();
   if(counted_bars<0) counted_bars=0;
   if(counted_bars>0) counted_bars--;
   limit=Bars-counted_bars;
//----
  for(int i = 0; i<limit ;i++)
   {
      double sar = NormalizeDouble(iSAR(Symbol(),0,Step,Maximum,i),Precision);
          if(sar >= iHigh(Symbol(),0,i))
      {
       if(AlertsEnabled==true && sarUp[i] == 0 && Bars>alertBar)
        {
        Alert("Parabolic SAR Going Down on ",Symbol(),"-",Period());
        SendMail("PSAR","Parabolic SAR Going Down on "+Symbol()+"-"+Period());
        alertBar = Bars;
       }
         sarUp[i] = sar;
         sarDn[i] = 0;
      }
    else
      {
       if(AlertsEnabled==true && sarDn[i] == 0 && Bars>alertBar)
        {
        Alert("Parabolic SAR Channel Going Up on ",Symbol(),"-",Period());
        SendMail("PSAR","Parabolic SAR Channel Going Up on "+Symbol()+"-"+Period());

        alertBar = Bars;
        }
         sarUp[i] = 0;
         sarDn[i] = sar;
       }
   }
 //----
   return(0);
  }
//+------------------------------------------------------------------+
Comments