P-Monthly
Download script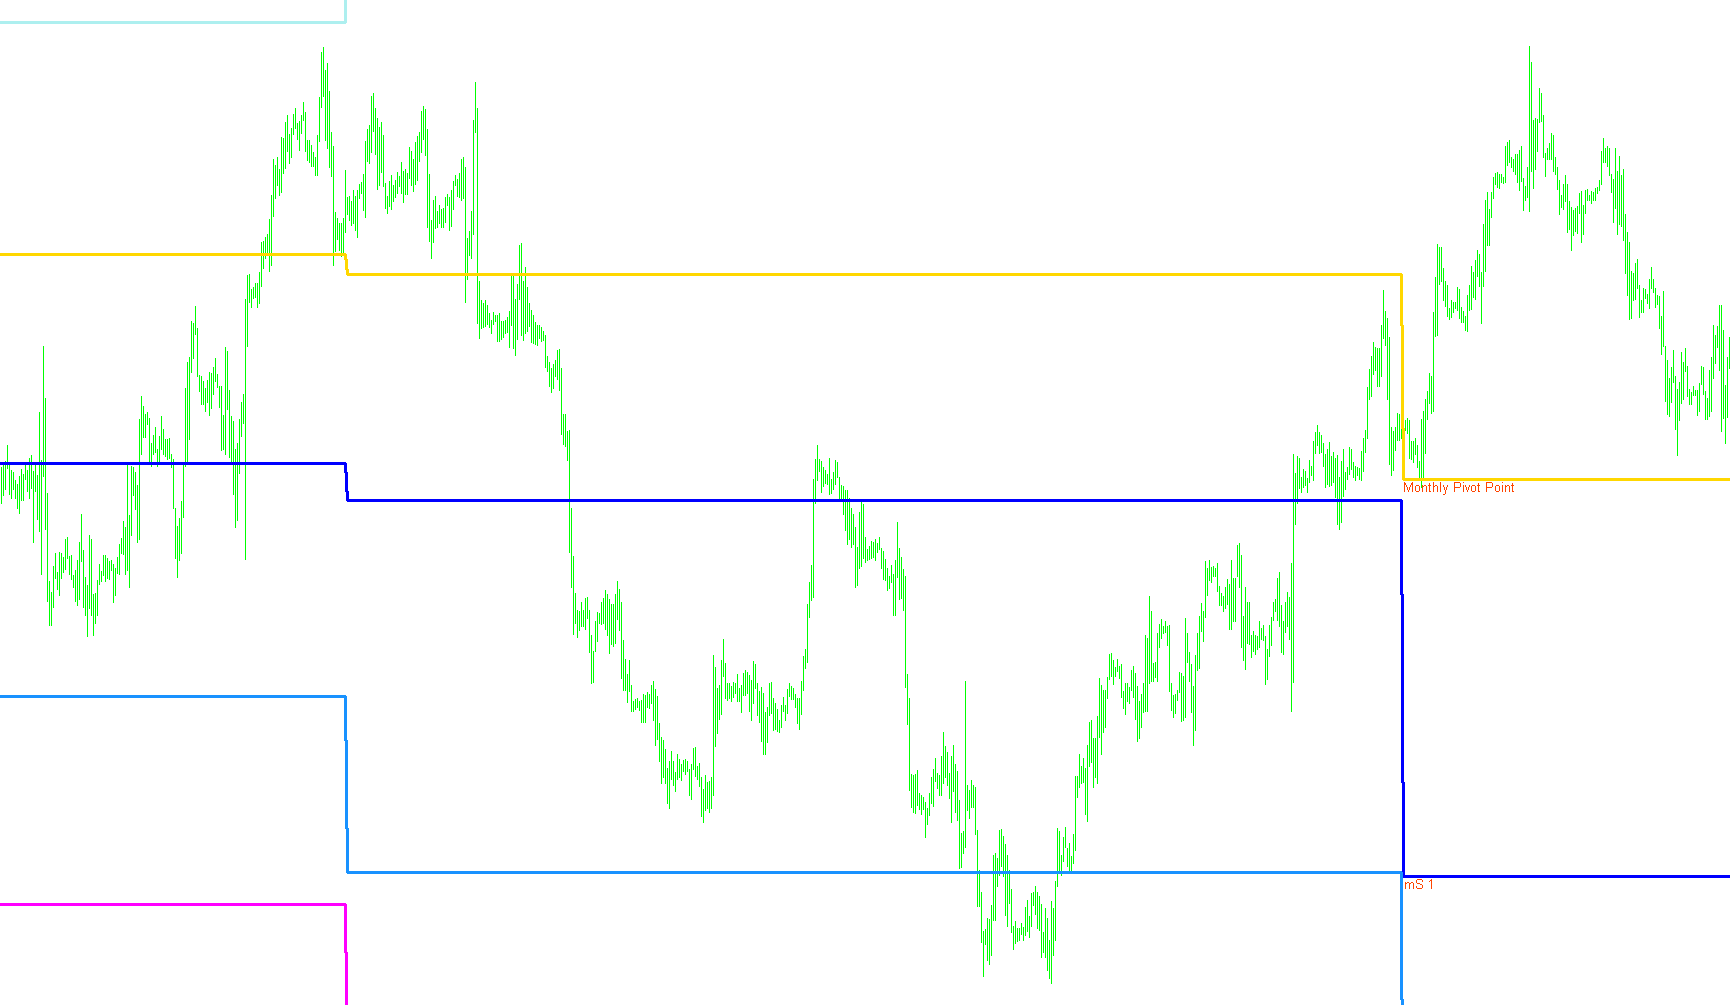
This tool is designed to provide traders with a clear visual roadmap of price levels based on monthly market trends. It automatically calculates and plots "Pivot Points," which are key psychological levels where the market often finds support (price floors) or resistance (price ceilings).
Core Functionality
The script analyzes historical price data to determine specific zones where price action might change direction. Instead of looking at short-term fluctuations, it focuses on monthly milestones to help traders identify significant trends on daily and lower timeframes.
Key Components
The tool identifies seven distinct price levels on your chart:
- Monthly Pivot Point: The central baseline for the month's price action.
- Support Levels (S1, S2, S3): These represent "floors." When the price drops toward these lines, it indicates areas where buyers might step in to prevent further decline.
- Resistance Levels (R1, R2, R3): These represent "ceilings." These are zones where sellers may become active, potentially pushing the price back down.
How the Logic Works
The script follows a specific mathematical logic to ensure these levels remain accurate:
- Monthly Transition Detection: The tool monitors the calendar. When it detects the transition from one month to the next (specifically during the first few days of the month), it captures the high, low, and closing prices of the previous month.
- Dynamic Calculation: It uses these monthly extremes—combined with the opening price of the current month—to calculate the pivot points.
- The Primary Pivot is derived from a balanced average of the previous month's movement and the current month's start.
- Secondary Levels (R1-R3 and S1-S3) are then projected outward based on the volatility (the difference between the high and low) of the preceding month.
- Continuous Tracking: As the new month progresses, the tool tracks the highest and lowest prices reached so far. This ensures that the calculated levels remain relevant and adjusted to the current month's price range.
User Experience
- Visual Labels: The script places clear text labels on the chart (e.g., "mS 1", "mR 2") so you can easily identify each zone at a glance.
- Timeframe Compatibility: To maintain accuracy, the script is optimized for use on intraday charts (lower than the Daily timeframe). It will not display if applied to higher monthly charts to prevent data distortion.
- Automation: The tool automatically updates these lines as new price data arrives, removing the need for manual calculations by the trader.
Miscellaneous
13
Views
0
Downloads
0
Favorites
P-Monthly
//+------------------------------------------------------------------+
//|                                                    Monthly Pivot |
//|                                    Copyright © 2006, Profitrader |
//|                                    Coded/Verified by Profitrader |
//+------------------------------------------------------------------+
#property copyright "Copyright © 2006, Profitrader."
#property link      "profitrader@inbox.ru"

#property indicator_chart_window
#property indicator_buffers 7
#property indicator_color1 Yellow
#property indicator_color2 Blue
#property indicator_color3 OrangeRed
#property indicator_color4 MediumBlue
#property indicator_color5 Red
#property indicator_color6 MidnightBlue
#property indicator_color7 Crimson
//---- buffers
double PBuffer[];
double S1Buffer[];
double R1Buffer[];
double S2Buffer[];
double R2Buffer[];
double S3Buffer[];
double R3Buffer[];

double P,S1,R1,S2,R2,S3,R3,last_month_high,last_month_low,last_month_close,this_month_open;
//+------------------------------------------------------------------+
//| Custom indicator initialization function                         |
//+------------------------------------------------------------------+
int init()
  {
   SetIndexBuffer(0,PBuffer);
   SetIndexBuffer(1,S1Buffer);
   SetIndexBuffer(2,R1Buffer);
   SetIndexBuffer(3,S2Buffer);
   SetIndexBuffer(4,R2Buffer);
   SetIndexBuffer(5,S3Buffer);
   SetIndexBuffer(6,R3Buffer);
   SetIndexStyle(0,DRAW_LINE,0,3);
   SetIndexStyle(1,DRAW_LINE,0,3);
   SetIndexStyle(2,DRAW_LINE,0,3);
   SetIndexStyle(3,DRAW_LINE,0,3);
   SetIndexStyle(4,DRAW_LINE,0,3);
   SetIndexStyle(5,DRAW_LINE,0,3);
   SetIndexStyle(6,DRAW_LINE,0,3);
   SetIndexLabel(0,"Monthly Pivot Point");
   SetIndexLabel(1,"Monthly Support 1");
   SetIndexLabel(2,"Monthly Resistant 1");
   SetIndexLabel(3,"Monthly Support 2");
   SetIndexLabel(4,"Monthly Resistant 2");
   SetIndexLabel(5,"Monthly Support 3");
   SetIndexLabel(6,"Monthly Resistant 3");
   return(0);
  }
//+------------------------------------------------------------------+
//| Custor indicator deinitialization function                       |
//+------------------------------------------------------------------+
int deinit()
  {
   ObjectDelete("Monthly Pivot");
   ObjectDelete("Monthly Sup1");
   ObjectDelete("Monthly Res1");
   ObjectDelete("Monthly Sup2");
   ObjectDelete("Monthly Res2");
   ObjectDelete("Monthly Sup3");
   ObjectDelete("Monthly Res3");
   return(0);
  }
//+------------------------------------------------------------------+
//| Custom indicator iteration function                              |
//+------------------------------------------------------------------+
int start()
  {
   int i,counted_bars=IndicatorCounted();
//---- check for possible errors
   if(counted_bars<0) return(-1);
//---- last counted bar will be recounted
   if(counted_bars>0) counted_bars--;
   int limit=Bars-counted_bars;

   if(Period()>PERIOD_D1) return(-1);
   if(counted_bars==0)
     {
      ObjectCreate("Monthly Pivot",OBJ_TEXT,0,0,0);
      ObjectSetText("Monthly Pivot","                            Monthly Pivot Point",10,"Arial",OrangeRed);
      ObjectCreate("Monthly Sup1",OBJ_TEXT,0,0,0);
      ObjectSetText("Monthly Sup1","        mS 1",10,"Arial",OrangeRed);
      ObjectCreate("Monthly Res1",OBJ_TEXT,0,0,0);
      ObjectSetText("Monthly Res1","        mR 1",10,"Arial",OrangeRed);
      ObjectCreate("Monthly Sup2",OBJ_TEXT,0,0,0);
      ObjectSetText("Monthly Sup2","        mS 2",10,"Arial",OrangeRed);
      ObjectCreate("Monthly Res2",OBJ_TEXT,0,0,0);
      ObjectSetText("Monthly Res2","        mR 2",10,"Arial",OrangeRed);
      ObjectCreate("Monthly Sup3",OBJ_TEXT,0,0,0);
      ObjectSetText("Monthly Sup3","        mS 3",10,"Arial",OrangeRed);
      ObjectCreate("Monthly Res3",OBJ_TEXT,0,0,0);
      ObjectSetText("Monthly Res3","        mR 3",10,"Arial",OrangeRed);
     }
   for(i=limit-1; i>=0; i--)
      {
       // 1sts Days of Month
	    if(TimeDay(Time[i])<=3 && TimeDay(Time[i+1])>=26)
	      {
		    last_month_close=Close[i+1];
		    this_month_open=Open[i];
		    P=(last_month_high+last_month_low+last_month_close+this_month_open)/4;
          R1=(2*P)-last_month_low;
          S1=(2*P)-last_month_high;
          R2=P+(last_month_high-last_month_low);
          S2=P-(last_month_high-last_month_low);
          R3=(2*P)+(last_month_high-(2*last_month_low));
          S3=(2*P)-((2*last_month_high)-last_month_low);
        	 ObjectMove("Monthly Pivot",0,Time[i],P);
          ObjectMove("Monthly Sup1",0,Time[i],S1);
          ObjectMove("Monthly Res1",0,Time[i],R1);
          ObjectMove("Monthly Sup2",0,Time[i],S2);
          ObjectMove("Monthly Res2",0,Time[i],R2);
          ObjectMove("Monthly Sup3",0,Time[i],S3);
          ObjectMove("Monthly Res3",0,Time[i],R3);
          last_month_low=Low[i];
          last_month_high=High[i];
         }
       last_month_low=MathMin(last_month_low,Low[i]);
       last_month_high=MathMax(last_month_high,High[i]);
       PBuffer[i]=P;
       S1Buffer[i]=S1;
       R1Buffer[i]=R1;
       S2Buffer[i]=S2;
       R2Buffer[i]=R2;
       S3Buffer[i]=S3;
       R3Buffer[i]=R3;
      }
//----
   return(0);
  }
//+------------------------------------------------------------------+
Comments