OsMA_5_bar_rolling_0.4
Download script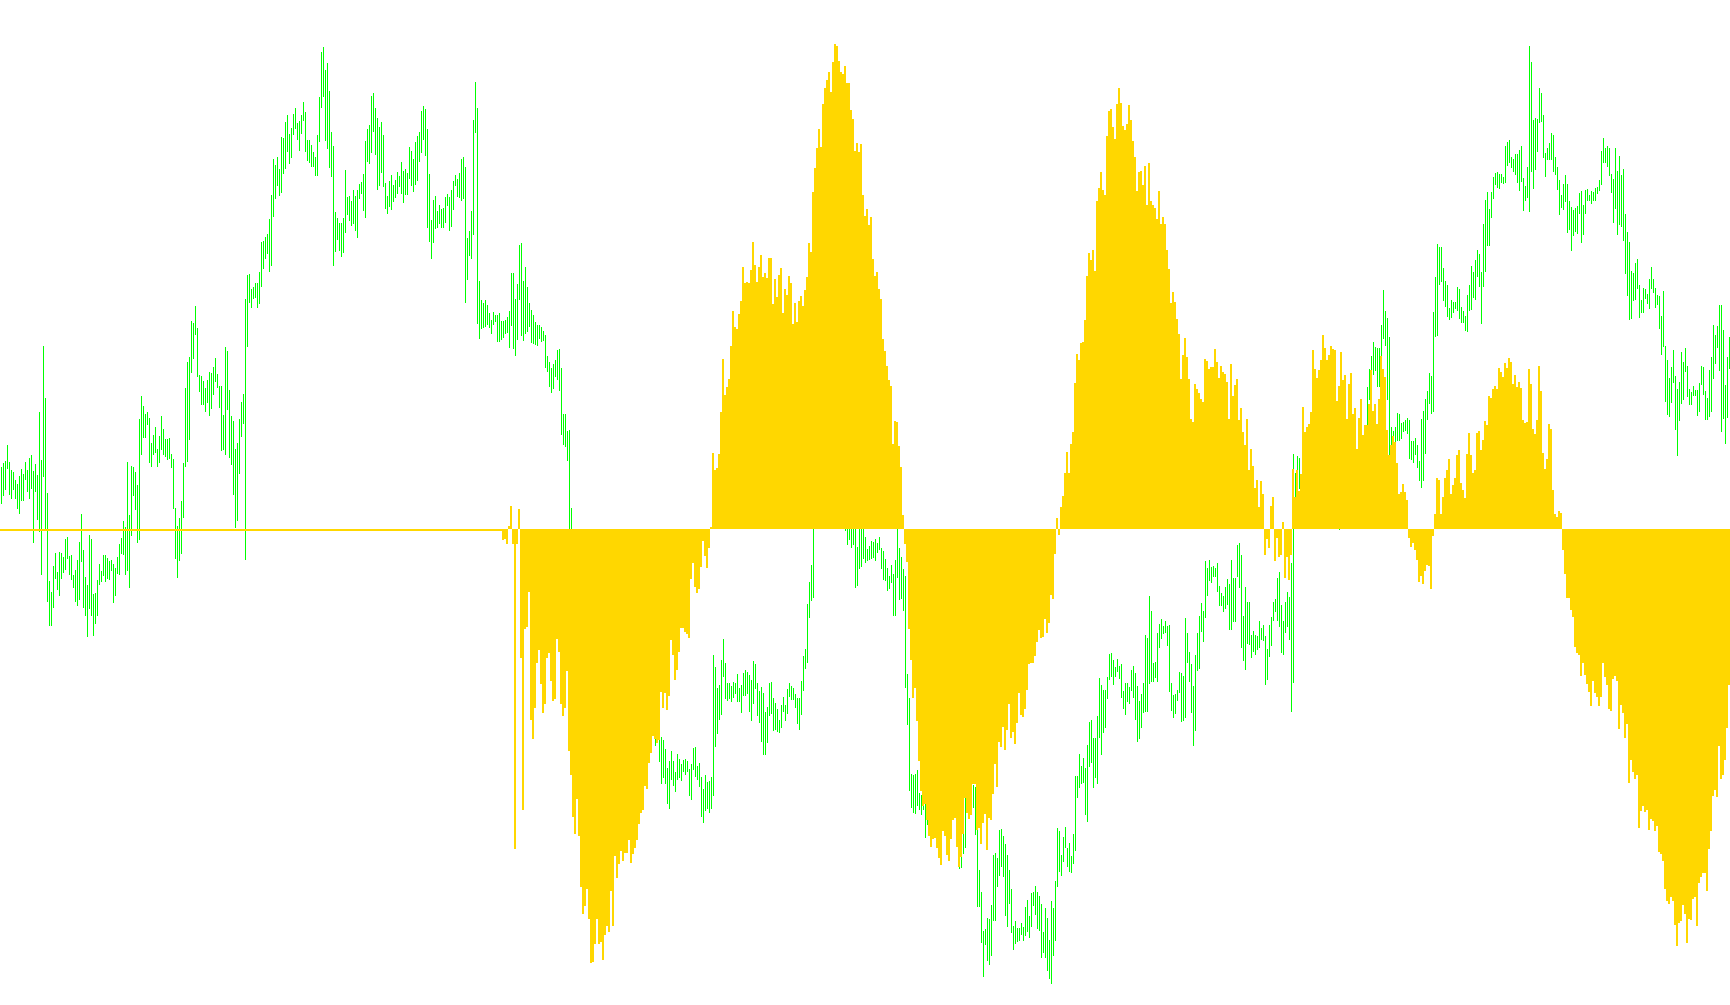
This script functions as a specialized technical analysis tool designed to smooth out market volatility by applying a unique "rolling" calculation to traditional momentum indicators. Instead of analyzing every single price movement in a standard linear fashion, this logic filters the data through several layers of mathematical processing to identify underlying trends.
The Core Methodology
The indicator operates through a multi-stage calculation process:
1. Data Filtering (The 5-Bar Grouping) The primary distinction of this tool is how it selects price data. Rather than looking at every consecutive price point, the logic captures every 5th closing price moving backward from the current moment. This effectively creates a "spaced-out" view of the market, helping to ignore minor price fluctuations (noise) and focus on broader movements.
2. Dual Exponential Smoothing (The MACD Foundation) Once the filtered price points are identified, the script applies two different types of Exponential Moving Averages (EMAs).
- One average is calculated quickly (Fast EMA).
- One average is calculated more slowly (Slow EMA). By comparing these two averages against each other, the tool determines the "Main Line" momentum—the gap between short-term price velocity and long-term trends.
3. Signal Averaging To ensure the data remains readable and less erratic, the script takes the results of the "Main Line" and runs them through a Simple Moving Average (SMA). This creates a secondary "Signal Line," which represents the average momentum over a specific window of time.
4. Final Output (The OSMA Calculation) The final value displayed on your chart is the difference between the Main Line and the Signal Line. In technical terms, this is known as an Oscillator (OSMA).
Visual Representation
The final result is presented as a histogram in a separate window below your price chart. By calculating the distance between the momentum of the current trend and its average signal, the tool provides a visual representation of whether the market's current strength is accelerating, decelerating, or shifting direction relative to its recent history.
/*-----------------------------+
|			       |
| Shared by www.Aptrafx.com    |
|			       |
+------------------------------*/

//+------------------------------------------------------------------+
//|                                                         OsMA.mq4 |
//|                      Copyright © 2004, MetaQuotes Software Corp. |
//|                                       http://www.metaquotes.net/ |
//+------------------------------------------------------------------+
#property  copyright "Copyright © 2004, MetaQuotes Software Corp."
#property  link      "http://www.metaquotes.net/"
//---- indicator settings
#property  indicator_separate_window
#property  indicator_buffers 1
#property  indicator_color1  Silver
//---- indicator parameters
extern int FastEMA=12;
extern int SlowEMA=26;
extern int SignalSMA=9;
//---- indicator buffers
double     ind_buffer1[];
double     ind_buffer2[];
double     ind_buffer3[];

//+------------------------------------------------------------------+
//| Custom indicator initialization function                         |
//+------------------------------------------------------------------+
int init()
  {
//---- 2 additional buffers are used for counting.
   IndicatorBuffers(3);
//---- drawing settings
   SetIndexStyle(0,DRAW_HISTOGRAM,STYLE_SOLID,3);
   SetIndexDrawBegin(0,SignalSMA);
   IndicatorDigits(MarketInfo(Symbol(),MODE_DIGITS)+2);
//---- 3 indicator buffers mapping
   if(!SetIndexBuffer(0,ind_buffer1) &&
      !SetIndexBuffer(1,ind_buffer2) &&
      !SetIndexBuffer(2,ind_buffer3))
      Print("cannot set indicator buffers!");
//---- name for DataWindow and indicator subwindow label
   IndicatorShortName("OsMA_5_bar_rolling ("+FastEMA+","+SlowEMA+","+SignalSMA+")");
//---- initialization done

   return(0);
  }
//+------------------------------------------------------------------+
//| Moving Average of Oscillator                                     |
//+------------------------------------------------------------------+
int start()
  {
   int limit;
   int counted_bars=IndicatorCounted();
//---- check for possible errors
   if(counted_bars<0) return(-1);
//---- last counted bar will be recounted
   if(counted_bars>0) counted_bars--;
   limit=Bars-counted_bars;
//---- macd counted in the 1-st additional buffer


   for(int i=0; i<limit; i++)
      {

      //------Get close prices 5-bar groups (i.e. close of every 5th bar going back from the bar the indicator is currently working on)
      double ClosePricesArray[];
      ArrayResize(ClosePricesArray,Bars-i);

      ClosePricesArray[0] = Close[i];
      int cnt=1;
      for(int CurrBar=i+5; CurrBar<=Bars-i-1; CurrBar=CurrBar+5)
         {
         ClosePricesArray[cnt]=Close[CurrBar];
         cnt++;
         }

      ArrayResize(ClosePricesArray,cnt);


      //------Calculate the first of two EMAs the MACD is based on
      double ExtMapBuffer[];
      ArrayResize(ExtMapBuffer,cnt);
      double pr=2.0/(FastEMA+1);
      int    pos=cnt-2;
      while(pos>=0)
        {
         if(pos==cnt-2) ExtMapBuffer[pos+1]=ClosePricesArray[pos+1];
         ExtMapBuffer[pos]=ClosePricesArray[pos]*pr+ExtMapBuffer[pos+1]*(1-pr);
         pos--;
        }


      //------Calculate the second of two EMAs the MACD is based on
      double ExtMapBuffer2[];
      ArrayResize(ExtMapBuffer2,cnt);
      pr=2.0/(SlowEMA+1);
      pos=cnt-2;
      while(pos>=0)
        {
         if(pos==cnt-2) ExtMapBuffer2[pos+1]=ClosePricesArray[pos+1];
         ExtMapBuffer2[pos]=ClosePricesArray[pos]*pr+ExtMapBuffer2[pos+1]*(1-pr);
         pos--;
        }


      //------Calculate the MACD main line, which is the difference of the two MACD EMAs
      double ExtMapBuffer3[];
      ArrayResize(ExtMapBuffer3,cnt);
      for(int cnt2=0; cnt2<cnt; cnt2++)
         {
         ExtMapBuffer3[cnt2]=ExtMapBuffer[cnt2]-ExtMapBuffer2[cnt2];
         }
      //------Calculate the MACD signal line value for the current bar, which is SMA9 of the MACD main line
      double MACDsignalline=0;

      for (cnt2=0;cnt2<SignalSMA;cnt2++)
         {
         MACDsignalline=MACDsignalline+ExtMapBuffer3[cnt2];
         }
      MACDsignalline=MACDsignalline/SignalSMA;


      //Assign the indicator value as the difference between the MACD main and signal lines (OSMA)
      ind_buffer1[i]=ExtMapBuffer3[0]-MACDsignalline;
      }


//---- done
   return(0);
  }
//+------------------------------------------------------------------+
Comments