Mint signal2.1_cl_2
Indicator

Mint signal2.1_cl_2

iCCIiMAiRSI

This indicator visualizes real-time trend alignment across six concurrent timeframes by evaluating the intersection of Exponential Moving Averages, Relative Strength Index, and Commodity Channel Index levels.

Mint signal2
Indicator

Mint signal2

iCCIiMAiRSI

This indicator visualizes bullish or bearish sentiment across five concurrent timeframes by evaluating the alignment of EMA crossovers, RSI levels, and CCI values.

Min_Max_RSI
Indicator

Min_Max_RSI

iRSI

The indicator identifies relative strength extremes by tracking the local highest and lowest RSI values independently above and below the 50.0 neutral midline.

MIR
Indicator

MIR

A high-fidelity digital signal processing filter that utilizes a weighted coefficient matrix to eliminate market noise while maintaining instantaneous price responsiveness.

MIR_2L
Indicator

MIR_2L

This indicator employs a multi-stage weighted coefficient matrix to isolate underlying price trends by suppressing high-frequency market noise.

MIR_osc2L
Indicator

MIR_osc2L

This indicator applies a multi-stage digital filtering algorithm to isolate underlying price trends by recursively suppressing market noise and extracting momentum derivatives.

MIR_osc3sl
Indicator

MIR_osc3sl

This indicator utilizes a multi-stage weighted coefficient matrix to suppress market noise while maintaining high-fidelity price tracking for trend identification.

mj_ADXFilter_v1.0
Indicator

mj_ADXFilter_v1.0

iADX

This indicator categorizes market movements into four distinct states by cross-referencing ADX strength thresholds with PlusDI and MinusDI directional polarities.

mj_CCIFilter_v1.0
Indicator

mj_CCIFilter_v1.0

iCCI

This indicator categorizes market sentiment into four distinct states—Strong Bullish, Mild Bullish, Mild Bearish, and Strong Bearish—based on the relative position of the CCI value across zero and fifty thresholds.

mj_RSIFilter_v1.0
Indicator

mj_RSIFilter_v1.0

iRSI

This indicator categorizes market momentum into four distinct intensity zones—Strong Bullish, Mild Bullish, Mild Bearish, and Strong Bearish—by segmenting the Relative Strength Index into specific threshold bands.

MktOpen
Indicator

MktOpen

Visualizes major global financial market open and close times on the chart using dynamic vertical markers and preemptive countdown indicators.

mlp_
Indicator

mlp_

This script dynamically generates and visualizes the structural weight matrices between input layers, hidden neurons, and output nodes of a Multilayer Perceptron.

Indicator

MLP_cannonball

MLP_cannonball3
Indicator

MLP_cannonball3

This script implements a Multi-Layer Perceptron (MLP) utilizing stochastic gradient descent and backpropagation to approximate projectile motion trajectories based on initial velocity and angular inputs.

MLP_cannonball4
Indicator

MLP_cannonball4

This script utilizes a Multi-Layer Perceptron with backpropagation and sigmoid activation to regress ballistic coordinates based on initial velocity and angular trajectories.

MLP_cannonball5
Indicator

MLP_cannonball5

This script employs a Multi-Layer Perceptron neural network to solve nonlinear regression by mapping initial projectile velocity and launch angles to spatial coordinates.

MLP_cannonball6
Indicator

MLP_cannonball6

This script utilizes a Multi-Layer Perceptron neural network to solve a regression problem by estimating the spatial coordinates of a projectile based on initial velocity and angular input.

MLP_cannonball7
Indicator

MLP_cannonball7

This script implements a Multi-Layer Perceptron neural network using backpropagation to predict ballistic trajectory coordinates based on initial velocity and launch angles.

MLP_cannonball8
Indicator

MLP_cannonball8

This script implements a Multi Layer Perceptron (MLP) using back-propagation to regress and predict ballistic projectile coordinates based on initial velocity and launch angles.

MLP_xor
Indicator

MLP_xor

This script implements a synthetic neural network utilizing backpropagation and tanh activation functions to classify non-linearly separable logic patterns.

MLS-HL4-Angle
Indicator

MLS-HL4-Angle

This indicator utilizes the Method of Least Squares to calculate the linear regression slope based on high and low price points, identifying steady trend strength by measuring the tangent angle relative to a horizontal axis.

MLSOnGraphics
Indicator

MLSOnGraphics

This indicator utilizes the Method of Least Squares to project high and low price boundaries while quantifying market volatility by calculating the standard deviation of price deflection from the linear trend.

MMA color
Indicator

MMA color

iMA

This indicator calculates the difference between two moving averages at offset intervals and visualizes the momentum direction through color-coded histogram bars based on sensitivity-adjusted price trends.

MMA
Indicator

MMA

This indicator calculates a dynamic moving average by applying a polynomial driving function to price-to-noise errors while simultaneously utilizing a gradient-based damping mechanism to suppress overshoot and erratic spikes.

MMLevls_VG(1)
Indicator

MMLevls_VG(1)

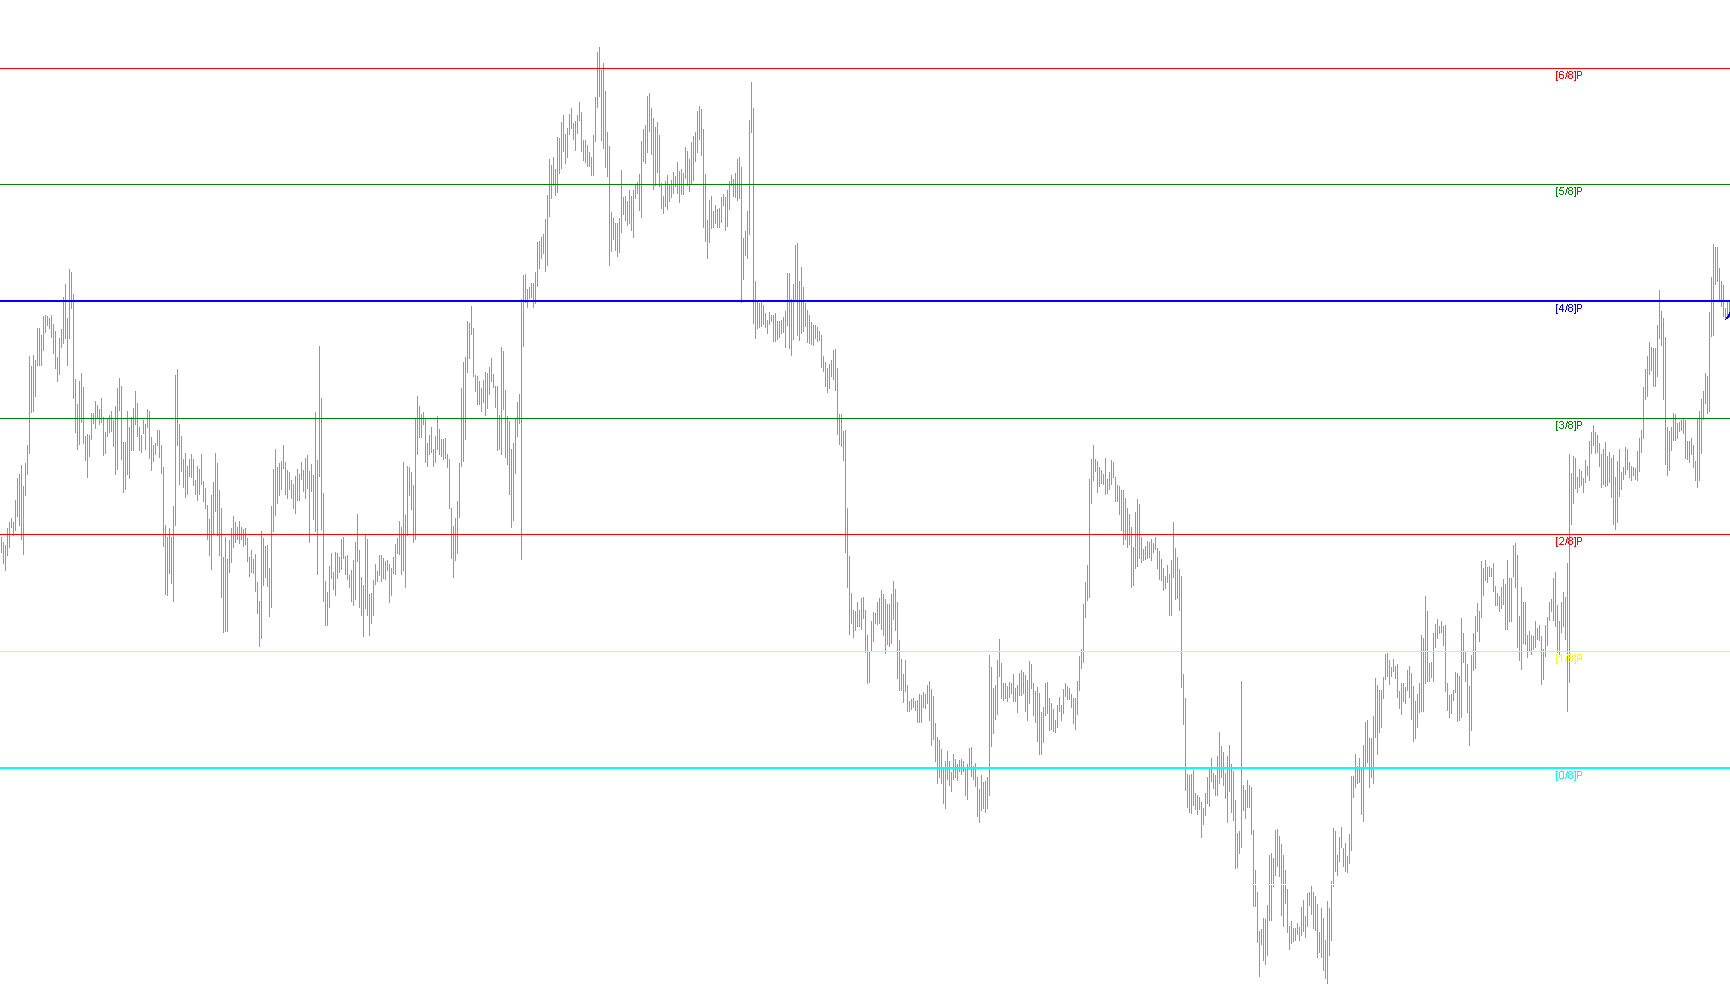
The indicator calculates dynamic horizontal support and resistance zones by mapping fractal-based price ranges into an eight-octave harmonic scale.

MMLevls_VG
Indicator

MMLevls_VG

This indicator identifies dynamic support and resistance zones by applying a fractal-based logarithmic scale to historical price ranges, dividing the market into eight distinct volatility octaves.

MMPrice THV
Indicator

MMPrice THV

This indicator projects a high-visibility real-time price label on the chart that dynamically shifts color based on immediate upward or downward price momentum.

MMPrice THV_v1
Indicator

MMPrice THV_v1

This indicator renders a real-time floating price label on the chart that dynamically shifts color between green and red based on immediate bid price momentum.

mNLMAv6
Indicator

mNLMAv6

iMA

Utilizes a cosine-weighted recursive smoothing algorithm to eliminate price lag while identifying directional trend shifts via dynamic buffer transitions.

ModifiedOptimumEllipticFilter
Indicator

ModifiedOptimumEllipticFilter

This indicator utilizes a recursive mathematical formula to isolate price trends from market noise by calculating a weighted average of median price points through an elliptic filter.

Indicator

MODIFIED_VERSION_ttm-trend-3

modifiyHigh_Low v2 (ZigZag)
Indicator

modifiyHigh_Low v2 (ZigZag)

This indicator identifies and plots structural pivot points by detecting consecutive local maxima and minima to map price extremes.

Modify All
Indicator

Modify All

Iterates through open positions to automatically append hard stop-loss and take-profit levels to any pending or active trades lacking defined exit parameters.

Modify Position
Indicator

Modify Position

This script iterates through active market positions to synchronize their exit parameters by pulling dynamic stop-loss and take-profit values from global memory.

modify
Indicator

modify

This script iterates through active market positions to automatically inject a fixed-point stop-loss buffer based on current bid/ask dynamics.

ModifyOrder
Indicator

ModifyOrder

A graphical tool that allows users to modify pending orders and active positions by dragging visual price lines on the chart to set Stop Loss, Take Profit, and Expiration parameters.

modify_pending
Indicator

modify_pending

This script identifies the first non-market order in the terminal and shifts its entry price downward by 10 points.

Modify_pending_v1
Indicator

Modify_pending_v1

This script iterates through active trades to identify and automatically shift the entry price of the first encountered non-market pending order downward by ten points.

modify_profit_target
Indicator

modify_profit_target

Iterates through active positions to recalculate and update profit targets based on a fixed pip distance relative to the original execution price.

modify_stops_DragDrop
Indicator

modify_stops_DragDrop

Automatically aligns active and pending order prices to a user-defined drop point while enforcing directional price boundaries.

modify_stop_loss
Indicator

modify_stop_loss

Iterates through active market positions to recalculate and reposition stop-loss levels based on a fixed pip offset from the original entry price.

modify_take_profits_DragDrop
Indicator

modify_take_profits_DragDrop

This script automatically updates the Stop Loss of open and pending orders to the price level where the user manually drops a cursor on the chart.

Modify_v1
Indicator

Modify_v1

This script iterates through active marketplace positions to automatically synchronize specific profit targets and risk thresholds based on predefined symbol and order type filters.

Modify_v2
Indicator

Modify_v2

Automatically identifies the first active market position and applies a fixed 20-point stop loss relative to the current bid or ask price.

ModiSimple
Indicator

ModiSimple

iATRiMACDiMAiRSI

This indicator synthesizes RSI acceleration, MACD trend dynamics, and multi-mode ATR-based trailing stops to identify high-probability trend reversals and automated risk management.

Mom Cross
Indicator

Mom Cross

iMomentum

This indicator identifies trend shifts by calculating and plotting the intersection of two distinct momentum periods to highlight acceleration changes.

MOM-TC_NEW
Indicator

MOM-TC_NEW

iMomentum

This indicator identifies trend reversals by monitoring price velocity relative to a fixed 100-point threshold, generating visual signals and alerts upon direction flips.

MOM-TC_v2
Indicator

MOM-TC_v2

iMomentum

This indicator identifies directional shifts by monitoring momentum breaches relative to a fixed level, generating visual signals and alerts upon trend reversals.

MOM-TC_v2m
Indicator

MOM-TC_v2m

iMomentum

This indicator identifies directional momentum shifts and trend polarity by monitoring price velocity relative to specific overbought and oversold threshold crossovers.

MOM-TC_v2m_001
Indicator

MOM-TC_v2m_001

iMomentum

This indicator tracks momentum velocity to identify trend shifts and provides real-time alerts when price momentum breaches specific overbought, oversold, or neutral equilibrium thresholds.