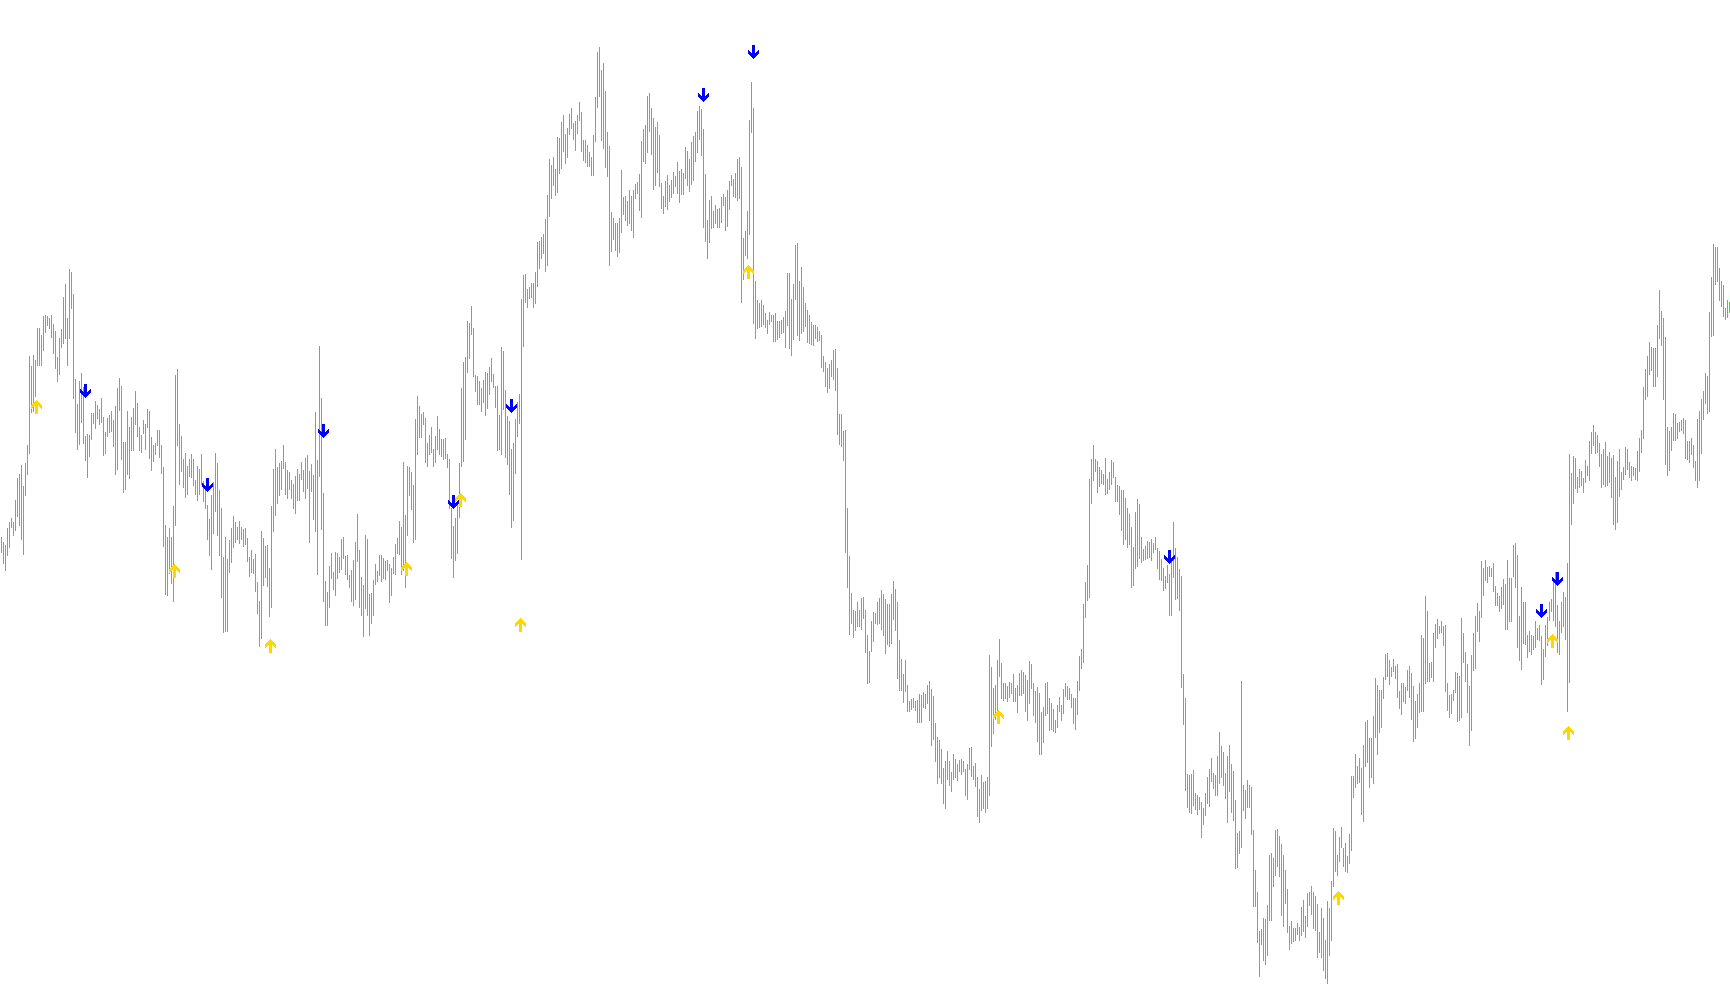
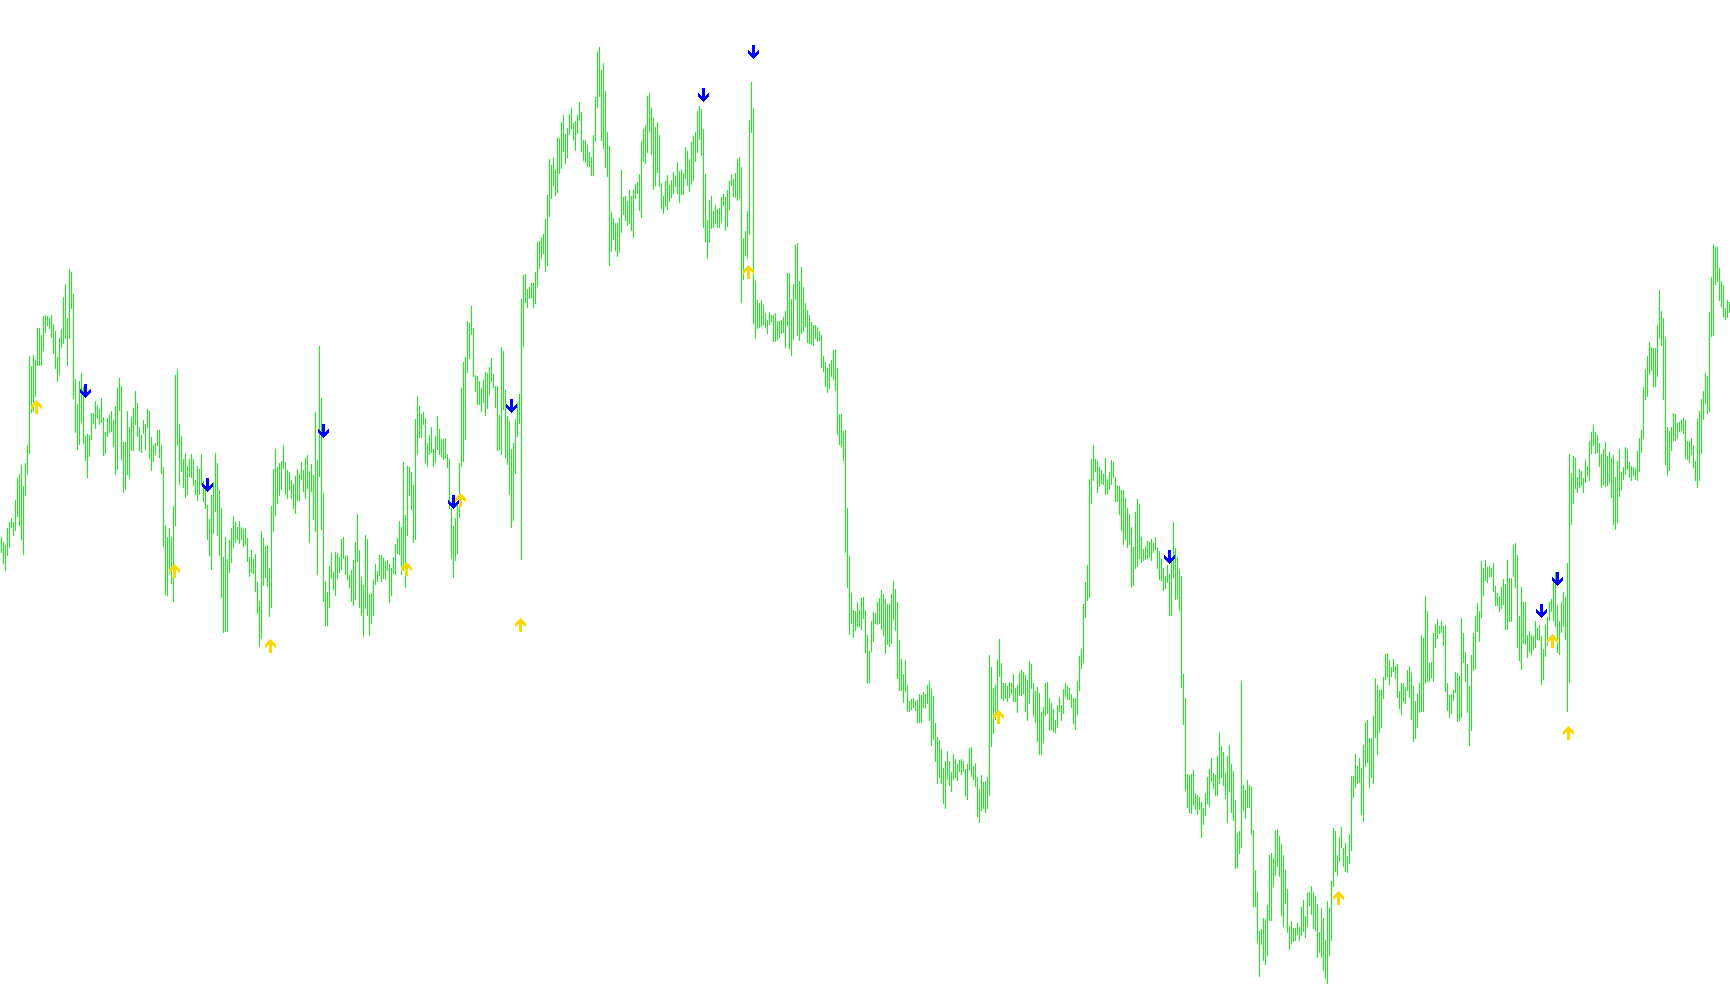
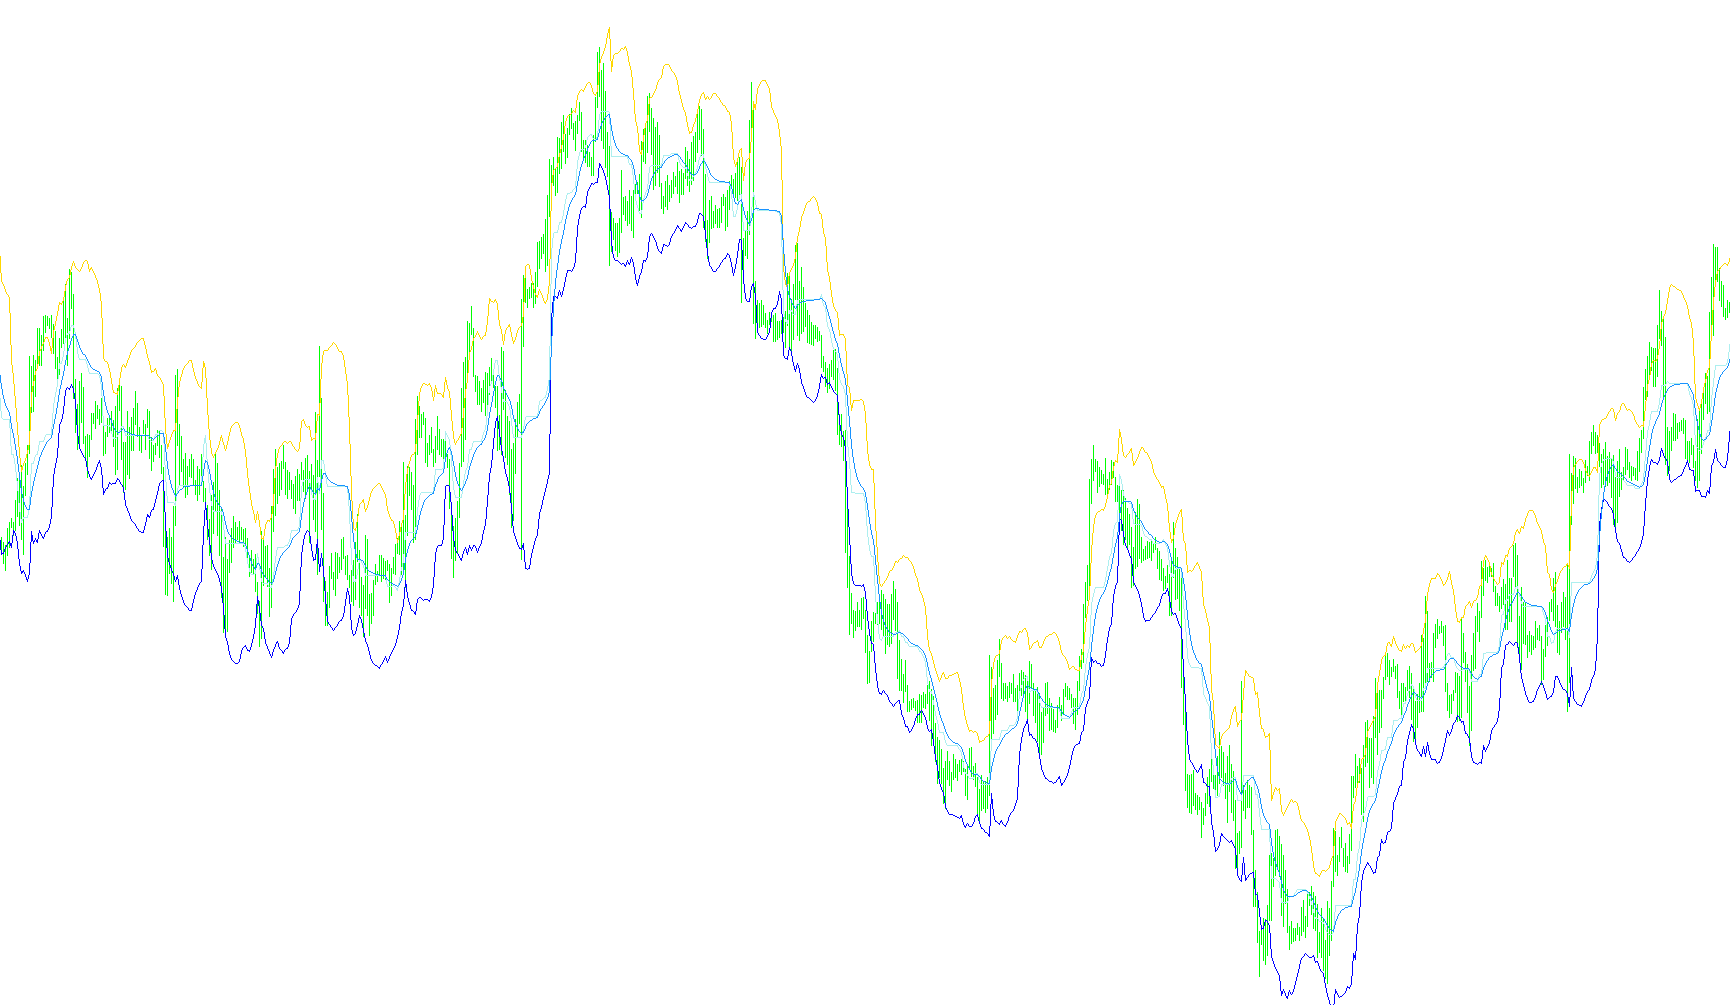
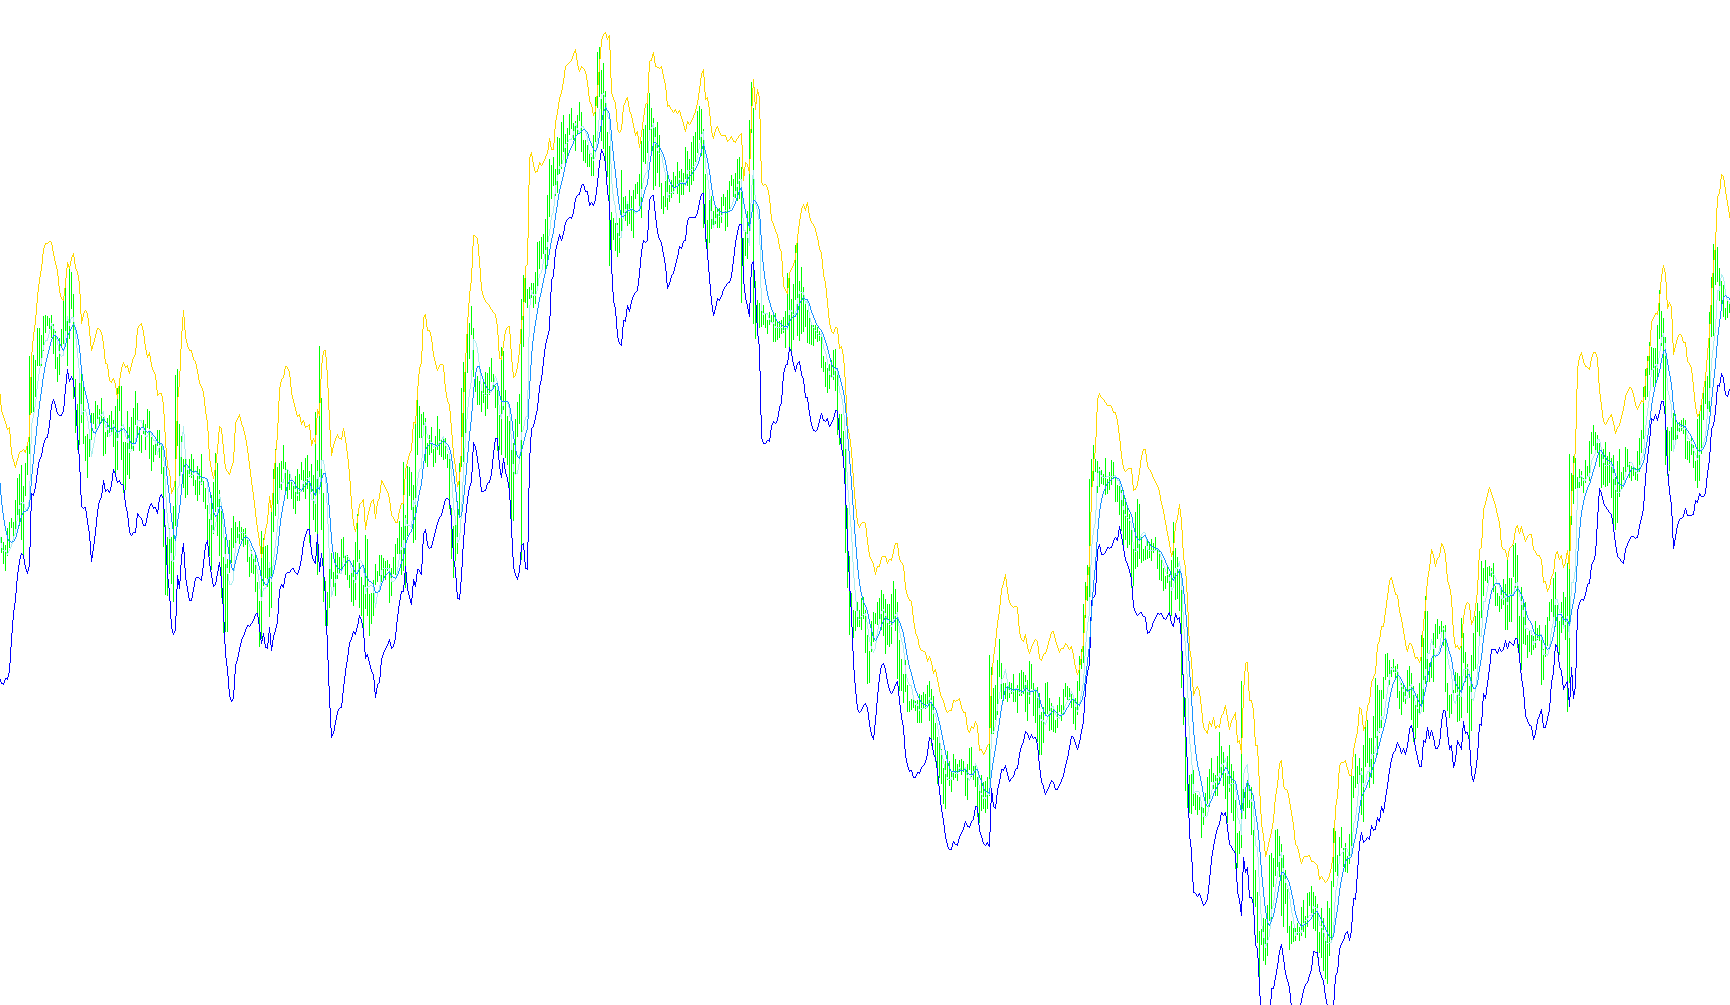
MBKAsctrend3times_v1
Indicator

MBKAsctrend3times_v1

iWPR

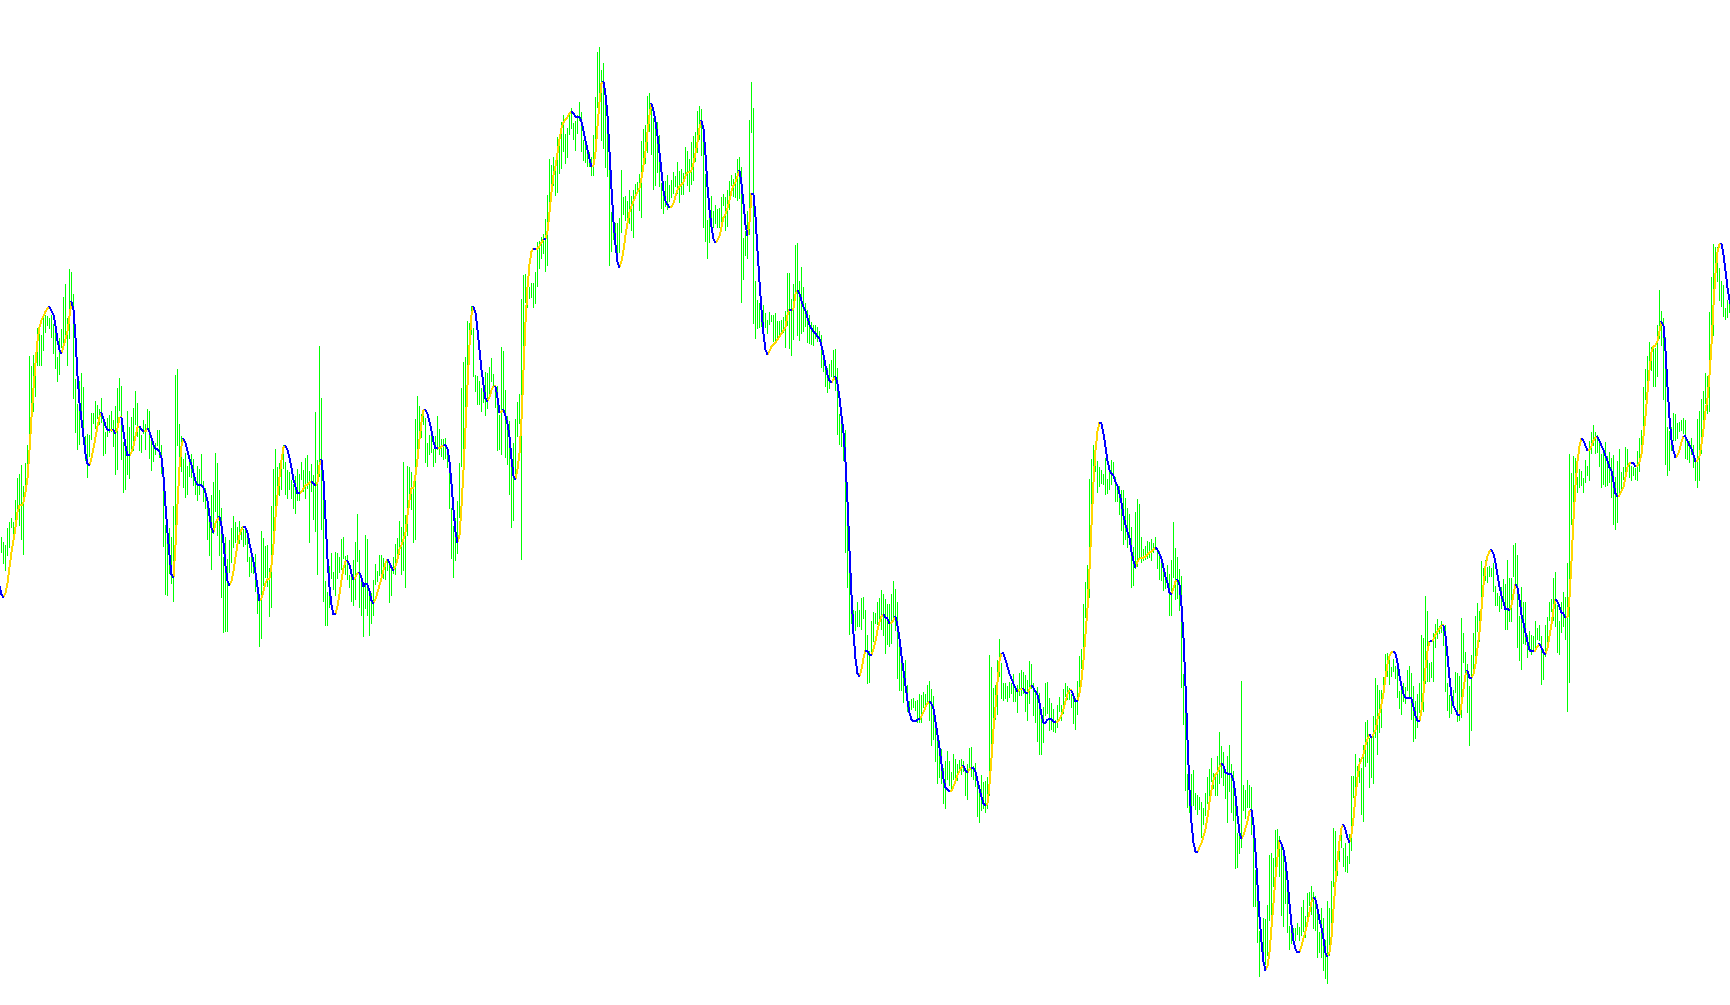
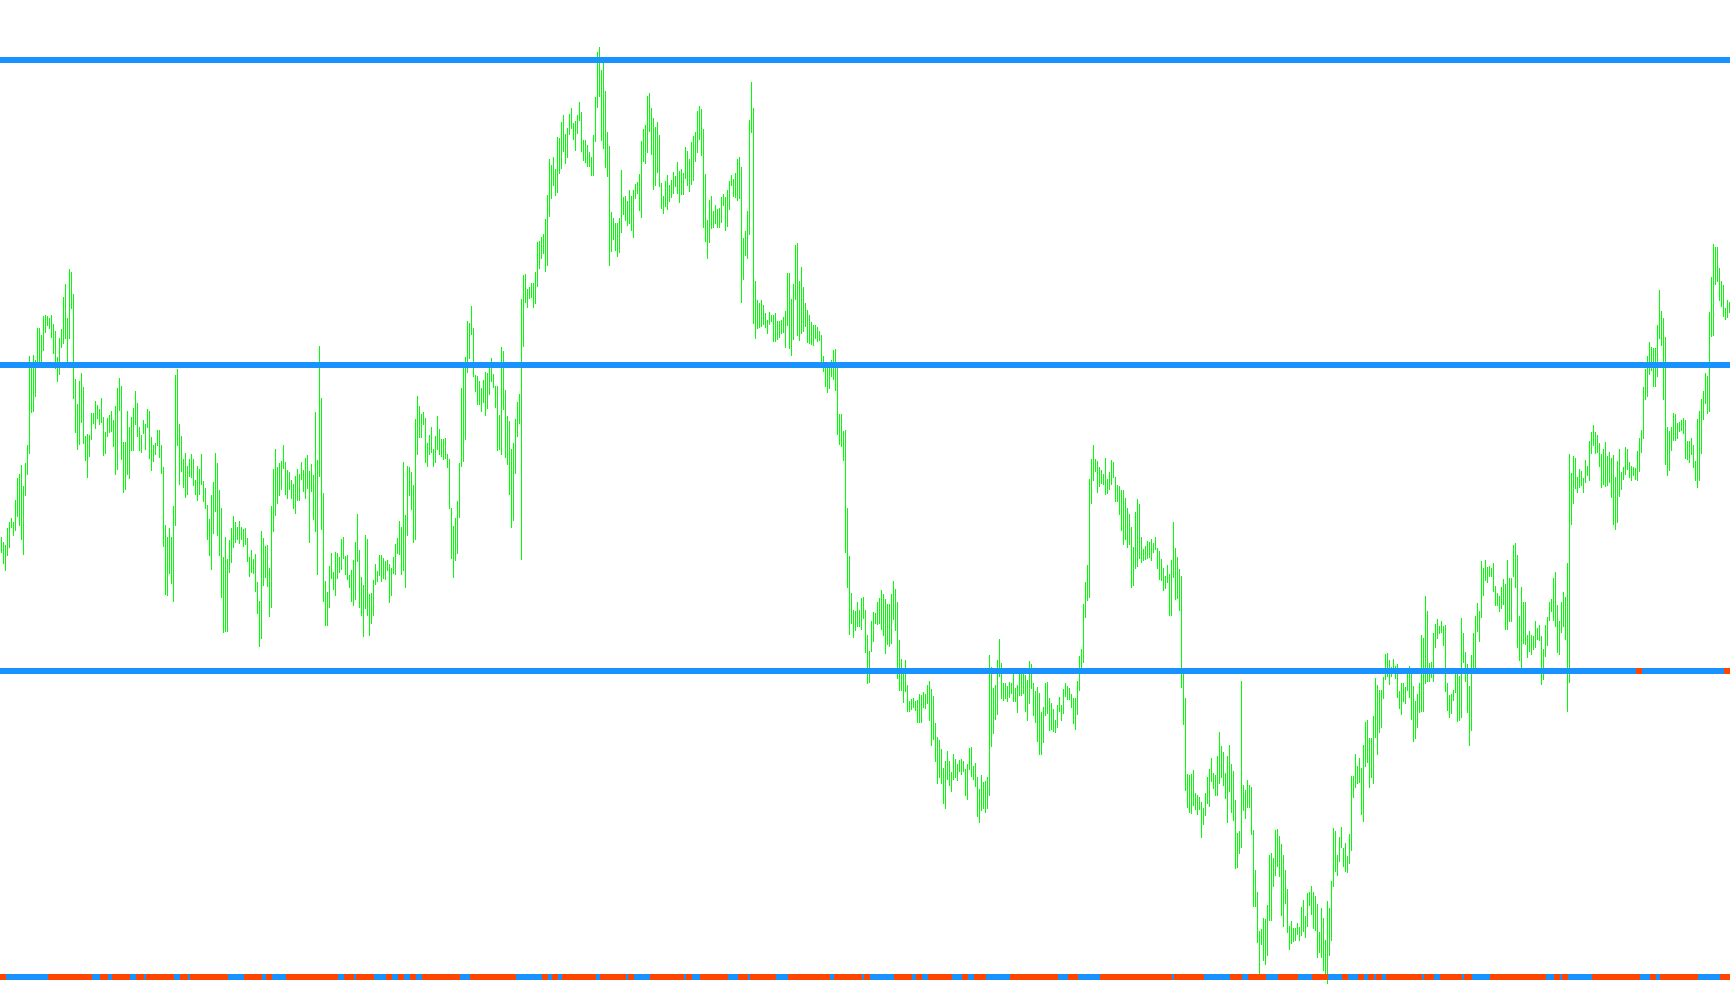
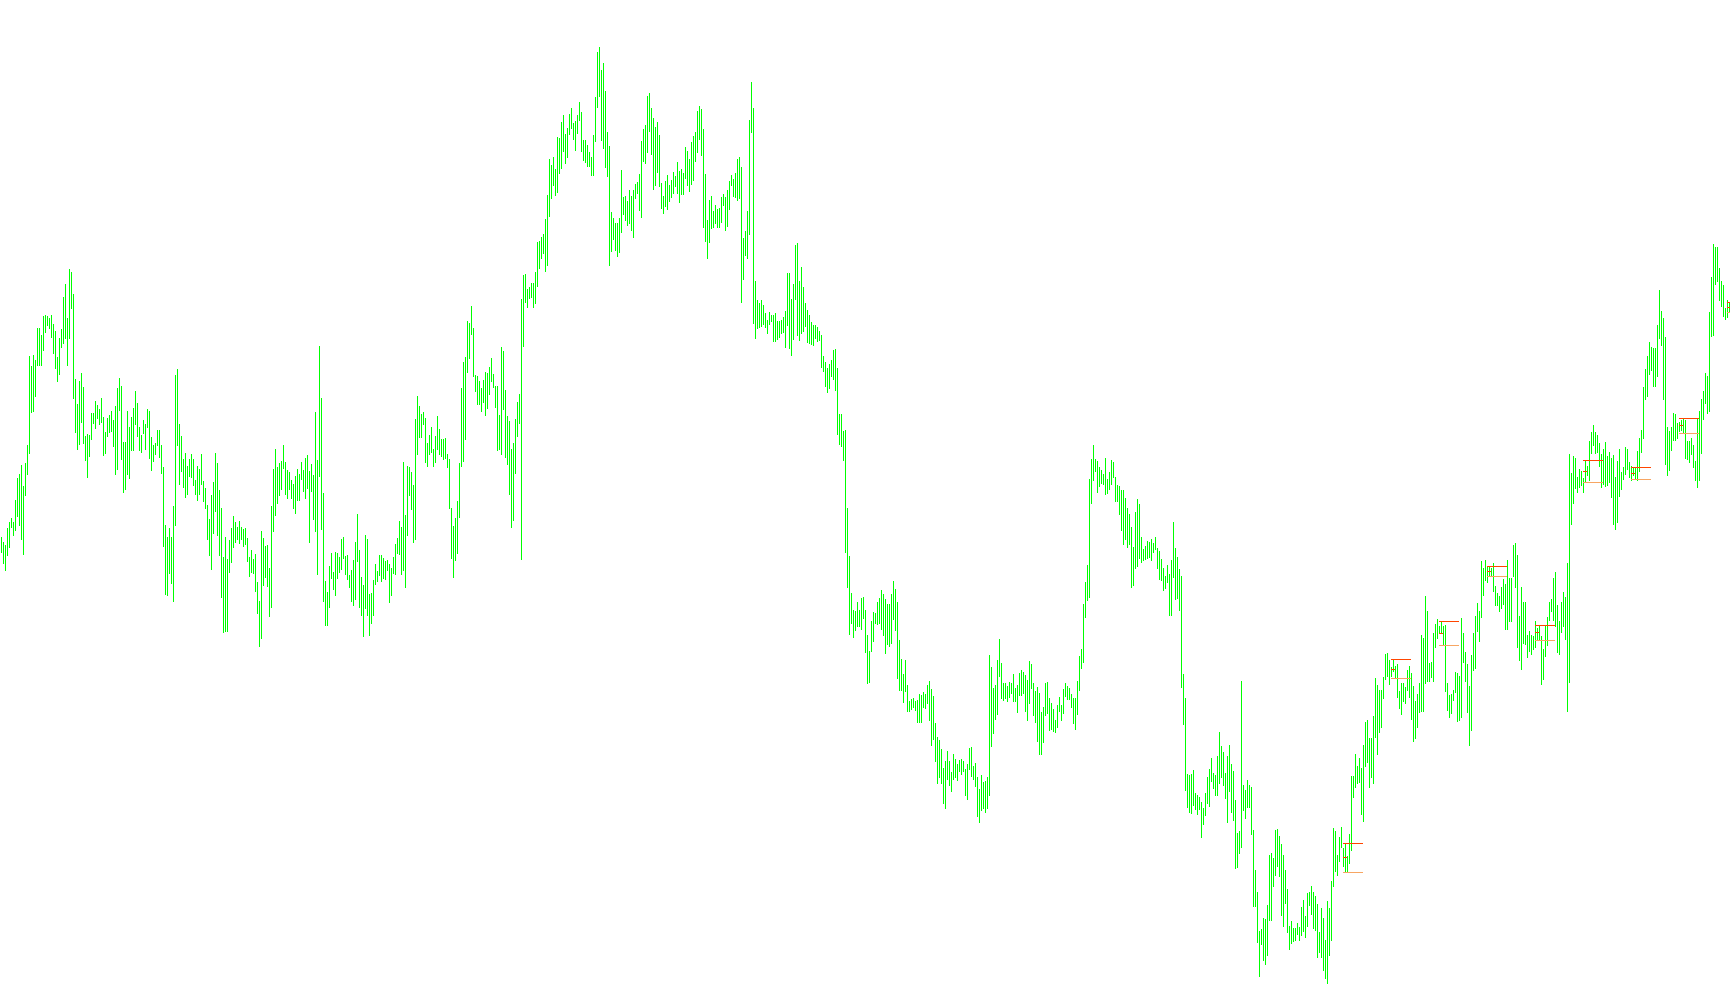
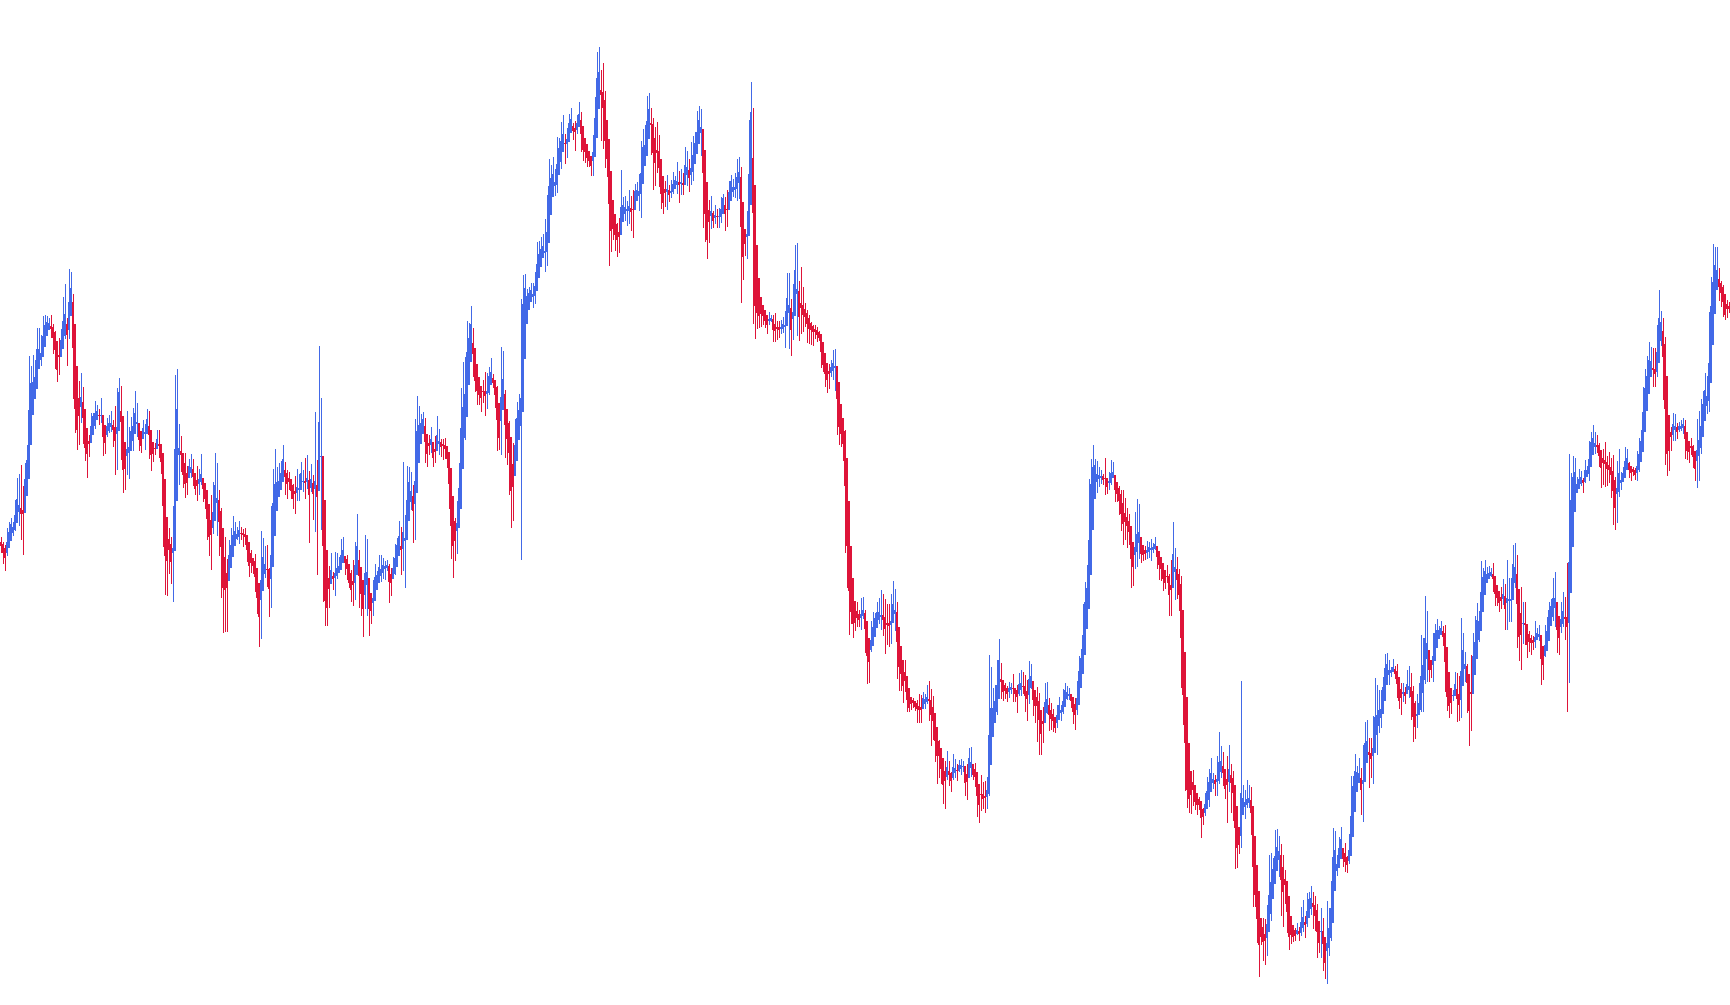
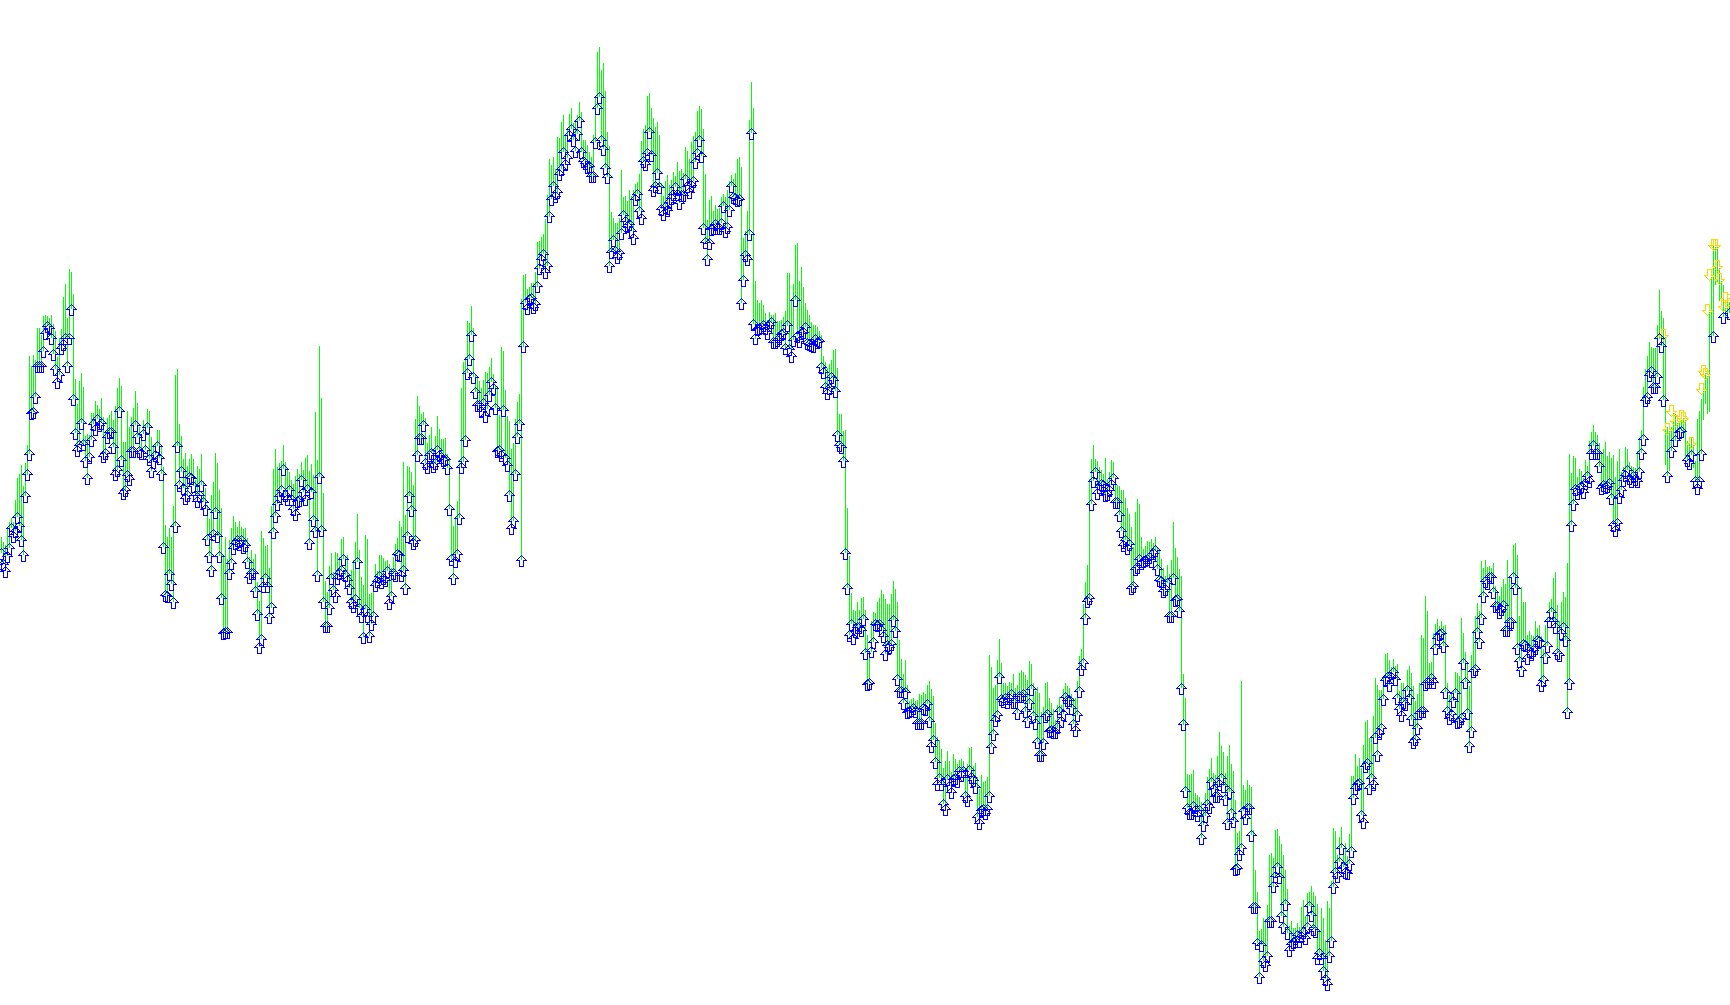
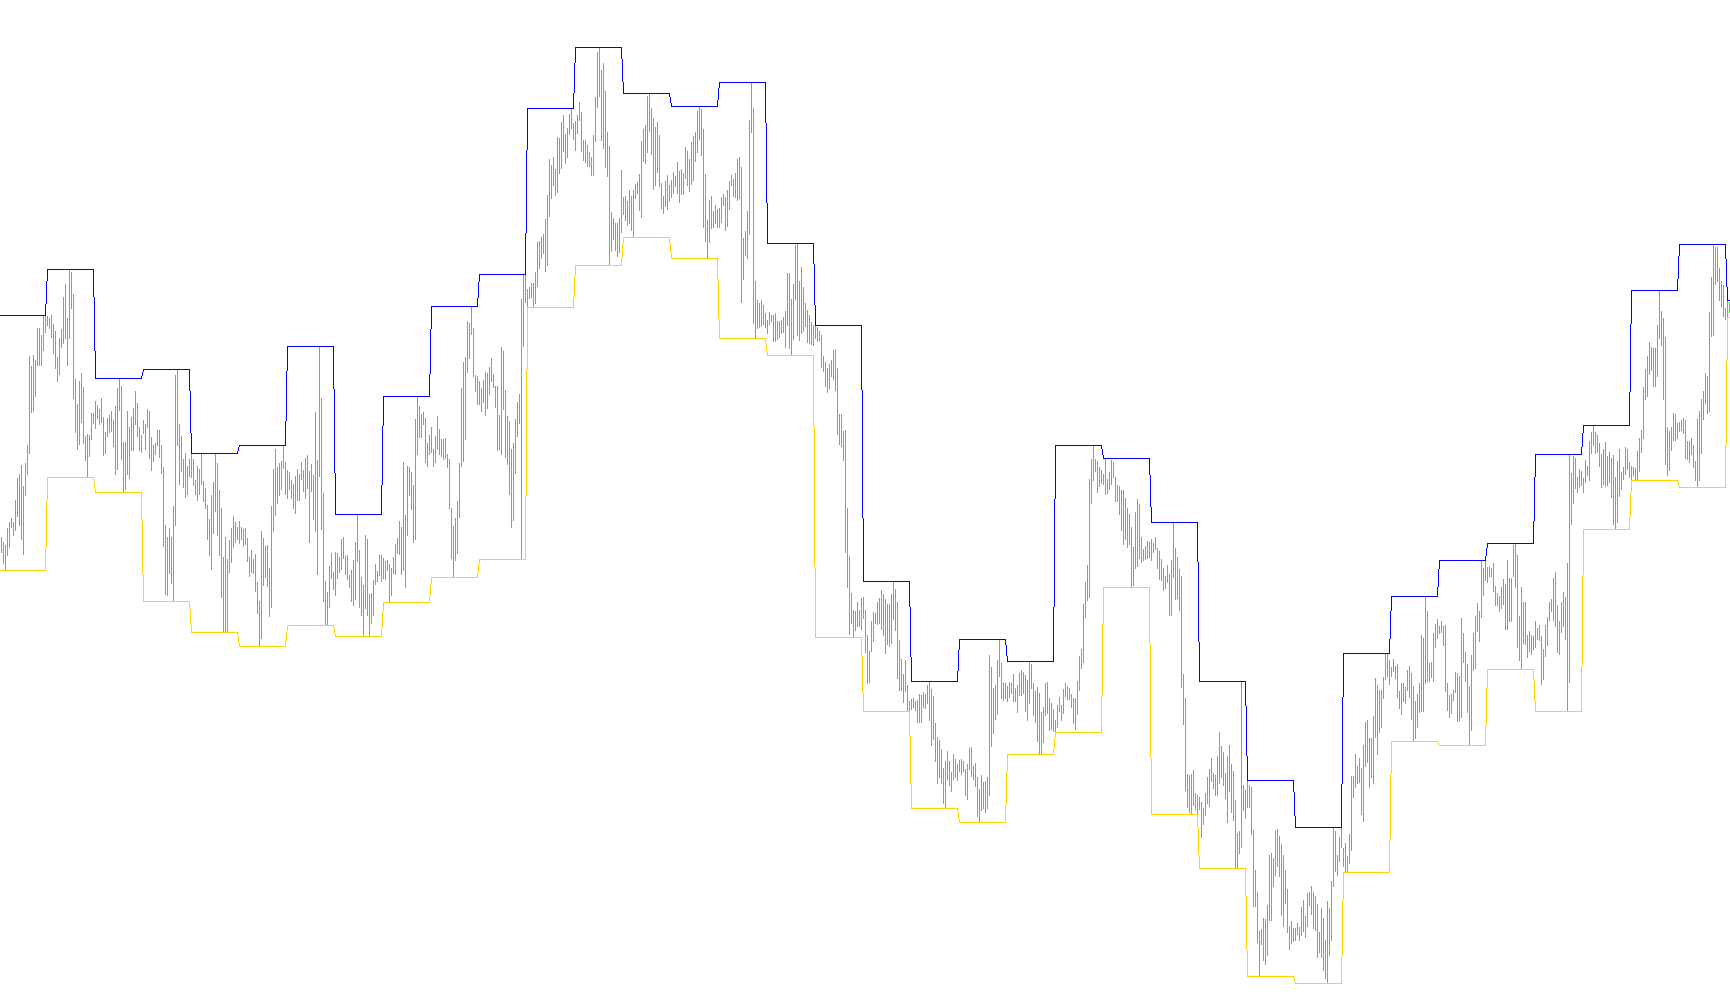
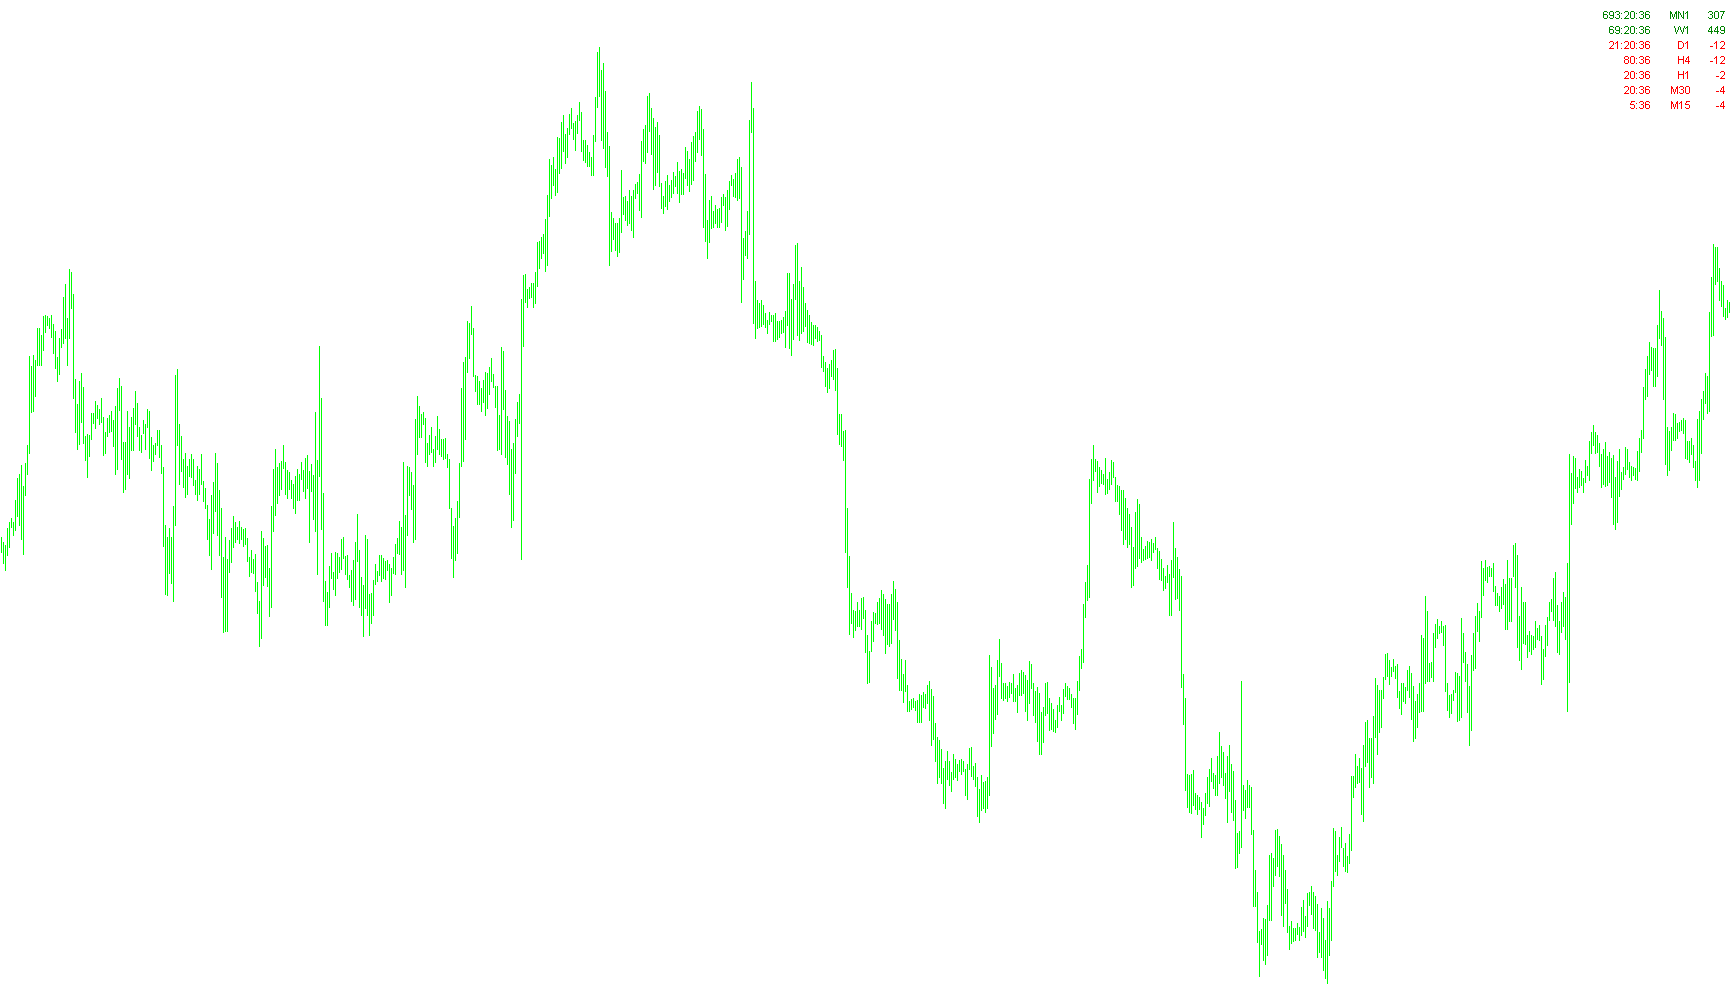
The algorithm synthesizes three distinct Williams Percent Range periods using weighted averaging to identify structural trend shifts based on momentum extremes.

MBKAsctrend3times_v2
Indicator

MBKAsctrend3times_v2

iWPR

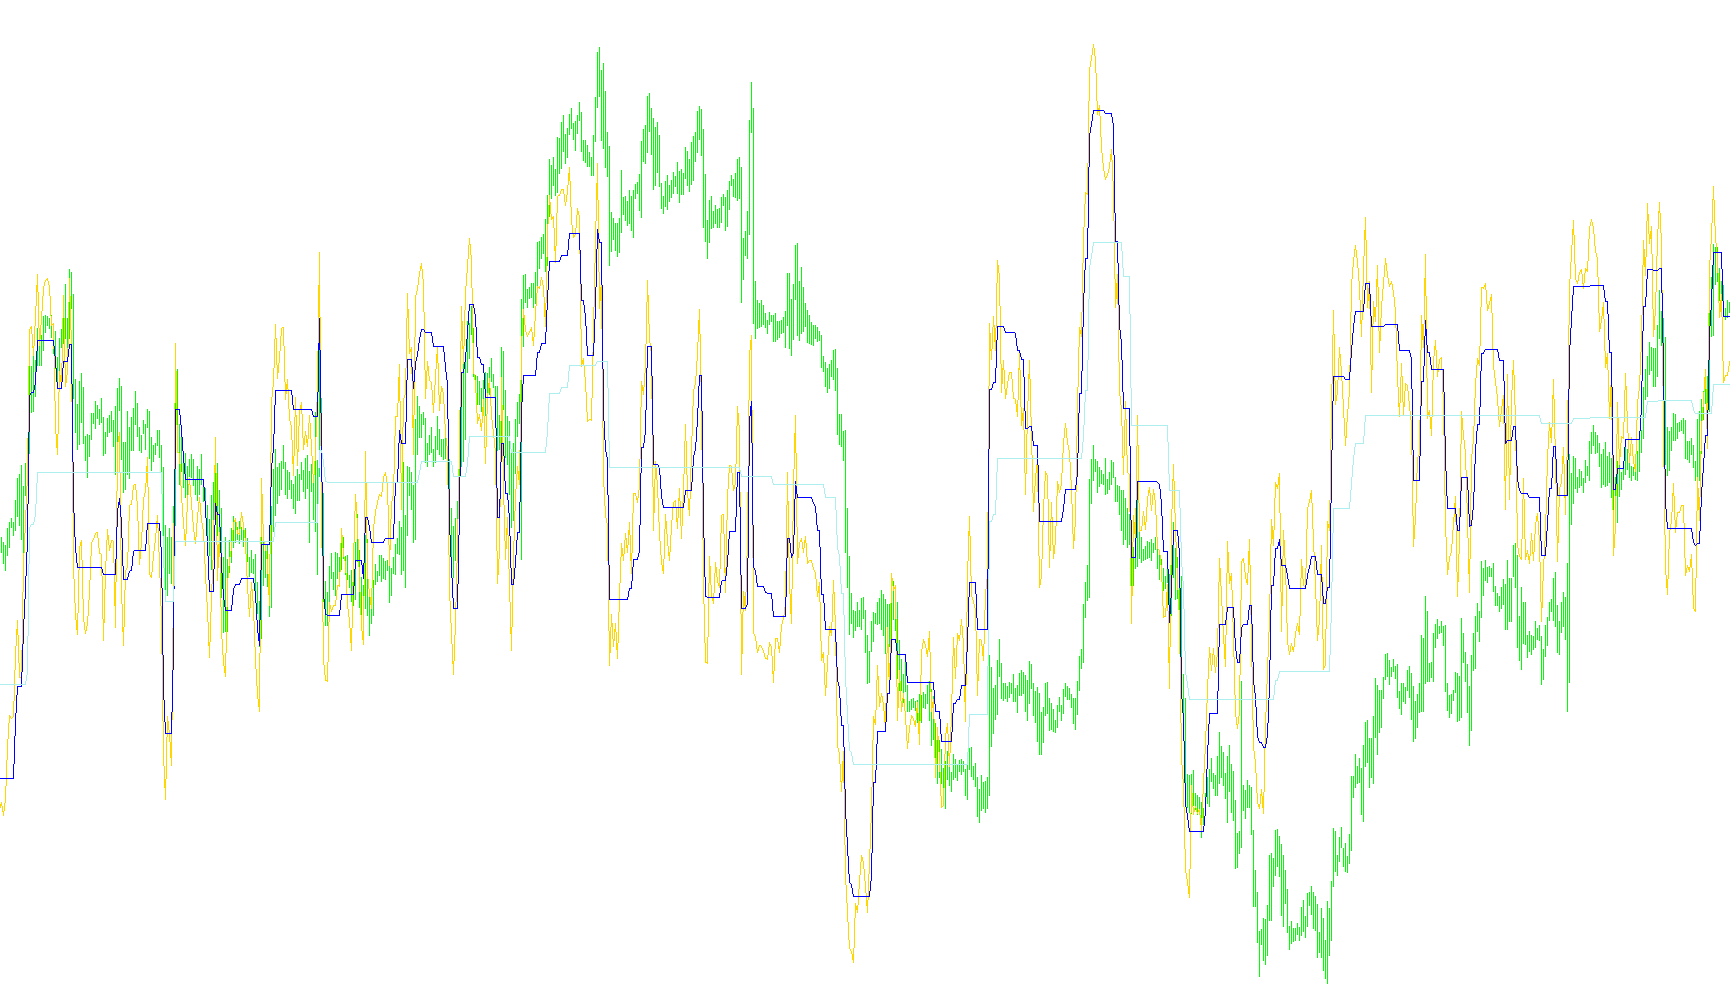
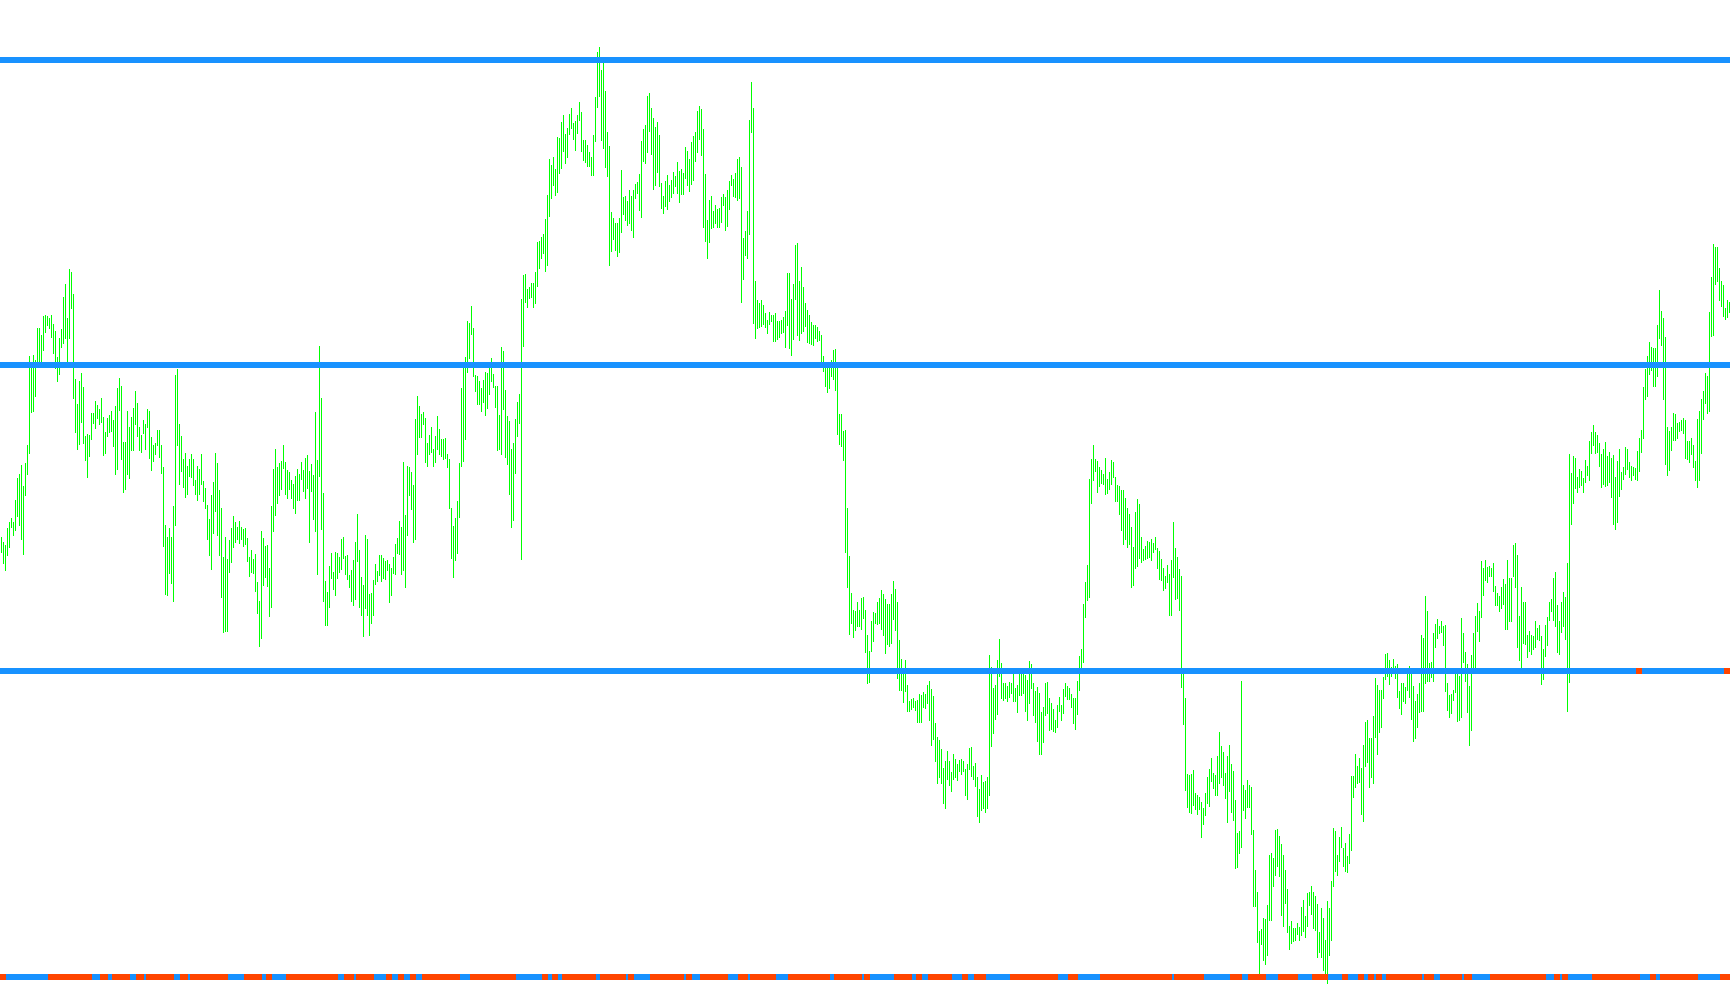
This indicator identifies trend shifts by calculating a weighted average of three different Williams Percent Range (WPR) periods combined with a long-term structural filter.

mc
Indicator

mc

iMAiMAOnArray

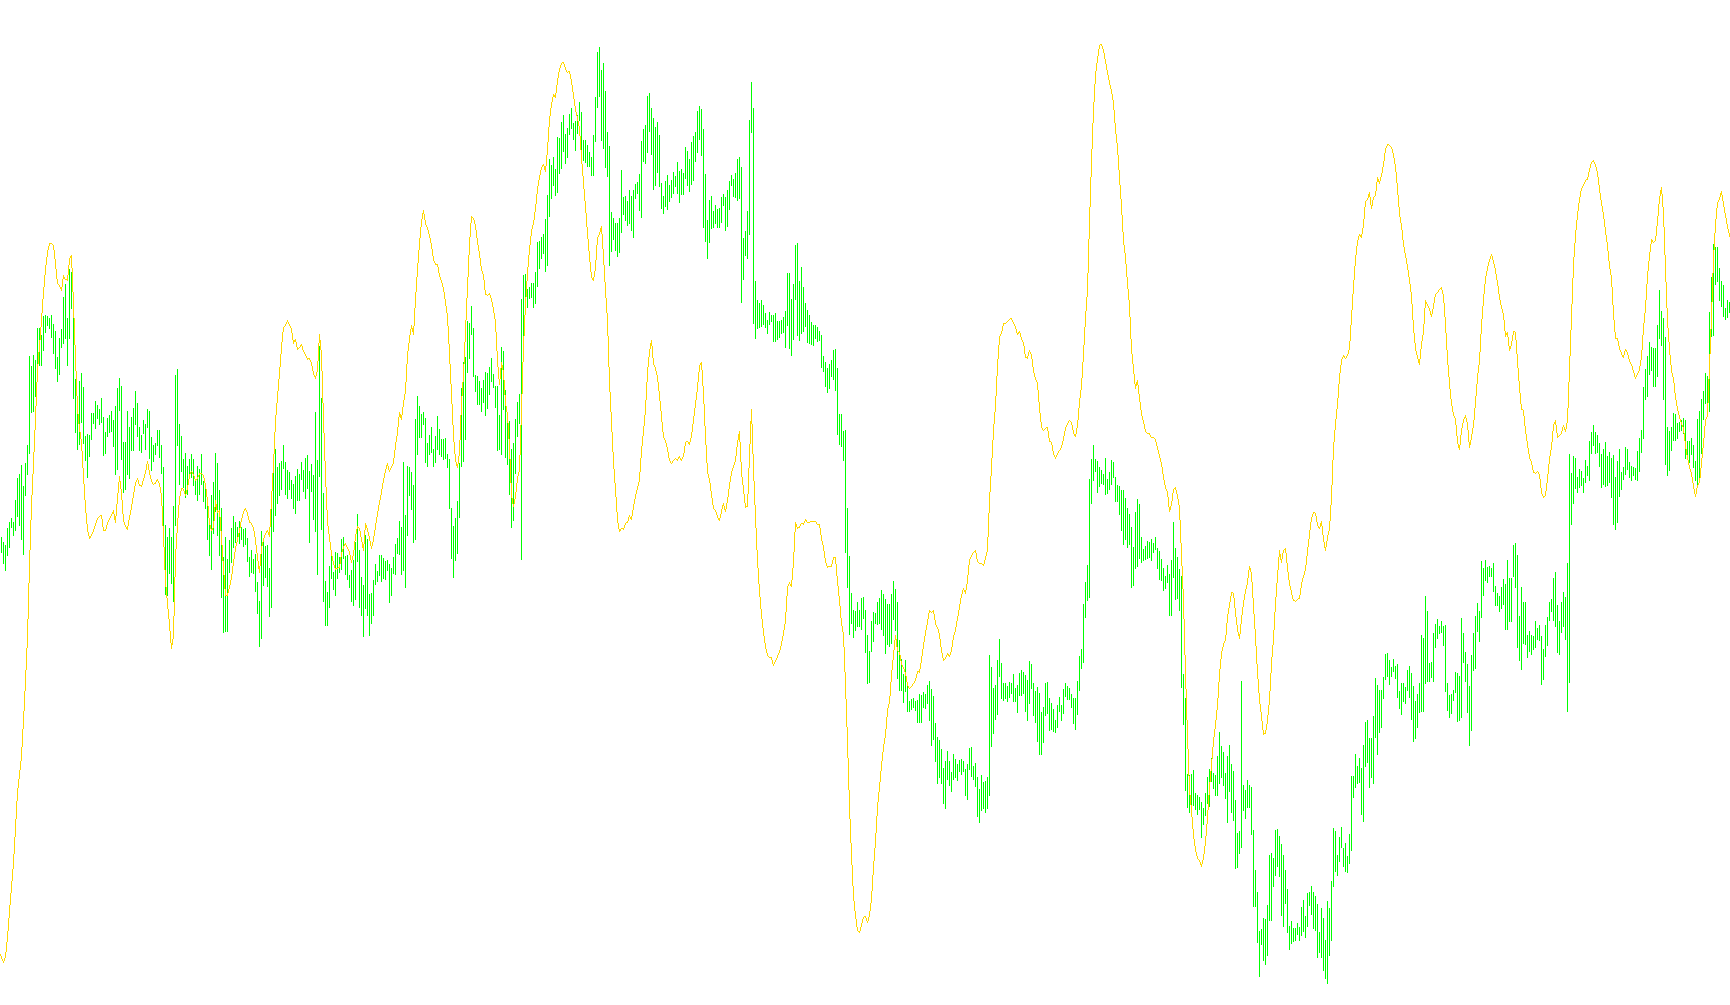
Calculates the variance between two exponential moving averages and applies a simple moving average filter to derive a signal line for identifying trend reversals.

Indicator

MCP

iMA
MCVA
Indicator

MCVA

This script synchronizes three interconnected graphical objects—two vertical lines and a linear regression line—across multiple charts, ensuring that moving any single element automatically updates the corresponding coordinates on all active windows.

mc_v1
Indicator

mc_v1

iMAiMAOnArray

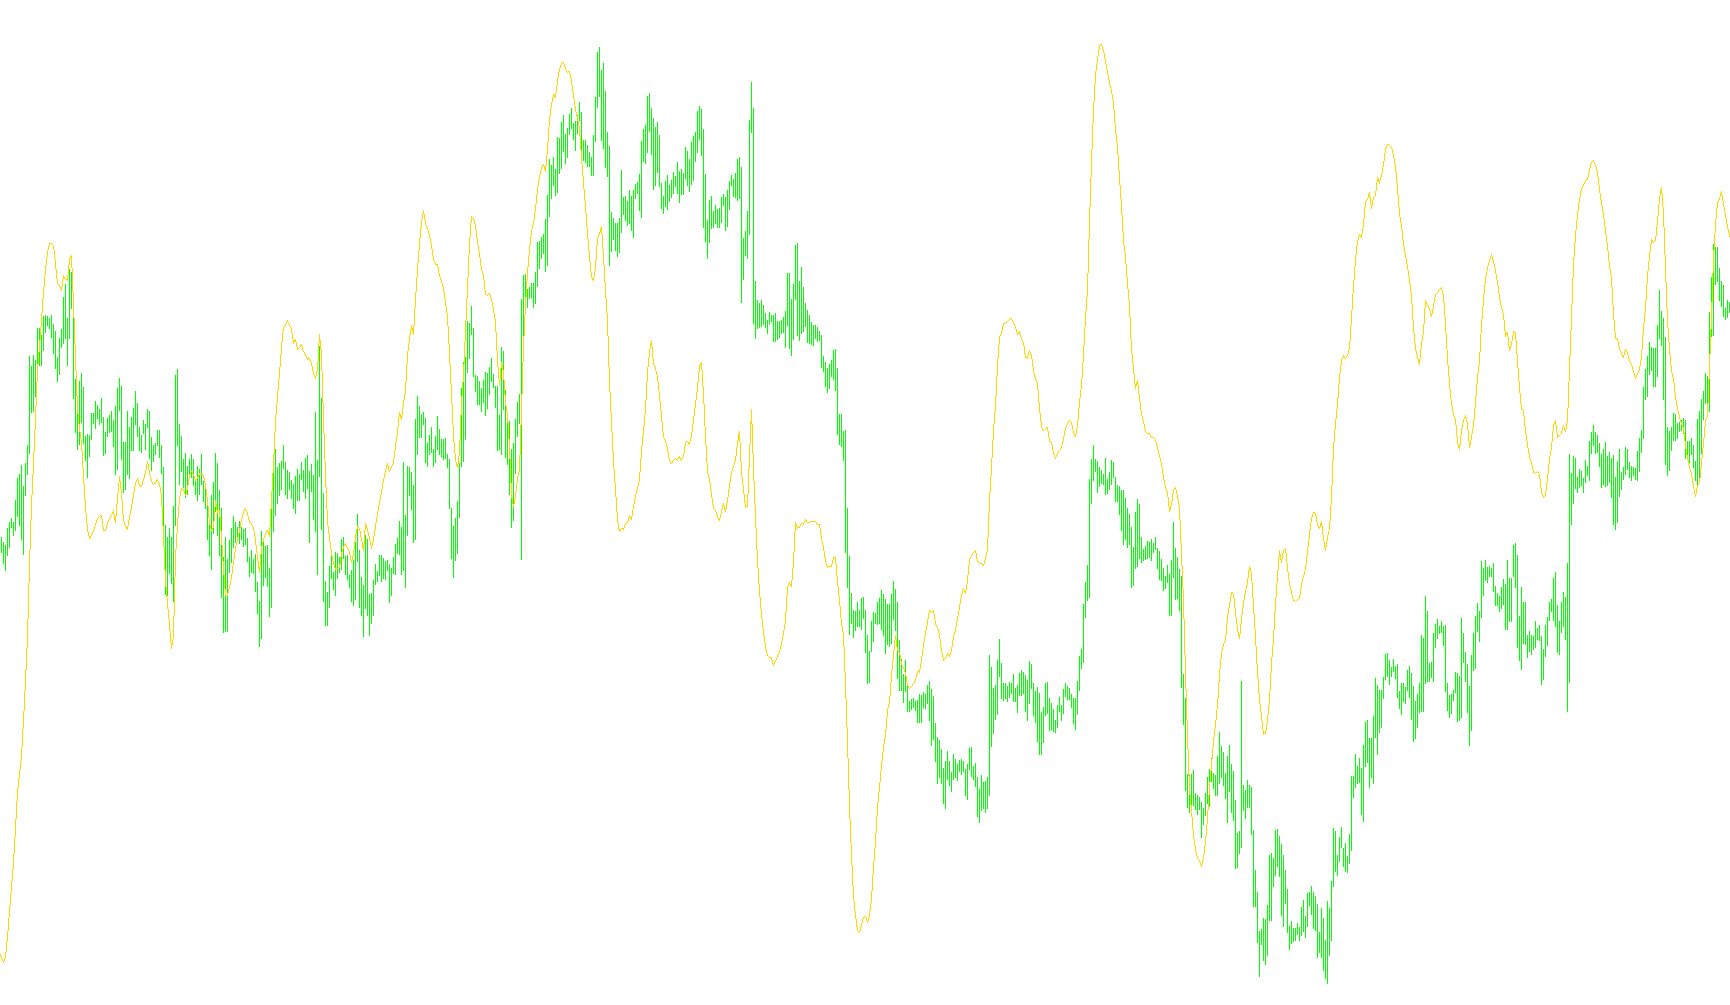
Calculates the convergence and divergence between two exponential moving averages to derive a secondary signal line for momentum tracking.

mc_v2
Indicator

mc_v2

iMAiMAOnArray

Quantifies relative velocity by calculating the delta between two exponential moving averages and smoothing the resulting variance via a simple moving average signal line.

Median+ATRm
Indicator

Median+ATRm

iMAOnArray

This indicator calculates a central median price between period highs and lows, establishing an upper and lower boundary based on a volatility-adjusted ATR multiplier to visualize market range.

Median
Indicator

Median

iMAOnArray

This indicator constructs a dynamic trading corridor by calculating the midpoint of local price extremes and expanding it using a multiplier of the Average True Range.

Median_v1
Indicator

Median_v1

iMAOnArray

This indicator constructs a volatility-adjusted pricing envelope by calculating the midpoint between local price extremes and projecting an upper and lower boundary based on a multiplier of the Average True Range.

Mega trend
Indicator

Mega trend

iMAiMAOnArray

This indicator calculates a smoothed trend trajectory by applying a weighted moving average to the difference between dual-period averages, identifying directional shifts through slope velocity.

MEGATREND SITELITE 1.7
Indicator

MEGATREND SITELITE 1.7

iMA

This indicator identifies bullish and bearish signals by comparing closing prices against smoothed high and low price averages to trigger discrete level-based entries.

MegaTrend
Indicator

MegaTrend

iMAiMAOnArray

This indicator identifies market direction by calculating the moving average of a second-order differential vector derived from weighted price momentum.

melkl
Indicator

melkl

Identifies market structural shifts by detecting consecutive three-candle expansion patterns in price extremes to project potential reversal entry levels.

metastock_to_csv
Indicator

metastock_to_csv

This script iterates through a Metastock text file to parse chronological price data and reformat it into a standardized CSV structure compatible with MetaTrader.

METRO
Indicator

METRO

iRSI

This indicator overlays dynamic volatility bands onto the Relative Strength Index to visualize multi-speed momentum shifts and structural trend breakouts.

METRO_v1
Indicator

METRO_v1

iRSI

This indicator overlays two dynamic step-based volatility boundaries onto a standard Relative Strength Index to visualize multi-speed momentum shifts and trend exhaustion.

METRO_v2
Indicator

METRO_v2

iRSI

This indicator identifies trend exhaustion and structural shifts by projecting dynamic upper and lower boundaries based on multi-step RSI deviations.

MFCS 4TF MACD SLOPE #2
Indicator

MFCS 4TF MACD SLOPE #2

iMACD

This indicator visualizes the instantaneous direction of the MACD main line across four distinct timeframes simultaneously to identify concurrent trend momentum.

MFCS 4TF MACD SLOPE #2b
Indicator

MFCS 4TF MACD SLOPE #2b

iMACD

This indicator visualizes the directional momentum of MACD values across four distinct timeframes simultaneously, using arrow markers to identify bullish and bearish slope transitions.

MFCS 4TF MACD SLOPE #2_001
Indicator

MFCS 4TF MACD SLOPE #2_001

iMACD

This indicator visualizes the directional momentum of the MACD oscillator across four concurrent timeframes to identify synchronized trend slopes.

MFCS 4TF MACD SLOPE #2_002
Indicator

MFCS 4TF MACD SLOPE #2_002

iMACD

This indicator visualizes the directional trajectory of the MACD main line across four distinct temporal horizons simultaneously to identify multi-layered trend confluence.

Indicator

MFCS ATR BAR

iATR
MFI 1
Indicator

MFI 1

Quantifies the velocity of capital movement by comparing the cumulative weighted sum of bullish versus bearish price action across a specified lookback period.

MFI-Alert
Indicator

MFI-Alert

The script quantifies capital flow by calculating the ratio of positive to negative price pressure weighted by transactional volume over a specified rolling period.

MFI
Indicator

MFI

Quantifies the intensity of buying and selling pressure by calculating the ratio of volume-weighted price movements over a rolling period.

MFI_MACD_mtf
Indicator

MFI_MACD_mtf

iMFIiMAOnArray

This indicator calculates the differential between two Money Flow Index (MFI) periods across higher timeframes and applies a Simple Moving Average to smooth the resulting momentum signal.

Indicator

MFI_MoneyFlowIndex_MTF

iMFI
MFI_OsWAD_macdosma4c
Indicator

MFI_OsWAD_macdosma4c

iMFIiMAOnArray

This indicator synthesizes Money Flow Index (MFI) dynamics with an oscillating momentum filter to identify directional shifts in volume-weighted price velocity.

Indicator

MFI_x2_mtf

iMFI
MF_BreakDown_Flat 0-1010
Indicator

MF_BreakDown_Flat 0-1010

This indicator automatically identifies daily support, resistance, and pivot levels by calculating the price extremes during the specific early morning Asian trading window.

mHeikenAshi_DM
Indicator

mHeikenAshi_DM

This indicator transforms standard price action into smoothed Heiken Ashi bars by calculating synthetic open and close values to filter market noise.

Indicator

Michelangelo

Indicator

Michelangelo1

Indicator

Michelangelo28nov05

Indicator

Michelangelo28nov05_v1

Indicator

Michelangelo_v1

Indicator

Michelangelo_v2

MidDay
Indicator

MidDay

iRSI

The indicator identifies trend reversals by mapping M1 timeframe RSI values against a 50-level threshold to trigger directional signals on the current chart.
mikahekin-v1.0
Indicator

mikahekin-v1.0

This indicator calculates rolling price averages for open, close, high, and low values by incorporating localized period extremes to identify structural equilibrium points.

mikahekin-v1.1
Indicator

mikahekin-v1.1

This indicator identifies market sentiment by calculating the average of high, low, open, and close prices over specific periods to plot directional pressure based on price action polarity.

mikahekin
Indicator

mikahekin

The logic identifies structural extremes by calculating rolling price envelopes and comparing internal candle polarity against averaged high and low boundaries.

mikko_mtf_candle
Indicator

mikko_mtf_candle

This indicator projects historical price extremes from a higher temporal framework onto the current chart to visualize structural volatility boundaries.

mikko_mtf_info
Indicator

mikko_mtf_info

This indicator synchronizes multi-timeframe price fluctuations and remaining bar countdowns with a global market session tracker to provide a real-time overview of concurrent trading windows.

mikko_painmeter2
Indicator

mikko_painmeter2

iMAOnArray

This indicator quantifies market emotional pressure by calculating the cumulative price displacement between current bars and a historical window to identify trend exhaustion via moving average troughs and peaks.

MIndex
Indicator

MIndex

This indicator synthesizes a representative market value by calculating the geometric mean of major global currency pairs to derive a consolidated liquidity trend.

MIndex_001
Indicator

MIndex_001

This indicator calculates a synthetic base currency strength by geometrically averaging the relative price actions of multiple major forex pairs.

MIndex_002
Indicator

MIndex_002

Calculates a geometric mean of major global currencies against the US Dollar to derive a unified cross-market strength index.

Indicator

mindhero

iATR
Indicator

mindrends

iATR