MTF Pivots
Indicator

MTF Pivots

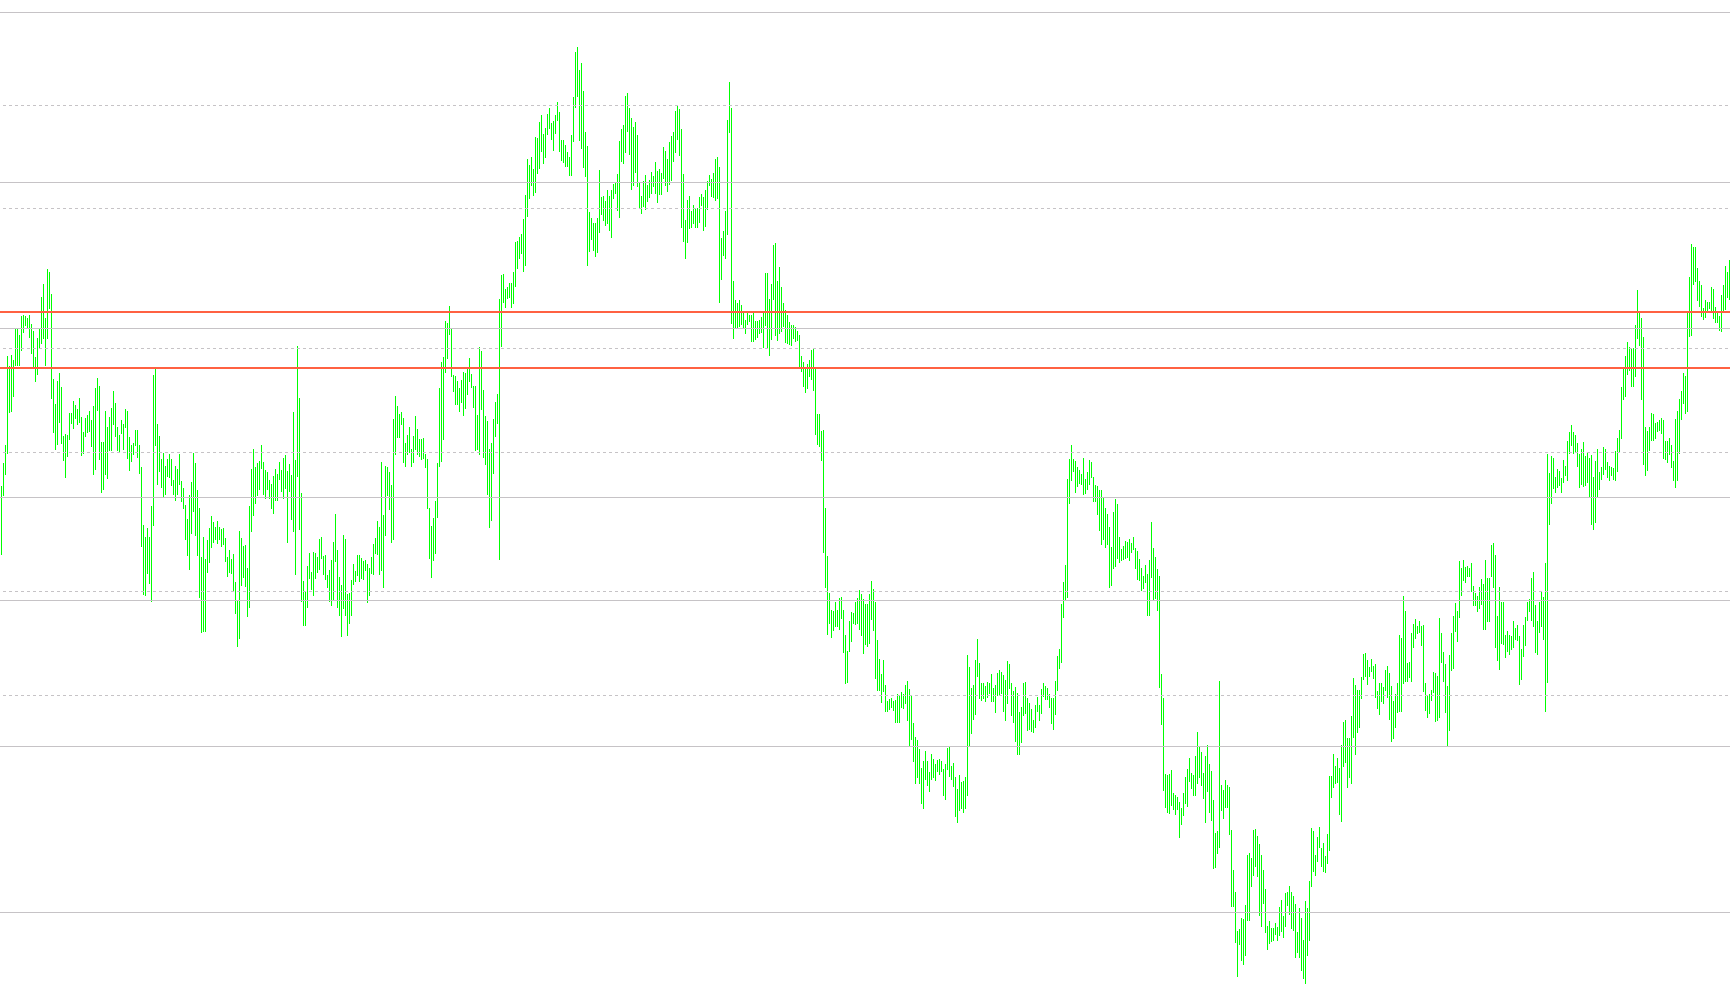
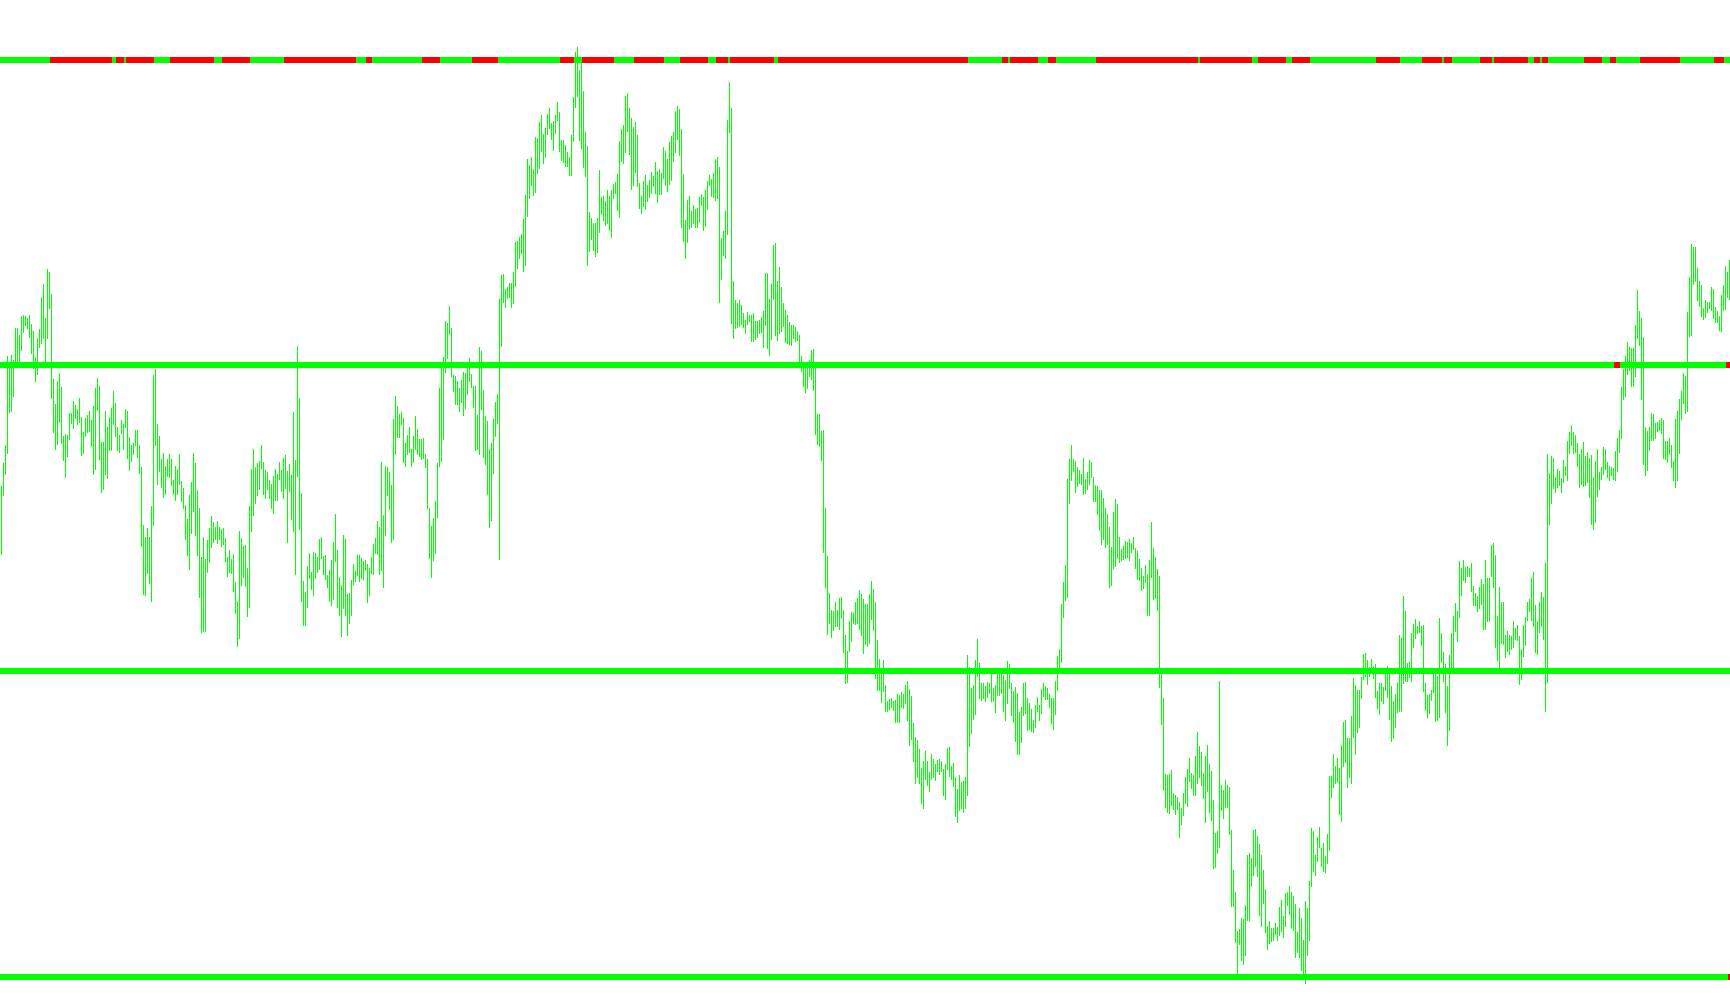
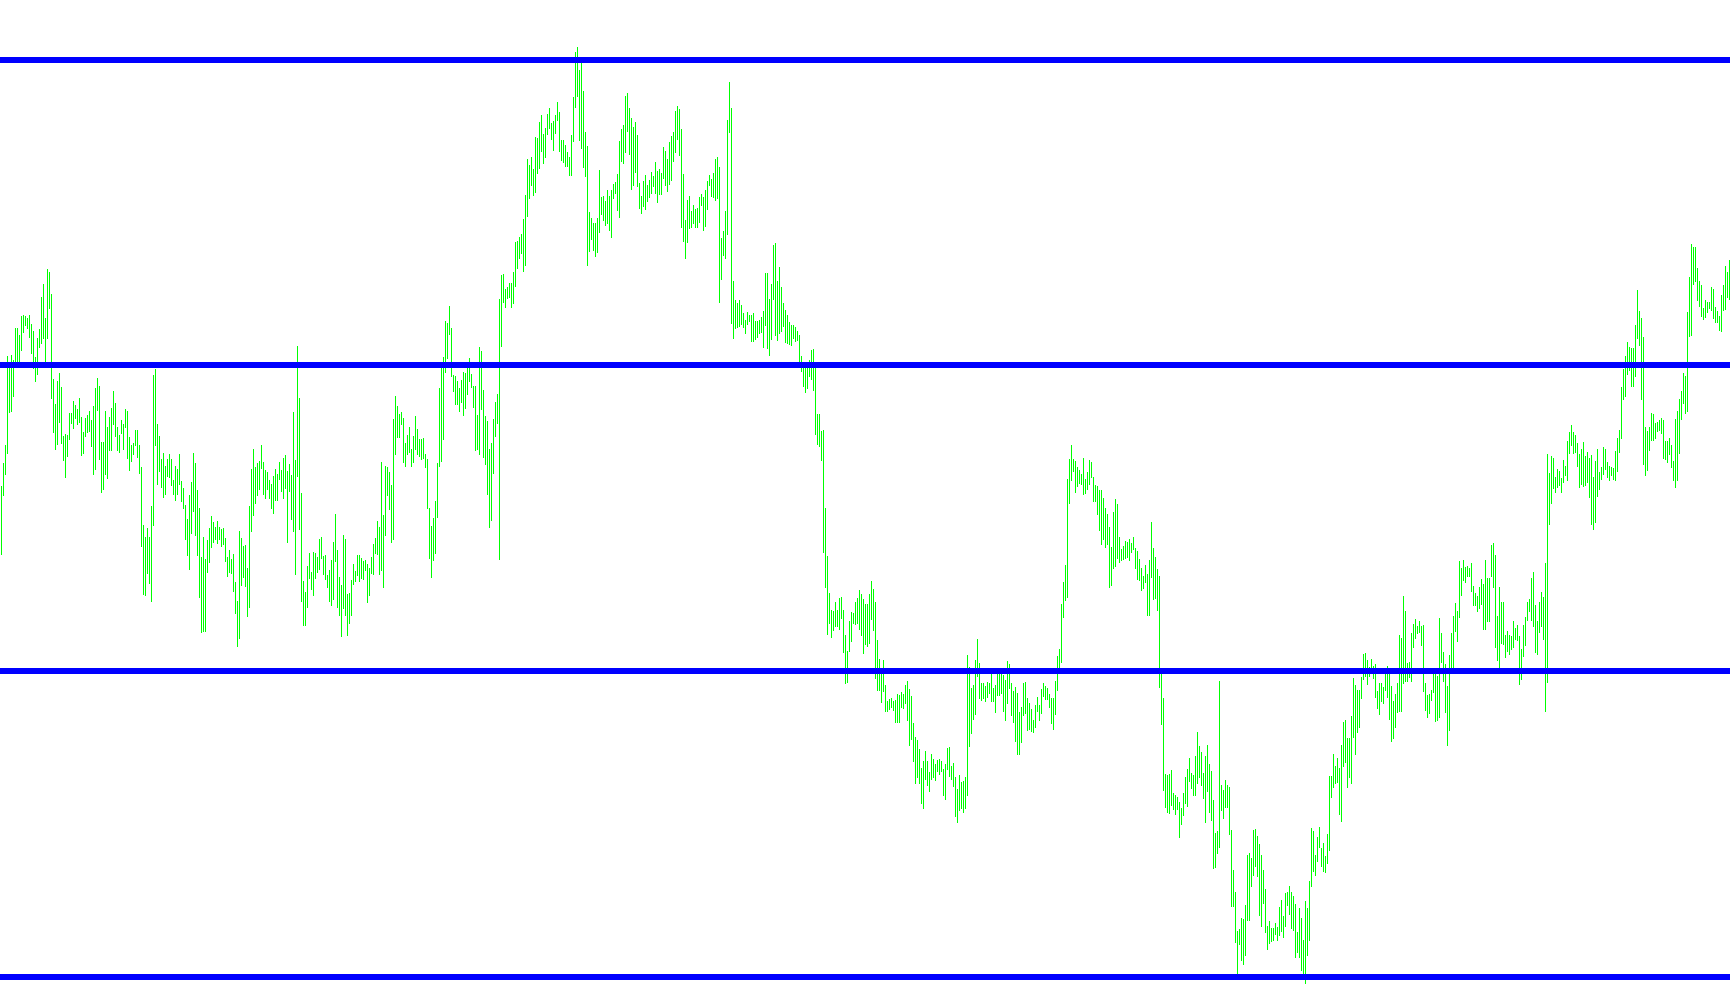
This indicator dynamically calculates and visualizes standard, midpoint, and extended pivot levels across 4-hour, daily, weekly, and monthly timeframes to identify key structural support and resistance zones.

MTF Relative Strength Index
Indicator

MTF Relative Strength Index

iRSI

This indicator projects Relative Strength Index values from higher timeframes onto the current chart to identify underlying momentum trends across multiple periodicities.

Indicator

MTF Volatility Pivot

MTF Waddah_Attar_Explosion
Indicator

MTF Waddah_Attar_Explosion

iBandsiMACD

The indicator identifies high-velocity trend shifts by calculating the relative power of MACD momentum and Bollinger Band expansion against a predefined volatility dead zone.

MTF Waddah_Attar_Explosion
Indicator

MTF Waddah_Attar_Explosion

iBandsiMACD

Identifies high-velocity trend shifts by calculating the relative acceleration of MACD momentum against Bollinger Band volatility expansions.

Indicator

MTF WPR

MTF-Dinapoli_Target
Indicator

MTF-Dinapoli_Target

This indicator synchronizes and maps higher-timeframe Dinapoli target levels onto the current chart using a dynamic temporal offset calculation.

Indicator

MTF-Fractals-SP-window

iFractals
MTFMA
Indicator

MTFMA

This indicator projects moving average calculations from higher timeframes onto the current chart, allowing for synchronized trend analysis across disparate temporal scales.

MTFPI-sub1
Indicator

MTFPI-sub1

The logic identifies high-probability trend entries by synchronizing multi-component momentum signals with moving average crossovers and dynamic price thresholds.

MTFPI-sub2
Indicator

MTFPI-sub2

iMACD

This indicator calculates the rate of change between consecutive MACD main line values to isolate immediate acceleration in price velocity.

MTFPI-sub3
Indicator

MTFPI-sub3

iStochastic

This indicator identifies dynamic support and resistance levels by locating previous stochastic crossover extremes and triggers signals when price breaches these historical structural points.

MTFPI-sub4
Indicator

MTFPI-sub4

This indicator transforms standard price action into smoothed HeikinAshi values by averaging the previous candle's mean and current candle's price extremes to filter market noise.

MTFSR-Kurl
Indicator

MTFSR-Kurl

This indicator aggregates concurrent support and resistance levels across six distinct timeframes by synchronizing MACD, Stochastic, and Heikin Ashi data to identify high-probability structural zones.

MTF_#MAMA_2.1
Indicator

MTF_#MAMA_2.1

This indicator identifies trend reversals by monitoring the intersection of two distinct MAMA (Mixed Adaptive Moving Average) lines on a specified timeframe.

Indicator

mtf_3xRSI

iRSI
Indicator

MTF_4 TF XO_M30D1

Indicator

MTF_4 TF XO_M30D1_v1

Indicator

MTF_4 TF XO_M5M60

MTF_4TF_FXSniperErgodicCCI_Bars
Indicator

MTF_4TF_FXSniperErgodicCCI_Bars

This indicator aggregates directional signals from four distinct timeframes by analyzing custom ergodic CCI triggers to identify synchronized bullish and bearish momentum.

MTF_4TF_FXSniperErgodicCCI_BarsM6
Indicator

MTF_4TF_FXSniperErgodicCCI_BarsM6

This indicator synchronizes bearish and bullish signals from the FXSnipersErgodic_CCI trigger across four distinct timeframes to identify high-probability trend reversals.

MTF_4TF_HAS_Bar2M
Indicator

MTF_4TF_HAS_Bar2M

This indicator overlays directional trend signals from four distinct timeframes simultaneously, utilizing Smoothed Heiken Ashi price action to visualize multi-horizon momentum alignment.

MTF_4TF_Supertrend_BarM
Indicator

MTF_4TF_Supertrend_BarM

This indicator synchronizes and visualizes Supertrend trend directions across four concurrent higher-timeframes to identify multi-layer bullish or bearish alignment.

MTF_4TF_Supertrend_BarM1
Indicator

MTF_4TF_Supertrend_BarM1

This indicator synchronizes and overlays directional signals from four distinct timeframes simultaneously to visualize trend alignment across a multi-layered hierarchy.

MTF_4TF_Supertrend_BarM_v1
Indicator

MTF_4TF_Supertrend_BarM_v1

This indicator visualizes multi-timeframe Supertrend trend directions simultaneously by plotting synchronized directional signals across four distinct nested temporalities.

MTF_5TFx5MA
Indicator

MTF_5TFx5MA

iMA

This indicator projects five distinct moving averages from multiple higher timeframes onto a single chart to visualize multi-layered trend alignment and price action hierarchy.

MTF_5TFx5MA[sw]
Indicator

MTF_5TFx5MA[sw]

iMA

This indicator projects five distinct moving averages from different timeframes onto a single chart to visualize concurrent trend alignment and momentum across multiple scales.

MTF_AbsoluteStrength_sBar
Indicator

MTF_AbsoluteStrength_sBar

This indicator synchronizes bullish and bearish momentum signals across multiple timeframes using configurable RSI, Stochastic, or ADX modes to identify high-probability trend reversals and neutral zones.

MTF_AbsoluteStrength_sBar3
Indicator

MTF_AbsoluteStrength_sBar3

This indicator synchronizes high-level trend momentum from higher timeframes by evaluating RSI, Stochastic, or ADX oscillators to identify bullish dominance, bearish pressure, and market neutrality.

MTF_AbsoluteStrength_v1.1
Indicator

MTF_AbsoluteStrength_v1.1

This indicator aggregates bullish and bearish sentiment by synthesizing RSI, Stochastic, and ADX metrics across higher timeframes to identify smoothed momentum trends and signal cross-overs.

MTF_AbsoluteStrength_v1.1SideBAR
Indicator

MTF_AbsoluteStrength_v1.1SideBAR

This indicator synthesizes multi-timeframe momentum and trend intensity to visualize bullish/bearish dominance, identifying high-conviction reversals, corrective phases, and low-interest equilibrium zones.

MTF_AbsoluteStrength_v1.1_DHS
Indicator

MTF_AbsoluteStrength_v1.1_DHS

This multi-timeframe indicator quantifies bullish and bearish momentum via smoothed oscillator averages to generate specific visual cues for trend strength, corrections, and neutral zones.

MTF_AbsoluteStrength_v1.1_SideBarM2
Indicator

MTF_AbsoluteStrength_v1.1_SideBarM2

This indicator synchronizes higher timeframe momentum dynamics by evaluating smoothed RSI/Stochastic oscillators to identify primary trend strength, directional corrections, and high-volatility equilibrium zones.

MTF_AbsoluteStrength_v1
Indicator

MTF_AbsoluteStrength_v1

This indicator aggregates multi-timeframe momentum metrics from RSI, Stochastic, and ADX oscillators to quantify the relative strength of bullish versus bearish pressures through smoothed signal crossovers.

MTF_AbsoluteStrength_v1DH
Indicator

MTF_AbsoluteStrength_v1DH

This indicator calculates smoothed bullish and bearish momentum strengths across different timeframes using RSI or Stochastic methodologies to identify dominant trend pressure.

MTF_AbsoluteStrength_v1DHs-1
Indicator

MTF_AbsoluteStrength_v1DHs-1

This indicator evaluates cross-period price dynamics by synthesizing smoothed bull/bear strength values with signal offsets to identify high-probability directional trends and correctional pullbacks.

MTF_AbsoluteStrength_v1DHs
Indicator

MTF_AbsoluteStrength_v1DHs

This indicator synchronizes multi-timeframe momentum dynamics by calculating smoothed bullish and bearish strength vectors to identify trend divergence and non-trade zones.

Indicator

MTF_AC

Indicator

MTF_AD

iAD
Indicator

MTF_ADX

iADX
Indicator

MTF_ADX_001

iADX
Indicator

MTF_ADX_Advanced_WA

MTF_ADX_WildersDMI_v1m
Indicator

MTF_ADX_WildersDMI_v1m

This indicator synthesizes smoothed ADX, DMI, and ADXR metrics across synchronized higher timeframes to evaluate trend strength and directional momentum.

MTF_ADX_WildersDMI_v1m_v1
Indicator

MTF_ADX_WildersDMI_v1m_v1

This indicator synthesizes Wilders-based directional movement and trend strength by projecting multi-timeframe ADX, DMI, and ADXR metrics onto the current chart.

Indicator

MTF_AD_001

iAD
Indicator

MTF_AD_v1

iAD
Indicator

MTF_Alligator+T3

iMA
Indicator

MTF_Alligator+T3[sw]

iMA
Indicator

MTF_Alligator+T3_v1

iMA
Indicator

MTF_AMA