Mint signal2.1_cl_2
Download script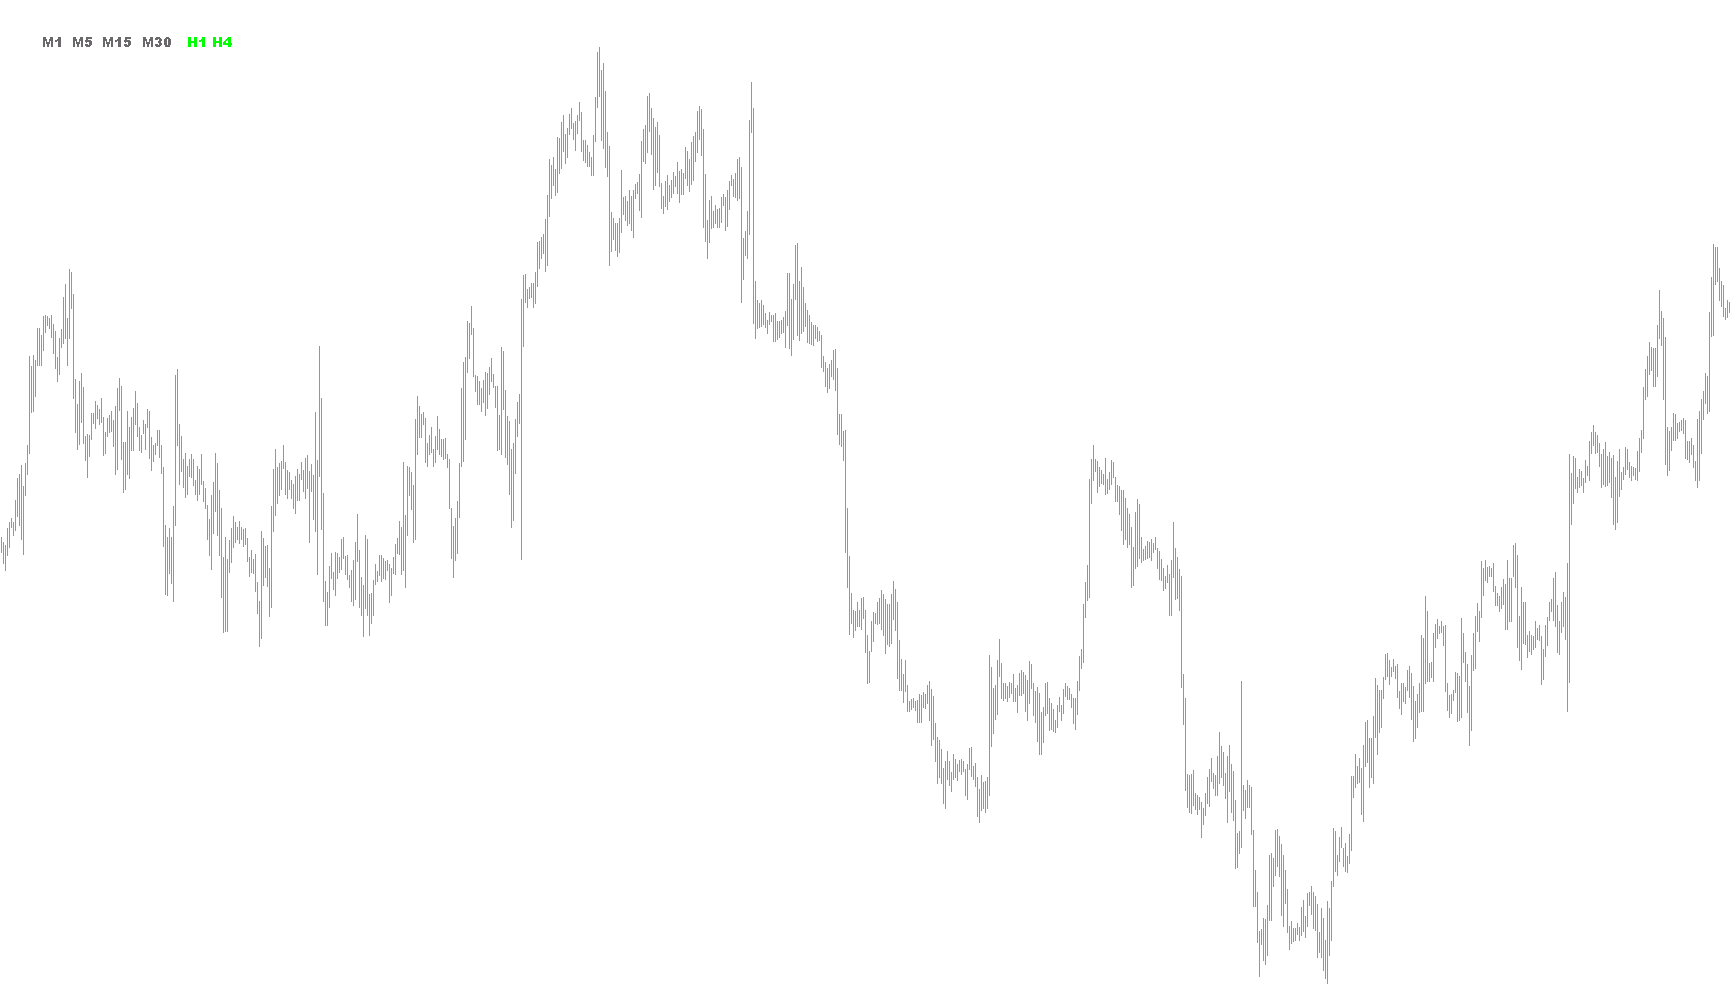
This script is designed to provide a multi-timeframe visual summary of market momentum directly on your trading chart. Instead of forcing you to switch between different timeframes manually to check the current trend, it gathers that data automatically and displays it as a series of color-coded indicators.
Core Functionality
The tool monitors six specific timeframes simultaneously: M1, M5, M15, M30, H1, and H4. For each of these timeframes, the script analyzes three distinct technical components to determine the "health" of the market movement:
- Moving Average Crossings: It compares two different types of moving averages (EMA). Specifically, it looks at whether the short-term price trend is staying above or below a longer-term baseline.
- RSI (Relative Strength Index): This measures the speed and change of price movements. The script checks if the momentum is in bullish territory (above 50) or bearish territory (below 50).
- CCI (Commodity Channel Index): This identifies whether an asset is overbought, oversold, or trending strongly. It serves as a secondary confirmation for the direction of the price.
Visual Feedback Logic
The script translates these complex calculations into a simple, easy-to-read visual dashboard on your screen:
- Lime (Green): This color appears when all three conditions align to suggest an upward/bullish trend across that specific timeframe.
- Red: This color appears when all three conditions align to suggest a downward/bearish trend across that specific timeframe.
- Dim Gray: This is the "Neutral" state. It indicates that the indicators are conflicting or sideways, suggesting there is no clear trend at that moment.
User Benefit
By using this logic, you can see at a glance if the different timeframes are in harmony. For example, if all dots are Lime, the market is showing strong bullish agreement across all scales from 1 minute to 4 hours. If some are Red and others are Gray, it signals a complex market environment where the short-term moves may not align with the long-term trend.
//+------------------------------------------------------------------+
//|                                              Key to the mint.mq4 |
//|                                                   free84@aol.com |
//+------------------------------------------------------------------+

#property link "free84@aol.com"

#property indicator_chart_window

extern int EMA=5;// was 5
extern int EMA2=13;// was 13
extern int RSIv=13;// was 13
extern int CCIv=50;
extern int XDISTANCE=215;
extern int YDISTANCE=35;
double dTemp[7,2];

int init()
	{
		ObjectCreate("Dot1",OBJ_LABEL,0,0,0);
		ObjectSet("Dot1",OBJPROP_XDISTANCE,XDISTANCE);
		ObjectSet("Dot1",OBJPROP_YDISTANCE,YDISTANCE);
		ObjectSetText("Dot1","H4",10,"Arial Black",EMPTY_VALUE);

		ObjectCreate("Dot2",OBJ_LABEL,0,0,0);
		ObjectSet("Dot2",OBJPROP_XDISTANCE,XDISTANCE-25);
		ObjectSet("Dot2",OBJPROP_YDISTANCE,YDISTANCE);
		ObjectSetText("Dot2","H1",10,"Arial Black",EMPTY_VALUE);

		ObjectCreate("Dot3",OBJ_LABEL,0,0,0);
		ObjectSet("Dot3",OBJPROP_XDISTANCE,XDISTANCE-70);
		ObjectSet("Dot3",OBJPROP_YDISTANCE,YDISTANCE);
		ObjectSetText("Dot3","M30",10,"Arial Black",EMPTY_VALUE);

		ObjectCreate("Dot4",OBJ_LABEL,0,0,0);
		ObjectSet("Dot4",OBJPROP_XDISTANCE,XDISTANCE-110);
		ObjectSet("Dot4",OBJPROP_YDISTANCE,YDISTANCE);
		ObjectSetText("Dot4","M15",10,"Arial Black",EMPTY_VALUE);

		ObjectCreate("Dot5",OBJ_LABEL,0,0,0);
		ObjectSet("Dot5",OBJPROP_XDISTANCE,XDISTANCE-140);
		ObjectSet("Dot5",OBJPROP_YDISTANCE,YDISTANCE);
		ObjectSetText("Dot5","M5",10,"Arial Black",EMPTY_VALUE);

		ObjectCreate("Dot6",OBJ_LABEL,0,0,0);
		ObjectSet("Dot6",OBJPROP_XDISTANCE,XDISTANCE-170);
		ObjectSet("Dot6",OBJPROP_YDISTANCE,YDISTANCE);
		ObjectSetText("Dot6","M1",10,"Arial Black",EMPTY_VALUE);

	}

int deinit()
	{
		ObjectDelete("Dot1");
		ObjectDelete("Dot2");
		ObjectDelete("Dot3");
		ObjectDelete("Dot4");
		ObjectDelete("Dot5");
		ObjectDelete("Dot6");

	}

int start()

	{
	 bool H4=true;
    bool H1=true;
    bool M30=true;
    bool M15=true;
    bool M5=true;
    bool M1=true;
		double RSIa, RSIb, CCIa,CCIb;
		int iIndicatorCounted=IndicatorCounted();
		if(iIndicatorCounted<0)
			{
				return(-1);
			}
		int iLimit=Bars-iIndicatorCounted;
		for(int i=iLimit;i>=0;i--)
			{
			if(M1)
					{
						dTemp[6,1]=iMA(NULL,PERIOD_M1,EMA2,0,MODE_EMA,PRICE_OPEN,i);
						dTemp[6,0]=iMA(NULL,PERIOD_M1,EMA,0,MODE_EMA,PRICE_CLOSE,i );
						RSIa = iRSI(NULL, 1, RSIv, PRICE_CLOSE, i );
						CCIa = iCCI(NULL, 1, CCIv, PRICE_CLOSE, i );
						if(dTemp[6,0]>dTemp[6,1] && RSIa > 50 && CCIa>50)
							{
								ObjectSet("Dot6",OBJPROP_COLOR,Lime);
							}
						else if(dTemp[6,0]<dTemp[6,1] && RSIa < 50&& CCIa<-50)
							{
								ObjectSet("Dot6",OBJPROP_COLOR,Red);
							}
						else
							{
								ObjectSet("Dot6",OBJPROP_COLOR,DimGray);
							}
					}
			if(M5)
					{
						dTemp[5,1]=iMA(NULL,PERIOD_M5,EMA2,0,MODE_EMA,PRICE_OPEN,i);
						dTemp[5,0]=iMA(NULL,PERIOD_M5,EMA,0,MODE_EMA,PRICE_CLOSE,i );
						RSIa = iRSI(NULL, 5, RSIv, PRICE_CLOSE, i );
						CCIa = iCCI(NULL, 5, CCIv, PRICE_CLOSE, i );
						if(dTemp[5,0]>dTemp[5,1] && RSIa > 50 && CCIa>50)
							{
								ObjectSet("Dot5",OBJPROP_COLOR,Lime);
							}
						else if(dTemp[5,0]<dTemp[5,1] && RSIa < 50&& CCIa<-50)
							{
								ObjectSet("Dot5",OBJPROP_COLOR,Red);
							}
						else
							{
								ObjectSet("Dot5",OBJPROP_COLOR,DimGray);
							}
					}
			if(M15)
					{
						dTemp[4,1]=iMA(NULL,PERIOD_M15,EMA2,0,MODE_EMA,PRICE_OPEN,i);
						dTemp[4,0]=iMA(NULL,PERIOD_M15,EMA,0,MODE_EMA,PRICE_CLOSE,i );
						RSIa = iRSI(NULL, 15, RSIv, PRICE_CLOSE, i );
						CCIa = iCCI(NULL, 15, CCIv, PRICE_CLOSE, i );
						if(dTemp[4,0]>dTemp[4,1] && RSIa > 50 && CCIa>50)
							{
								ObjectSet("Dot4",OBJPROP_COLOR,Lime);
							}
						else if(dTemp[4,0]<dTemp[4,1] && RSIa < 50&& CCIa<-50)
							{
								ObjectSet("Dot4",OBJPROP_COLOR,Red);
							}
						else
							{
								ObjectSet("Dot4",OBJPROP_COLOR,DimGray);
							}
					}
			if(M30)
					{
						dTemp[3,1]=iMA(NULL,PERIOD_M30,EMA2,0,MODE_EMA,PRICE_OPEN,i);
						dTemp[3,0]=iMA(NULL,PERIOD_M30,EMA,0,MODE_EMA,PRICE_CLOSE,i );
						RSIa = iRSI(NULL, 30, RSIv, PRICE_CLOSE, i );
						CCIa = iCCI(NULL, 30, CCIv, PRICE_CLOSE, i );
						if(dTemp[3,0]>dTemp[3,1] && RSIa > 50 && CCIa>50)
							{
								ObjectSet("Dot3",OBJPROP_COLOR,Lime);
							}
						else if(dTemp[3,0]<dTemp[3,1] && RSIa < 50&& CCIa<-50)
							{
								ObjectSet("Dot3",OBJPROP_COLOR,Red);
							}
						else
							{
								ObjectSet("Dot3",OBJPROP_COLOR,DimGray);
							}
					}
				if(H1)
					{
						dTemp[2,1]=iMA(NULL,PERIOD_H1,EMA2,0,MODE_EMA,PRICE_OPEN,i);
						dTemp[2,0]=iMA(NULL,PERIOD_H1,EMA,0,MODE_EMA,PRICE_CLOSE,i );
						RSIa = iRSI(NULL, 60, RSIv, PRICE_CLOSE, i );
						CCIa = iCCI(NULL, 60, CCIv, PRICE_CLOSE, i );
						if(dTemp[2,0]>dTemp[2,1] && RSIa > 50 && CCIa>50)
							{
								ObjectSet("Dot2",OBJPROP_COLOR,Lime);
							}
						else if(dTemp[2,0]<dTemp[2,1] && RSIa < 50&& CCIa<-50)
							{
								ObjectSet("Dot2",OBJPROP_COLOR,Red);
							}
						else
							{
								ObjectSet("Dot2",OBJPROP_COLOR,DimGray);
							}
					}
				if(H4)
					{
						dTemp[1,1]=iMA(NULL,PERIOD_H4,EMA2,0,MODE_EMA,PRICE_OPEN,i );
						dTemp[1,0]=iMA(NULL,PERIOD_H4,EMA,0,MODE_EMA,PRICE_CLOSE,i );
						RSIb = iRSI(NULL, 240, RSIv, PRICE_CLOSE, i);
						CCIb = iCCI(NULL, 240, CCIv, PRICE_CLOSE, i );

						if(dTemp[1,0]>dTemp[1,1] && RSIb > 50&& CCIb>50)
							{
								ObjectSet("Dot1",OBJPROP_COLOR,Lime);
							}
						else if(dTemp[1,0]<dTemp[1,1] && RSIb < 50&& CCIb<-50)
							{
								ObjectSet("Dot1",OBJPROP_COLOR,Red);
							}
						else
							{
								ObjectSet("Dot1",OBJPROP_COLOR,DimGray);
							}
					}

			}
	}
Comments