MMA color
Download script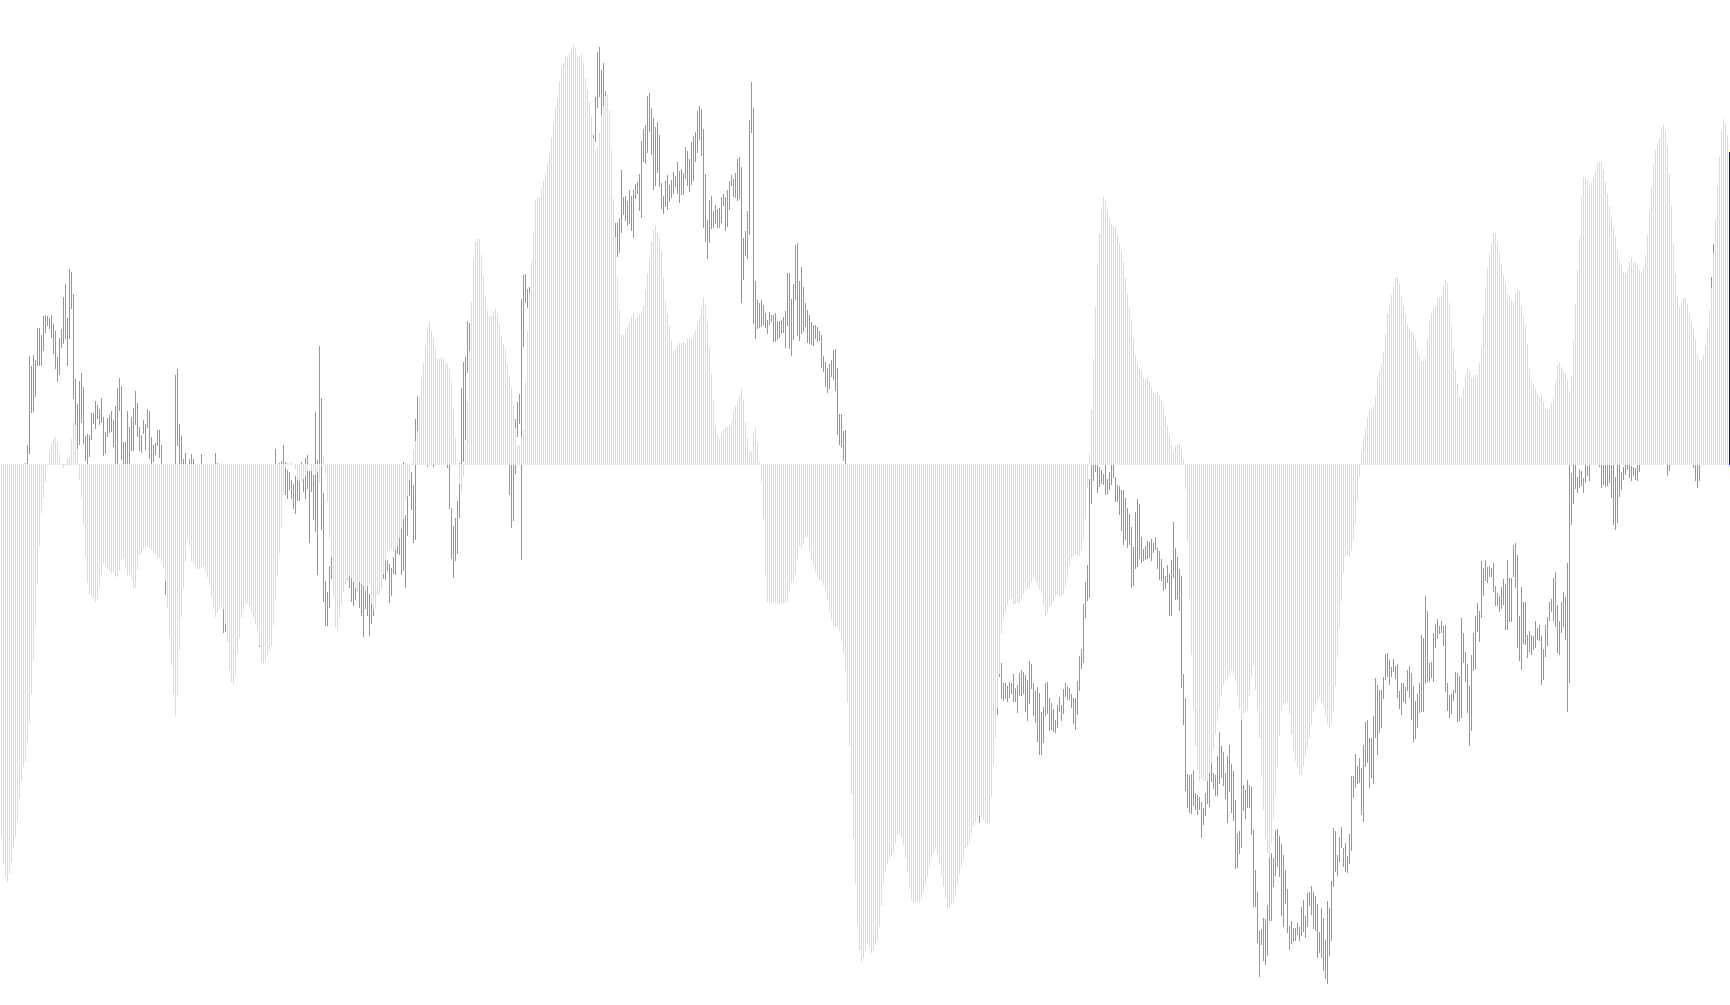
This script is designed as a visual trading tool that helps market participants identify trend momentum and shifts in price direction through a color-coded histogram. Instead of just showing a single moving average line, it calculates the difference between two averages to highlight the strength and "velocity" of the market.
How the Logic Works
1. The Core Calculation (Momentum Tracking) The tool operates by comparing two different Moving Averages (MA) at the same time:
- It looks at a standard moving average based on a timeframe you define (e.g., 120 periods).
- It then compares that value against a second moving average shifted slightly forward in time (based on your "Shift" setting).
- The result of this subtraction tells the user how much the price is pulling away from its recent average. This is similar to the logic used in momentum oscillators like the MACD, but customized for specific trends.
2. Dynamic Trend Detection Once the script calculates these values, it analyzes whether the momentum is increasing or decreasing. It doesn't just look at whether the number is positive or negative; it tracks the "flow" of the data:
- If the current momentum value is higher than the previous value (beyond a small threshold you set), the script identifies an upward trend.
- If the value drops lower than the previous one, it identifies a downward trend.
3. Visual Representation (The Color Logic) To make this easy to read at a glance, the script translates these mathematical trends into colors on your chart:
- Upward Momentum: When the trend is rising, the tool populates one part of the histogram, effectively creating a "growth" visual.
- Downward Momentum: When the trend starts to drop, the script switches the data to a different buffer, creating a contrasting visual.
Key Customizations
The logic allows you to fine-tune how these trends are calculated by adjusting several professional parameters:
- Moving Average Type: You can choose between Simple (SMA), Exponential (EMA), Smoothed (SMMA), or Linear Weighted (LWMA) averages depending on how much weight you want to give to recent price action.
- Price Source: You can decide which price data point the average should be based on, such as the Close price, High/Low extremes, or even a Median price.
- Sensitivity: There is a built-in "filter" (Sensit) that prevents the colors from flickering back and forth during tiny, insignificant price wiggles, ensuring that only meaningful trend changes are displayed.
In short, this script takes complex moving average math and turns it into a clear, color-coded visual history of market momentum, allowing you to see at a glance whether the current trend is gaining strength or starting to fade.
//+------------------------------------------------------------------+
//|                                                    MMA color.mq4 |
//|                                 Copyright © 2006, Rustem Bigeev. |
//|                                              http://www.parch.ru |
//+------------------------------------------------------------------+
//---- indicator settings
#property  indicator_separate_window
#property  indicator_buffers 3
#property  indicator_color1  Black
#property  indicator_color2  Blue
#property  indicator_color3  Red

//---- indicator buffers
double     ExtBuffer0[];
double     ExtBuffer1[];
double     ExtBuffer2[];

extern int PeriodMA=120;
extern int TypeMA=1;
extern string Mode1_ = "0 - MODE_SMA  Ïðîñòîå ñêîëüçÿùåå ñðåäíåå ";
extern string Mode2_ = "1 - MODE_EMA  Ýêñïîíåíöèàëüíîå ñêîëüçÿùåå ñðåäíåå ";
extern string Mode3_ = "2 - MODE_SMMA Ñãëàæåííîå ñêîëüçÿùåå ñðåäíåå ";
extern string Mode4_ = "3 - MODE_LWMA  Ëèíåéíî-âçâåøåííîå ñêîëüçÿùåå ñðåäíåå ";

extern int PriceMA=4;
extern string Price1_ = "0 - PRICE_CLOSE    Öåíà çàêðûòèÿ";
extern string Price2_ = "1 - PRICE_OPEN     Öåíà îòêðûòèÿ";
extern string Price3_ = "2 - PRICE_HIGH     Öåíà ìàêñèìóìà";
extern string Price4_ = "3 - PRICE_LOW      Öåíà ìèíèìóìà" ;
extern string Price5_ = "4 - PRICE_MEDIAN   Öåíà ñåðåäèíû" ;
extern string Price6_ = "5 - PRICE_TYPICAL  Öåíà òèïè÷åñêàÿ";
extern string Price7_ = "6 - PRICE_WEIGHTED Öåíà âçâåøåííàÿ" ;
extern int Shift=6;

extern double Sensit=0.0001;
//+------------------------------------------------------------------+
//| Custom indicator initialization function                         |
//+------------------------------------------------------------------+
int init()
  {
   //---- drawing settings
   SetIndexStyle(0,DRAW_NONE);
   SetIndexStyle(1,DRAW_HISTOGRAM);
   SetIndexStyle(2,DRAW_HISTOGRAM);
   IndicatorDigits(Digits+1);
   SetIndexDrawBegin(0,34);
   SetIndexDrawBegin(1,34);
   SetIndexDrawBegin(2,34);
//---- 3 indicator buffers mapping
   SetIndexBuffer(0,ExtBuffer0);
   SetIndexBuffer(1,ExtBuffer1);
   SetIndexBuffer(2,ExtBuffer2);
//---- name for DataWindow and indicator subwindow label
   IndicatorShortName("MMA color("+PeriodMA+", "+Shift+", "+TypeMA+", "+PriceMA+", "+Sensit+")");
   SetIndexLabel(1,NULL);
   SetIndexLabel(2,NULL);
//---- initialization done
   return(0);
  }


//+------------------------------------------------------------------+
//| Awesome Oscillator                                               |
//+------------------------------------------------------------------+
int start()
  {
   int    limit;
   int    counted_bars=IndicatorCounted();
   double prev,current;
//---- last counted bar will be recounted
   if(counted_bars>0) counted_bars--;
   limit=Bars-counted_bars;
//---- macd
   for(int i=0; i<limit; i++)
      ExtBuffer0[i]=iMA(NULL,0,PeriodMA,1,TypeMA,PriceMA,i)-iMA(NULL,0,PeriodMA,1,TypeMA,PriceMA,i+Shift);
//---- dispatch values between 2 buffers
   bool up=true;
   for(i=limit-1; i>=0; i--)
     {
      current=ExtBuffer0[i];
      prev=ExtBuffer0[i+1];
      if(current>prev+Sensit) up=true;
      if(current<prev-Sensit) up=false;
      if(!up)
        {
         ExtBuffer2[i]=current;
         ExtBuffer1[i]=0.0;
        }
      else
        {
         ExtBuffer1[i]=current;
         ExtBuffer2[i]=0.0;
        }
     }
//---- done
   return(0);
  }
Comments