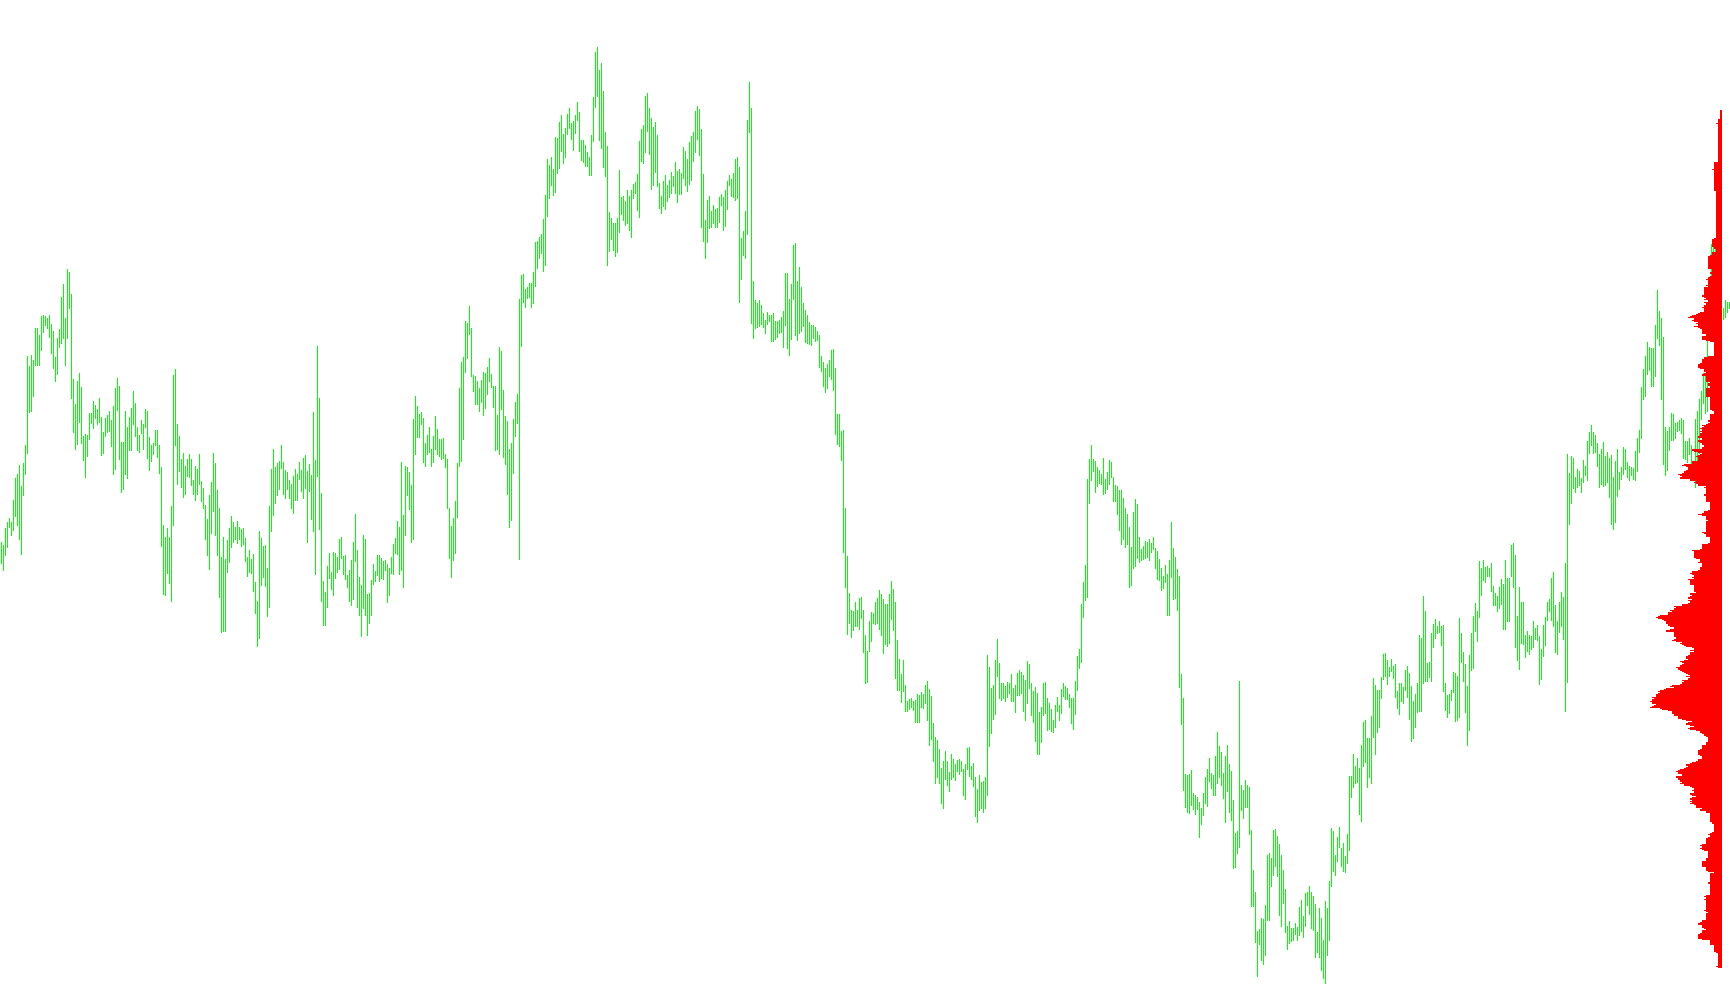
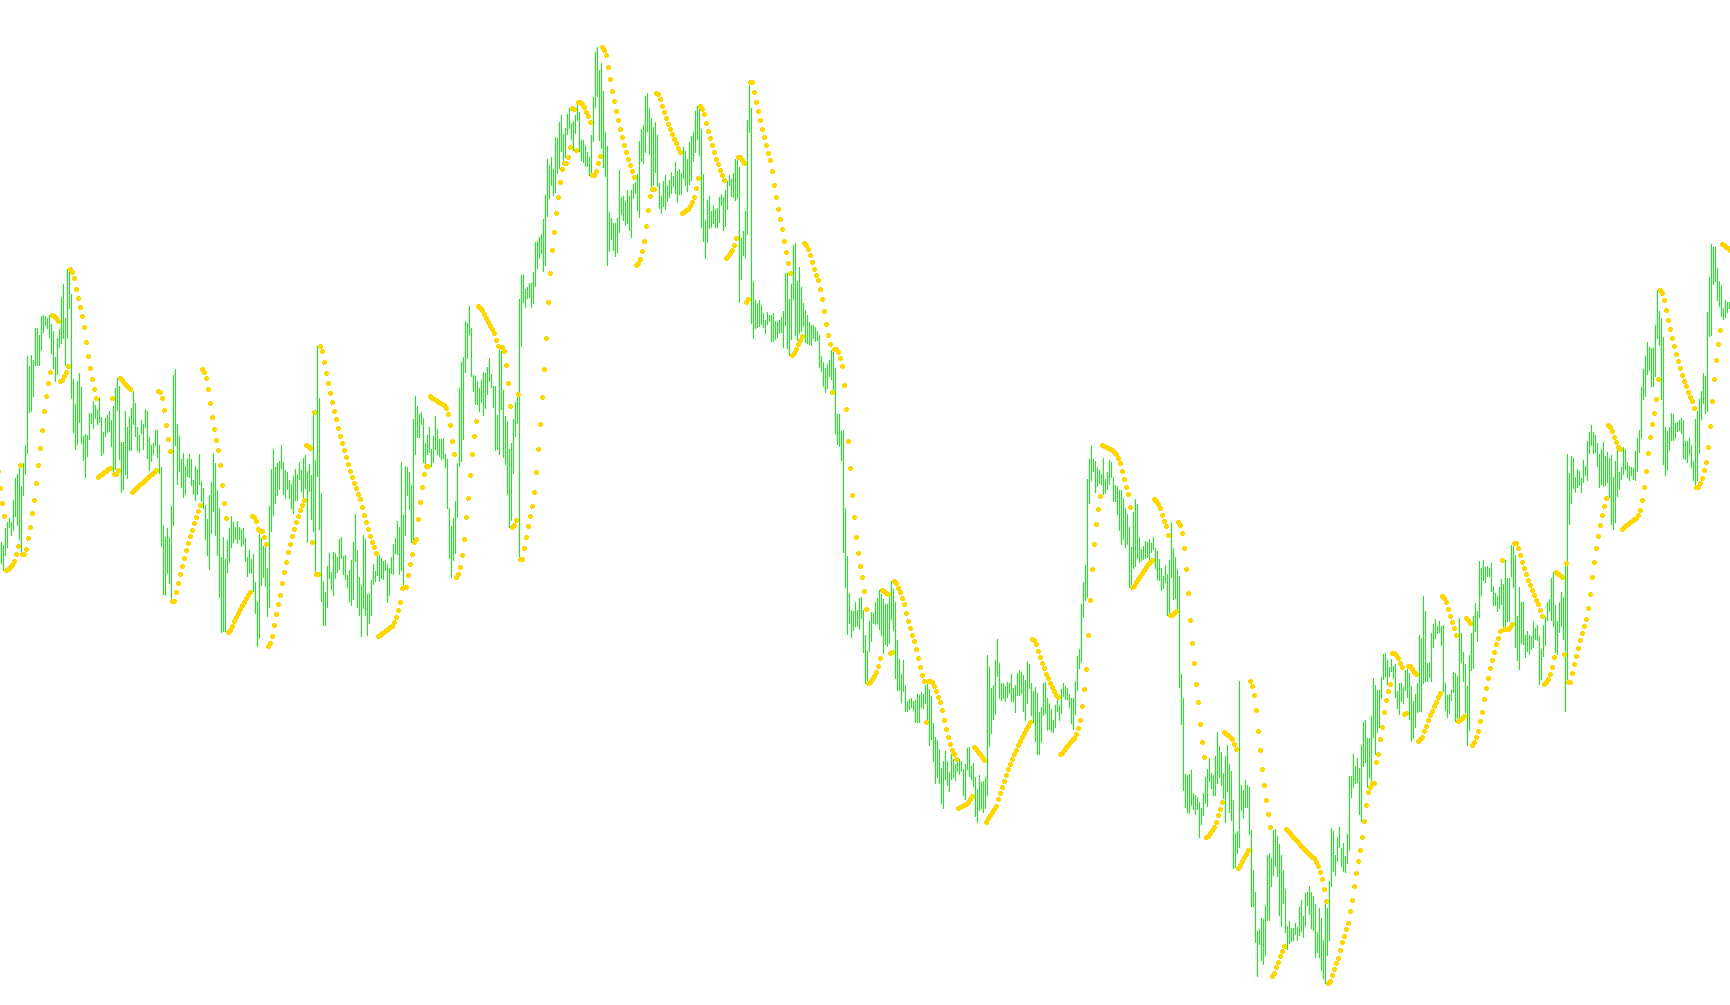
Momentum-Multi.mod
Indicator

Momentum-Multi.mod

iMomentum

This indicator visualizes eight distinct momentum oscillators simultaneously, applying a -100 offset to center the readings around a zero baseline for multi-period trend synchronization.

Momentum-ZL
Indicator

Momentum-ZL

iMomentum

This indicator calculates the rate of change between the current closing price and the price from a specific period, normalized by subtracting a 100-point offset to evaluate velocity relative to a zero-baseline.

Momentum
Indicator

Momentum

This indicator quantifies market strength by calculating the percentage change between the current closing price and the price from a fixed historical period.

MomentumVT alert
Indicator

MomentumVT alert

This indicator quantifies price velocity by calculating the arithmetic variance between current closing prices and those from a fixed historical interval.

MomentumVT
Indicator

MomentumVT

Calculates the absolute price displacement between the current closing rate and the close from a specific historical interval to quantify trend intensity.

MomentumVT_alert
Indicator

MomentumVT_alert

This indicator calculates the raw price variance between current closing prices and a specified historical lag to identify momentum shifts crossing the zero equilibrium.

MomentumVT_alertOC
Indicator

MomentumVT_alertOC

This indicator measures the raw price displacement over a specific lookback window to identify immediate shifts in directional velocity and zero-line crossovers.

Momentum_v1
Indicator

Momentum_v1

This indicator quantifies the magnitude of price displacement by calculating the percentage ratio between the current closing price and the closing price from a fixed historical lookback period.

MonthlyPivot
Indicator

MonthlyPivot

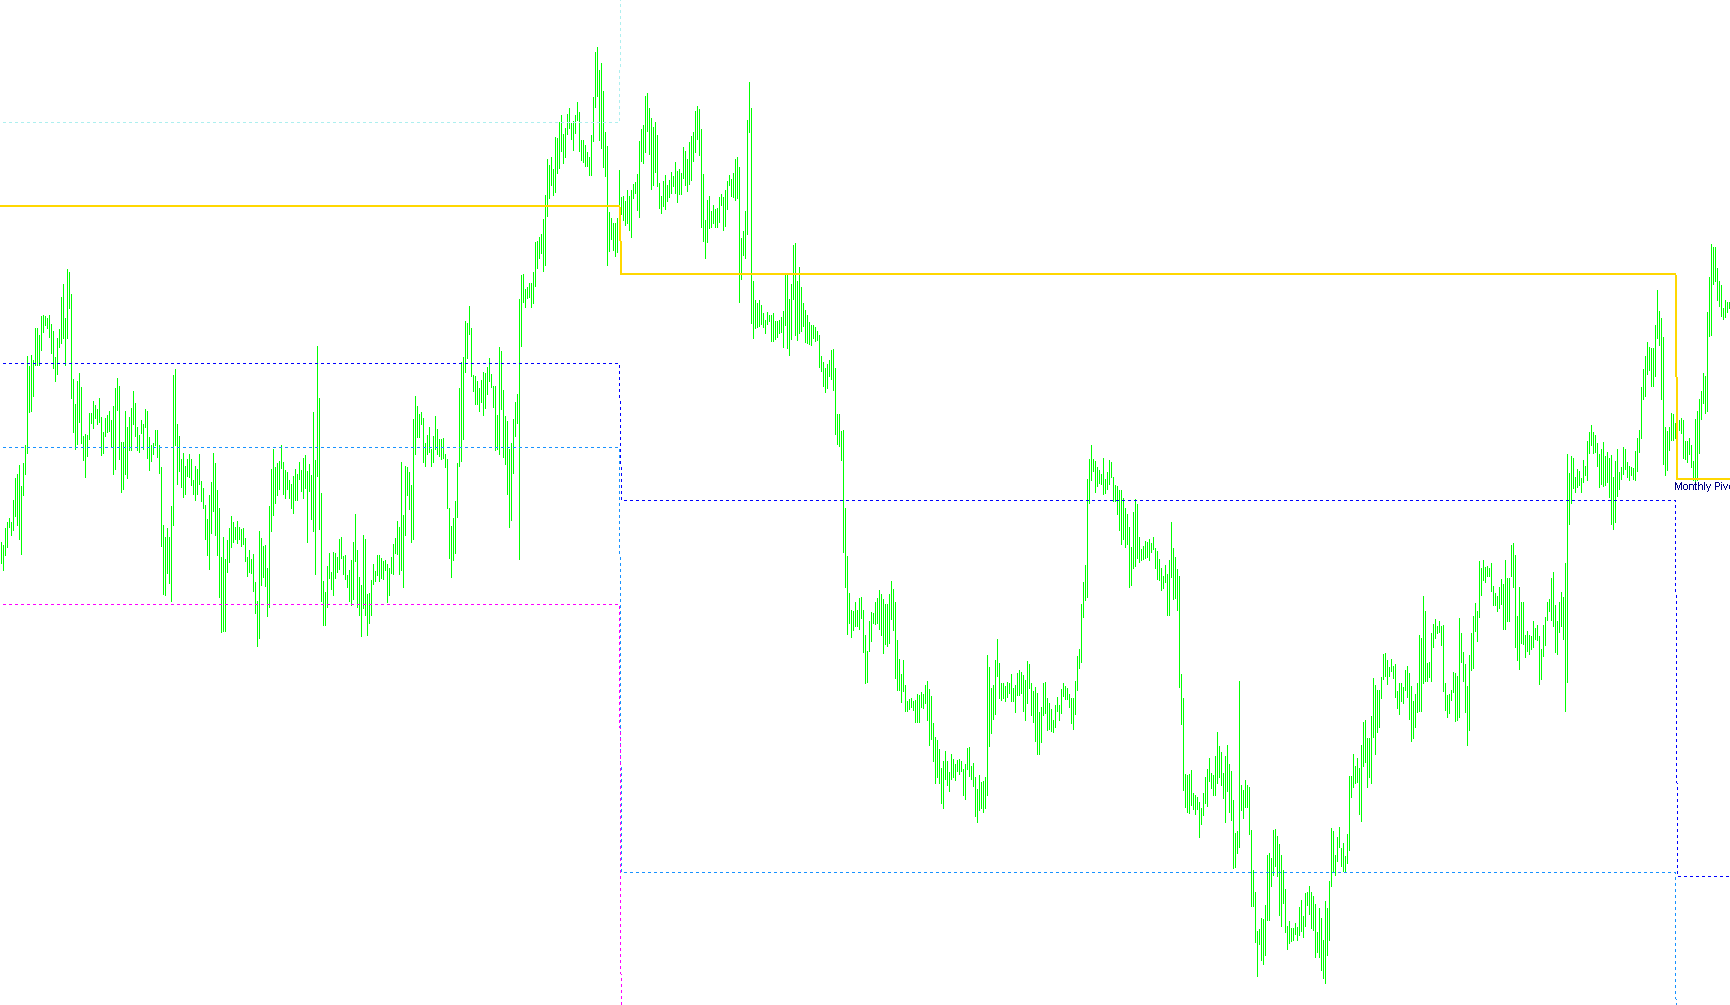
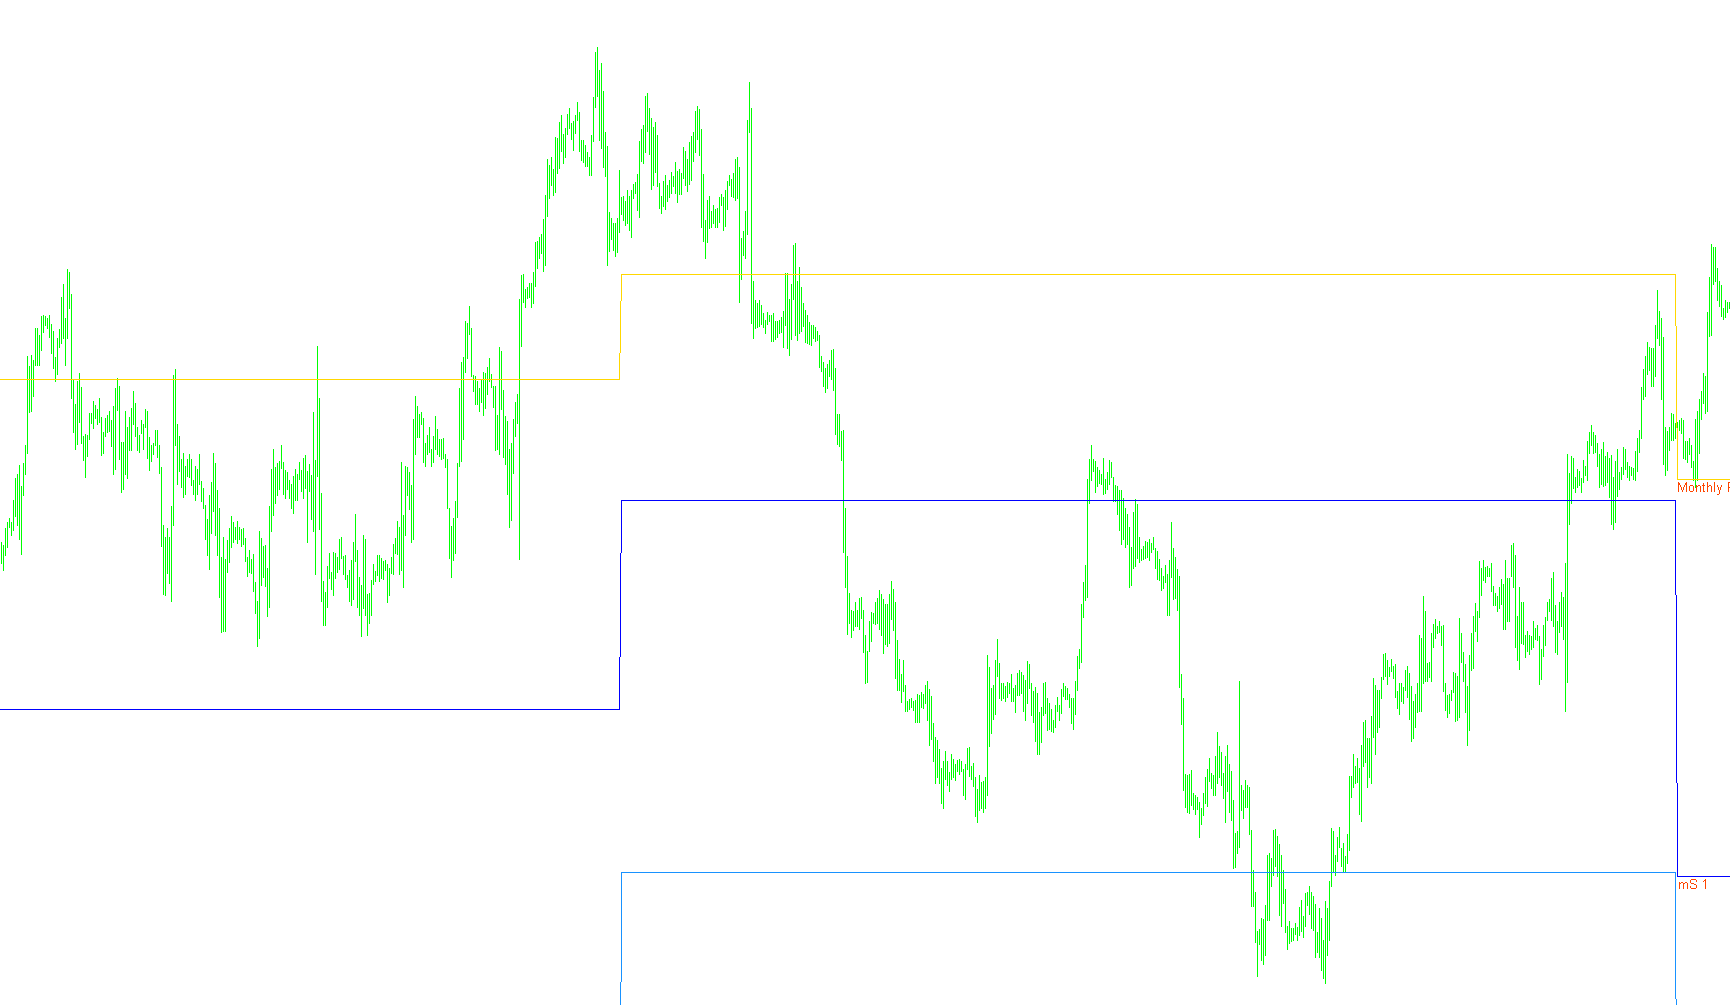
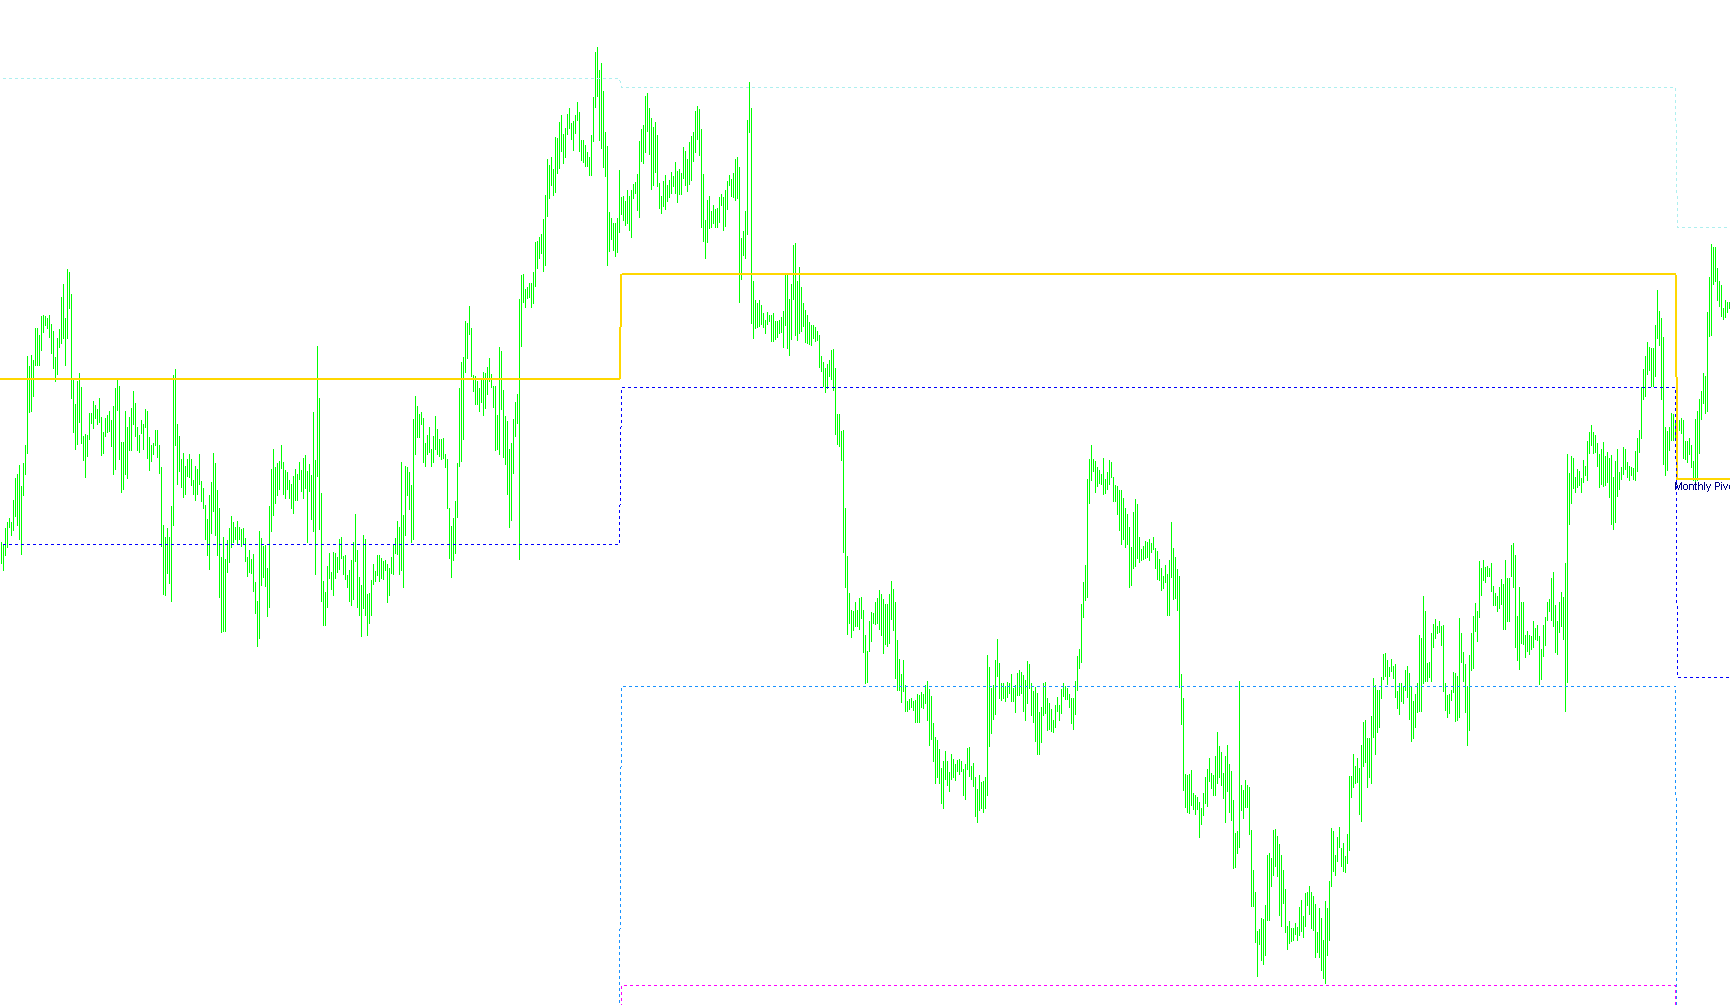
This indicator calculates multi-level monthly support and resistance zones by synthesizing the previous month's range extremes with the current month's opening equilibrium.

MonthlyPivot_001
Indicator

MonthlyPivot_001

Calculates dynamic monthly support and resistance levels based on the geometric mean of the preceding month's range and current open price.

MonthlyPivot_mids
Indicator

MonthlyPivot_mids

Calculates dynamic monthly support and resistance levels by synthesizing previous period extremes with current opening price dynamics.

MoonPhases
Indicator

MoonPhases

This indicator calculates and visualizes specific lunar phases on the chart by applying quadratic orbital equations to identify precise full and new moon timestamps.

MoR
Indicator

MoR

iMAOnArrayiRSI

This indicator synthesizes momentum by calculating the percentage ratio between two moving averages derived from the RSI values to identify trend strength and exhaustion.

MorningFlat
Indicator

MorningFlat

Identifies the price range of early morning fluctuations to project extended Fibonacci-based reversal targets and boundary channels.

MorningFlat[1]
Indicator

MorningFlat[1]

Identifies the high and low boundaries of a specific morning trading window to project potential price extension targets based on Fibonacci expansion ratios.

Indicator

Morning_Fibonacci_v_1

Indicator

Morning_Fibonacci_v_1_1[1]

Indicator

MoR_MTF_Test

iMAOnArrayiRSI
MoR_v1
Indicator

MoR_v1

iMAOnArrayiRSI

This indicator calculates a dynamic momentum ratio by dividing two different moving averages derived from the Relative Strength Index.

Mouteki Heart-Mono v1
Indicator

Mouteki Heart-Mono v1

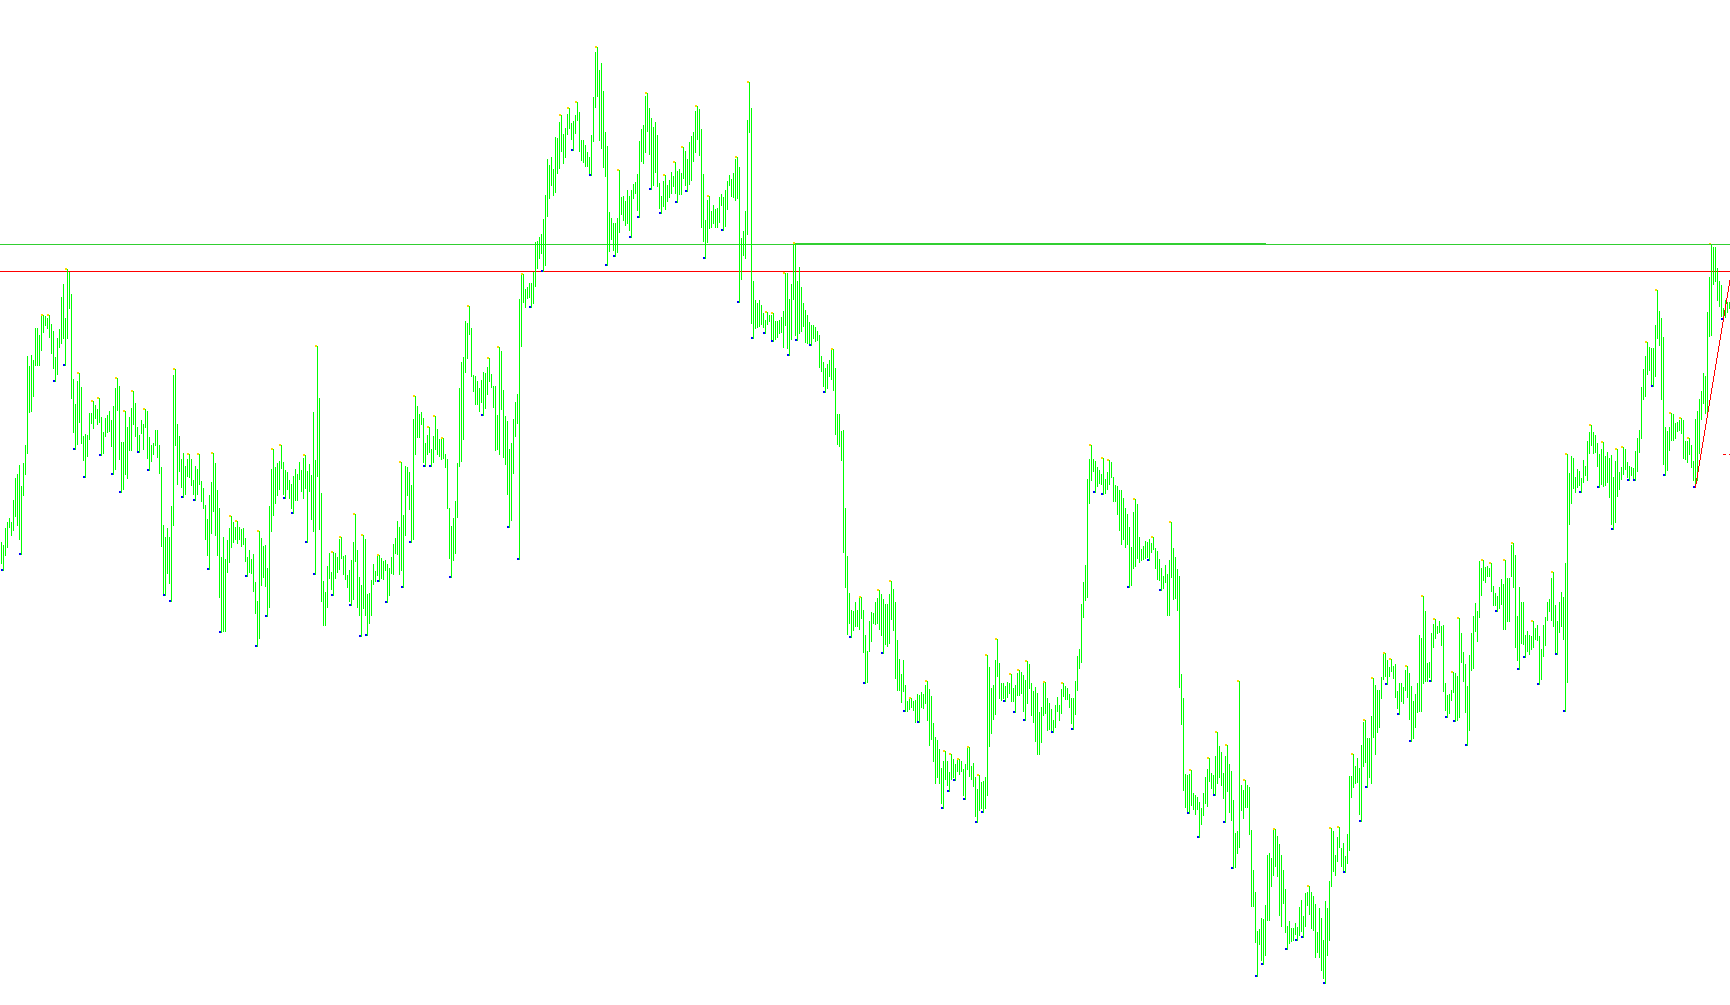
This indicator identifies structural pivot points to project linear trend trajectories and calculate potential breakout price targets based on geometric expansion.

Mouteki Heart-Mono v1_v1
Indicator

Mouteki Heart-Mono v1_v1

An advanced technical analysis tool that identifies TD points to construct dynamic trendlines and calculate mathematical price projection targets for breakout reversals.

Mouteki Heart-Mono v1_v2
Indicator

Mouteki Heart-Mono v1_v2

This indicator identifies and projects trendline breaks using TD points to calculate objective price targets and visual break-out alerts.

Mouteki Heart-Mono v2
Indicator

Mouteki Heart-Mono v2

Identifies trend reversal points using Triple Dragon (TD) logic to project linear price targets and execute automated alerts upon trendline breaches.

Mouteki Heart-Mono v2_v1
Indicator

Mouteki Heart-Mono v2_v1

This indicator identifies Trend Drawing (TD) points to plot geometric trendlines and calculate automated price projection targets based on structural breaks.

Mouteki-Demark_trend_new
Indicator

Mouteki-Demark_trend_new

This indicator identifies structural trend lines and breakout levels using DeMark theory to project potential price targets and provide breakout qualifiers.

Mouteki-Demark_trend_new_v1
Indicator

Mouteki-Demark_trend_new_v1

This indicator identifies structural trend reversals by calculating DeMark pivot points and detecting high-probability breakout 'hitches' against dynamic trendlines.

Mouteki-Demark_trend_new_v2
Indicator

Mouteki-Demark_trend_new_v2

This indicator identifies trend reversals and breakout opportunities by projecting linear price trajectories from Demark pivots, complete with automatic target levels and breakout qualificators.

Mouteki
Indicator

Mouteki

This indicator identifies TD sequential pivot points to dynamically project trendline breaks and calculate potential price targets based on geometric expansion.

move sl 10
Indicator

move sl 10

The script iteratively scans open positions to recalibrate stop-loss levels by maintaining a fixed pip offset from the current market price.

move sl 20
Indicator

move sl 20

Automatically adjusts active trade stop-loss levels to maintain a consistent 20-point buffer from the current market price for both long and short positions.

move sl 5
Indicator

move sl 5

This script iterates through active positions to automatically adjust Stop Loss levels to a fixed point offset from the market price once an entry is established.

Moving Averages   Lower Window
Indicator

Moving Averages Lower Window

This indicator computes various types of moving averages—Simple, Exponential, Smoothed, and Linear Weighted—to filter market noise and visualize price trends.

Moving Averages   Lower Window_v1
Indicator

Moving Averages Lower Window_v1

A versatile technical analysis tool that calculates and displays SMA, EMA, SMMA, and LWMA trajectories to identify price momentum and trend directionality.

Moving Averages Advance
Indicator

Moving Averages Advance

This indicator calculates various moving average types and projects them onto the chart with a customizable forward temporal displacement.
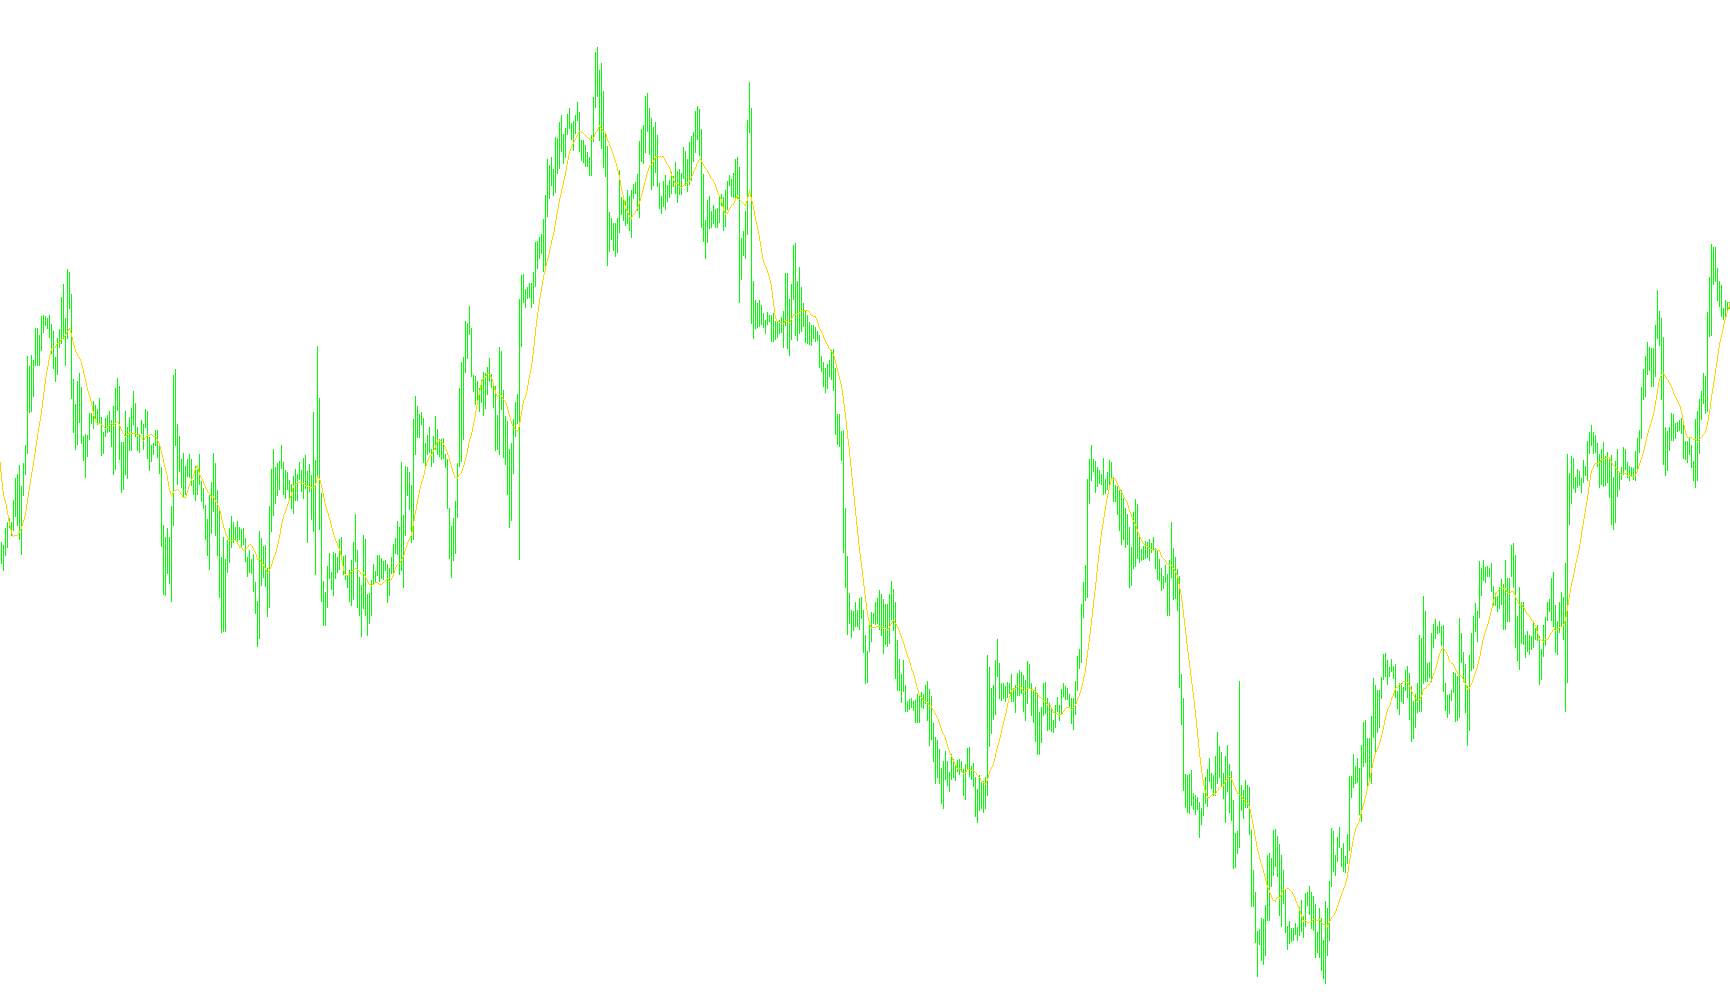
Moving Averages.
Indicator

Moving Averages.

This indicator computes four distinct types of moving averages—Simple, Exponential, Smoothed, and Linear Weighted—to visualize price trends through various mathematical weighting models.

Moving Averages
Indicator

Moving Averages

This indicator dynamically computes four distinct types of moving averages—Simple, Exponential, Smoothed, and Linear Weighted—to provide versatile price trend filtering based on user-defined weight parameters.

Moving Averages2
Indicator

Moving Averages2

This indicator provides a versatile technical analysis tool that dynamically switches between SMA, EMA, SMMA, and LWMA calculations to evaluate price momentum.

Moving Averages_onTF
Indicator

Moving Averages_onTF

iMA

This indicator projects a selected moving average from a higher time frame onto the current chart to facilitate macro-trend identification.

Moving Averages_onTF_v1
Indicator

Moving Averages_onTF_v1

iMA

This indicator projects a calculated moving average from a higher temporal resolution onto the current chart to identify long-term trend dynamics.

Moving Averages_v1
Indicator

Moving Averages_v1

This indicator calculates four distinct types of moving averages—Simple, Exponential, Smoothed, and Linear Weighted—to visualize price trends based on user-defined weighting and smoothing algorithms.

Moving-Averages+Ray-1
Indicator

Moving-Averages+Ray-1

This indicator calculates four types of moving averages and projects a dynamic trend ray from the most recent price data to visualize immediate momentum.

Moving-Averages+Ray-1_001
Indicator

Moving-Averages+Ray-1_001

This indicator calculates various moving average types and projects a visual trend ray from the previous candle's value to the current price point.

moving-moving_v1.21s
Indicator

moving-moving_v1.21s

This indicator calculates and normalizes the relative strength of major currency pairs by computing a geometric mean and scaling it against historical peaks.

MovingAverages1.1
Indicator

MovingAverages1.1

A versatile technical indicator that computes and visualizes four distinct moving average methodologies—Simple, Exponential, Smoothed, and Linear Weighted—to identify underlying price momentum.

MovingAverages1.1_001
Indicator

MovingAverages1.1_001

A versatile technical indicator that computes four distinct moving average variations—Simple, Exponential, Smoothed, and Linear Weighted—with customizable visual labels and dynamic buffer mapping.

Movment
Indicator

Movment

This indicator identifies momentum shifts by detecting when price action breaches specific fractional point deviations from historical extremes within consecutive directional trends.

MP Overlay
Indicator

MP Overlay

This indicator identifies high-congestion price zones by calculating the frequency of candle body overlaps across a specified historical range and visualizing them as horizontal trend segments.

MP Overlay_v1
Indicator

MP Overlay_v1

This indicator quantifies historical price action by mapping the frequency of bar coverage across a defined vertical range to identify high-liquidity zones.

MP Overlay_v2
Indicator

MP Overlay_v2

This indicator visualizes price concentration by plotting horizontal trend lines that represent the frequency of overlap between historical candle bodies within a specified range.

mParabolic
Indicator

mParabolic

This algorithm calculates a recursive parabolic reversal level that adjusts its acceleration based on price extremes to identify structural trend shifts.