mj_RSIFilter_v1.0
Download script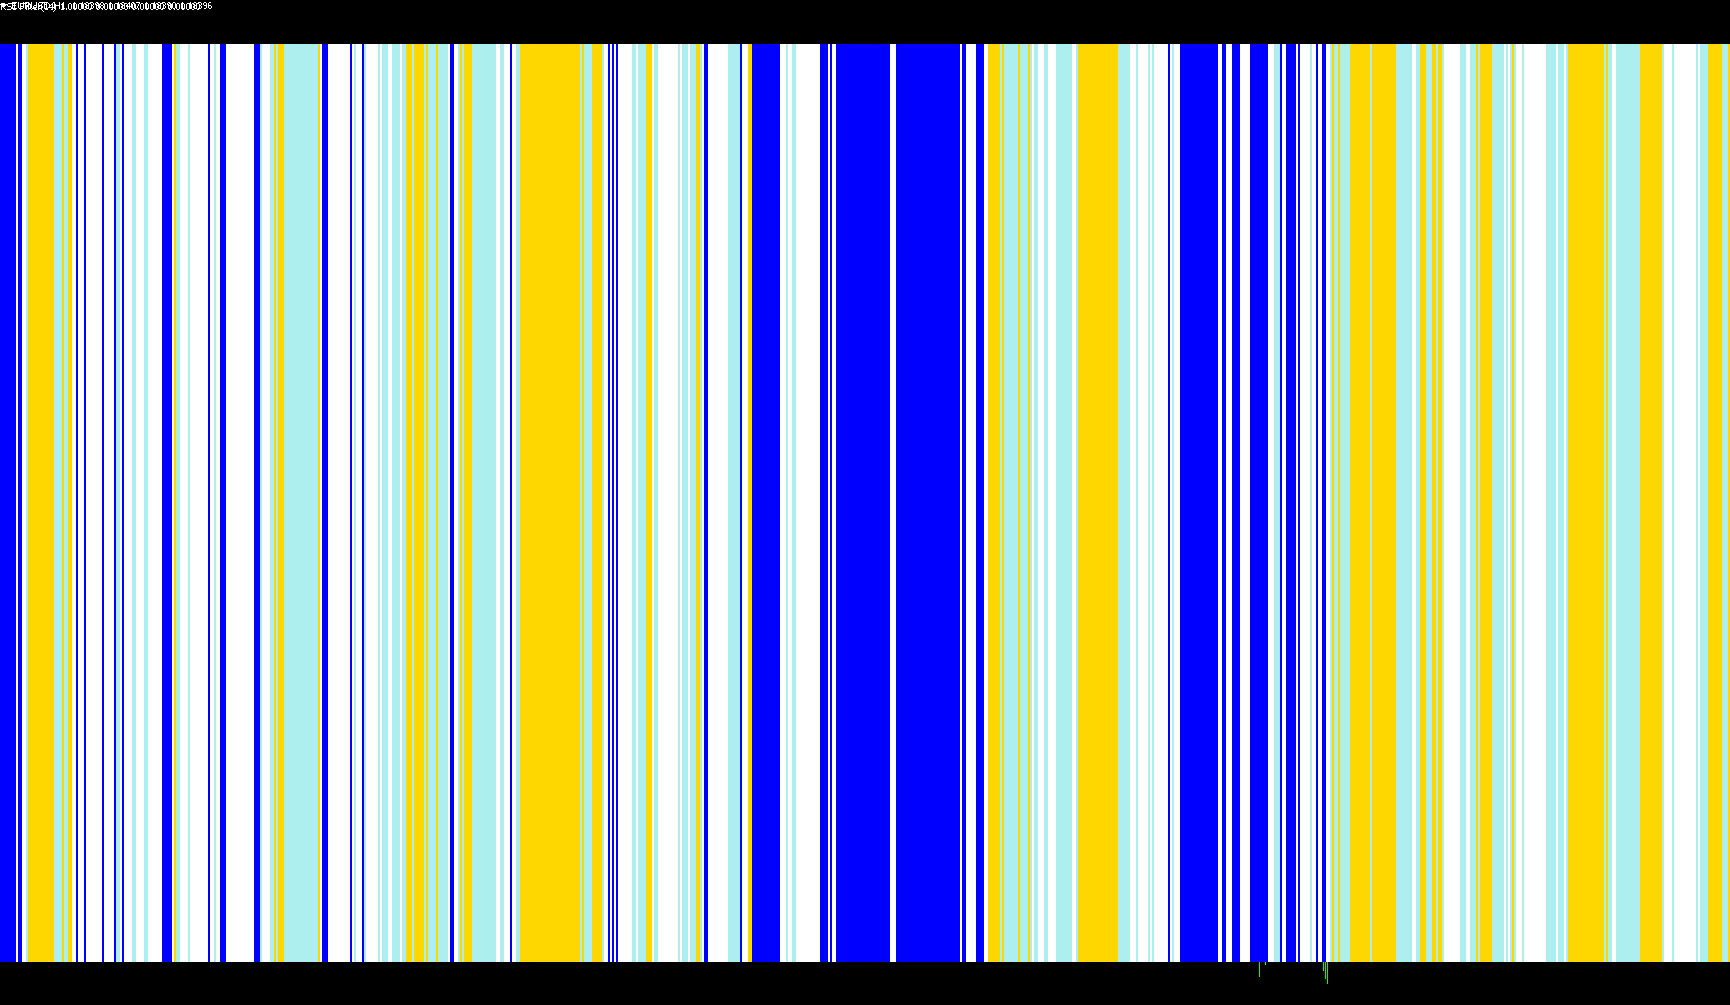
This tool is designed to act as a visual filter for traders, helping them identify the current strength and direction of market momentum by analyzing the Relative Strength Index (RSI). Instead of providing a single line, it categorizes market conditions into four distinct "zones," allowing you to see at a glance whether the trend is aggressive, mild, bullish, or bearish.
How the Logic Works
The script continuously monitors the RSI value—a common technical indicator that measures the speed and change of price movements. It then sorts these readings into four specific categories based on their numerical position:
- Strong Upward Trend: When the momentum is high (specifically when the RSI exceeds 60), the tool highlights a primary upward trend.
- Mild Upward Trend: When the momentum is positive but less aggressive (falling between 50 and 60), it identifies a secondary, softer move upward.
- Mild Downward Trend: When the momentum is cooling off but still holds some strength (falling between 40 and 50), the tool flags a soft downward movement.
- Strong Downward Trend: When the momentum drops significantly (falling below 40), it highlights a primary downward trend.
Visual Representation
To make this data easy to read, the script translates these four categories into a color-coded histogram in a separate window on your chart:
- UpTrend: Represents strong buying pressure.
- DownTrend: Represents strong selling pressure.
- Mild UpTrend: Indicates a steady but less intense move upward.
- Mild DownTrend: Indicates a steady but less intense move downward.
By using this logic, the indicator removes the "noise" of constant price fluctuations and provides a clearer picture of whether the market is leaning toward a major push in one direction or simply drifting with moderate momentum.
//+------------------------------------------------------------------+
//|                                                 mj_RSIFilter.mq4 |
//|                                  Copyright © 2007, Forex-TSD.com |
//|                                               Written by mj_bolt |
//|                                                                  |
//+------------------------------------------------------------------+
#property copyright "Copyright © 2007, Forex-TSD.com "
#property link      "http://www.forex-tsd.com/"

#property indicator_separate_window
#property indicator_minimum -0.05
#property indicator_maximum 1.05
#property indicator_buffers 4
#property indicator_color1 Blue
#property indicator_color2 Red
#property indicator_color3 LightBlue
#property indicator_color4 LightCoral


//---- input parameters
extern int PeriodRSI=14;
//---- indicator buffers
double UpBuffer1[];
double DnBuffer1[];
double UpBuffer2[];
double DnBuffer2[];
//+------------------------------------------------------------------+
//| Custom indicator initialization function                         |
//+------------------------------------------------------------------+
  int init()
  {
   string short_name;
//---- indicator line
   SetIndexStyle(0,DRAW_HISTOGRAM,STYLE_SOLID,2);
   SetIndexStyle(1,DRAW_HISTOGRAM,STYLE_SOLID,2);
   SetIndexStyle(2,DRAW_HISTOGRAM,STYLE_SOLID,2);
   SetIndexStyle(3,DRAW_HISTOGRAM,STYLE_SOLID,2);

   SetIndexBuffer(0,UpBuffer1);
   SetIndexBuffer(1,DnBuffer1);
   SetIndexBuffer(2,UpBuffer2);
   SetIndexBuffer(3,DnBuffer2);

   IndicatorDigits(MarketInfo(Symbol(),MODE_DIGITS));
//---- name for DataWindow and indicator subwindow label
   short_name="RSI Filter("+PeriodRSI+")";
   IndicatorShortName(short_name);
   SetIndexLabel(0,"UpTrend");
   SetIndexLabel(1,"DownTrend");
   SetIndexLabel(2,"Mild UpTrend");
   SetIndexLabel(3,"Mild DownTrend");

//----
   SetIndexDrawBegin(0,PeriodRSI);
   SetIndexDrawBegin(1,PeriodRSI);
   SetIndexDrawBegin(2,PeriodRSI);
   SetIndexDrawBegin(3,PeriodRSI);
//----
   return(0);
  }

//+------------------------------------------------------------------+
//| RSIFilter                                                         |
//+------------------------------------------------------------------+
int start()
  {
   int shift,trend;
   double RSI0;


   for(shift=Bars-PeriodRSI-1;shift>=0;shift--)
   {
   RSI0=iRSI(NULL,0,PeriodRSI,PRICE_CLOSE,shift);

	  if (RSI0>50 && RSI0<60)  trend=1;
	  if (RSI0>60)  trend=2;
	  if (RSI0<50 && RSI0>40) trend=-1;
	  if (RSI0<40)  trend=-2;

	  if (trend==1)
	  {

	  UpBuffer1[shift]=0;
	  UpBuffer2[shift]=1;
	  DnBuffer1[shift]=0;
	  DnBuffer2[shift]=0;

	  }
	  if (trend==2)
	  {

	  UpBuffer1[shift]=1;
	  UpBuffer2[shift]=0;
	  DnBuffer1[shift]=0;
	  DnBuffer2[shift]=0;

	  }
	  if (trend==-1)
	  {

	  UpBuffer1[shift]=0;
	  UpBuffer2[shift]=0;
	  DnBuffer1[shift]=0;
	  DnBuffer2[shift]=1;
	  }

	  if (trend==-2)
	  {

	  UpBuffer1[shift]=0;
	  UpBuffer2[shift]=0;
	  DnBuffer1[shift]=1;
	  DnBuffer2[shift]=0;

	  }
	}
	return(0);
 }
Comments