MLS-HL4-Angle
Download script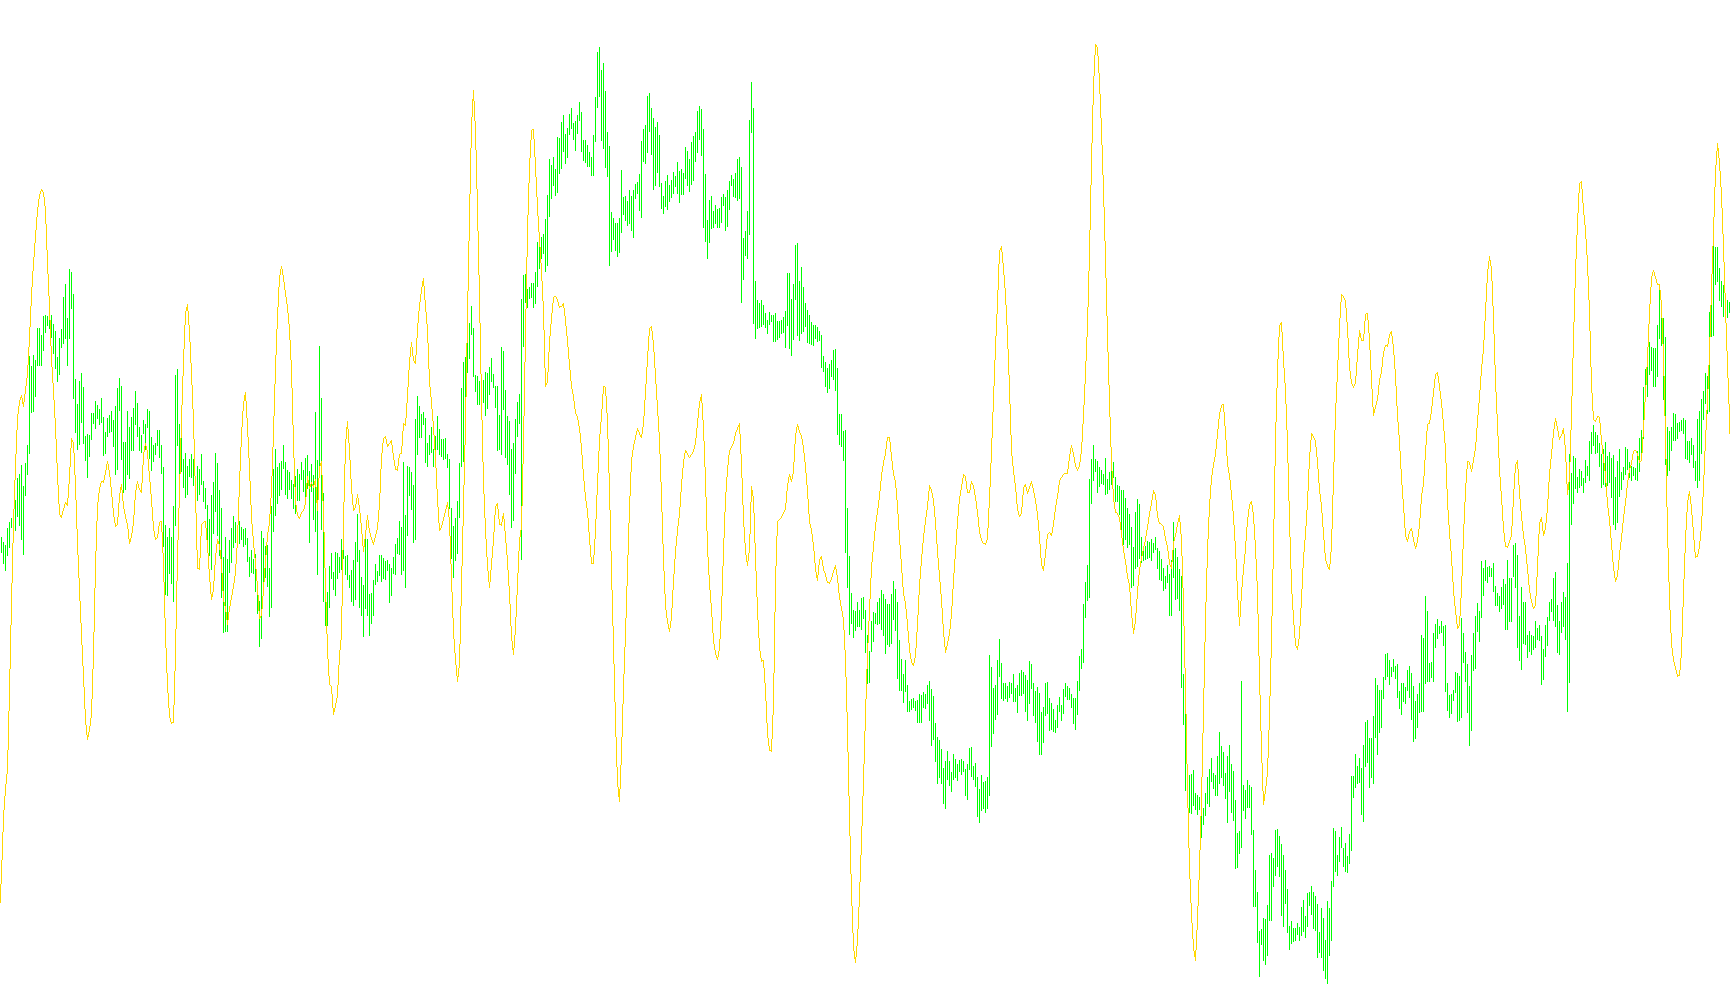
This script, known as MLS-HL4, is a technical analysis tool designed to help traders identify the strength and direction of a market trend by analyzing price movements. Instead of simply looking at the current price, it uses a mathematical approach called the "Method of Least Squares" to determine how consistently the price is moving over a specific period.
Core Logic and Purpose
The primary goal of this script is to measure the stability of a trend. It looks at both the high and low points of price candles over a user-defined number of bars (the "Period"). By analyzing these extremes, the script attempts to find the "line of best fit"—essentially drawing a straight line through the price action that minimizes the distance between the line and the actual highs and lows.
How It Works
The logic can be broken down into three main conceptual steps:
- Data Collection: The script scans back over a set number of candles (determined by the
MyPeriodsetting). For every candle in that timeframe, it gathers the highest price (High) and the lowest price (Low). - Trend Calculation: It performs a mathematical calculation to find the slope of the trend. If the highs and lows are moving upward in a relatively steady fashion, the calculated slope will reflect a positive trend. If they are moving downward steadily, it reflects a negative trend.
- Stability Analysis: The most important aspect of this logic is its focus on "uniformity." The script interprets the resulting data to determine if the market is moving confidently. If the price fluctuations stay within a certain angle relative to a horizontal line, it suggests that the trend is developing steadily and reliably.
Visual Output and Behavior
- The Result: The indicator produces a value based on the calculated slope (the "a" coefficient in linear algebra). In simpler terms, it tells you how steeply and consistently the price is climbing or falling.
- Dynamic Updating: The script includes a "ReDraw" feature. When enabled, the calculation updates with every single tick of the market to provide real-time feedback. If disabled, the value remains fixed until a new candle is formed, which is useful for traders who prefer to see confirmed data rather than fluctuating live numbers.
Summary for the Trader
In plain terms, this tool filters out "noise" (minor, erratic price jumps) to show you the underlying direction of the market. It helps you distinguish between a volatile market that is moving sideways and a healthy, consistent trend where the price is advancing with purpose.
//+---------------------------------------------------------------------+
//|                                              MLS-HL4.mq4            |
//| The Method of Least Squares                                         |
//|      High and Low ver. 4                                            |
//|             Copyright © Trofimov 2008                               |
//+---------------------------------------------------------------------+
//| Ìåòîä íàèìåíüøèõ êâàäðàòîâ                                          |
//|   ïî âåðõíåé è íèæíåé îòìåòêå ñâå÷è                                 |
//| Îïèñàíèå: Ðàñ÷¸ò ìèíèìàëüíîãî êâàäðàòè÷íîãî îòëîíåíèÿ îò ïðÿìîé     |
//|           â ïóíêòàõ. Åñëè ðûíîê êîëåáëåòñÿ â ïðåäåëàõ òàíãåíñà      |
//|           óãëà íàêëîíà ëèíèè òðåíäà ê ãîðèçîíòàëüíîé ïðÿìîé         |
//|           òî òðåíä ðàçâèâàåòñÿ óâåðåííî è ðàâíîìåðíî.               |
//| Àâòîðñêîå ïðàâî ïðèíàäëåæèò Òðîôèìîâó Åâãåíèþ Âèòàëüåâè÷ó, 2008     |
//+---------------------------------------------------------------------+


#property copyright "Copyright © Trofimov Evgeniy Vitalyevich, 2008"
#property link      "http://multitest.semico.ru/mnk.htm"

//---- Ñâîéñòâà èíäèêàòîðà
#property indicator_separate_window
#property indicator_buffers 1
#property indicator_color1 DodgerBlue
#property indicator_width1 2
//#property indicator_color2 DarkSeaGreen
//#property indicator_width2 0

//---- Âõîäÿùèå ïàðàìåòðû
extern int MyPeriod=12;
extern bool ReDraw=true; //-åñëè âêëþ÷åí, òî ïåðåðèñîâûâàåò íóëåâîé áàð ïðè êàæäîì íîâîì òèêå
                          // åñëè âûêëþ÷åí, òî íóëåâîé áàð ñîäåðæèò ôèêñèðîâàííîå çíà÷åíèå, âû÷èñëåííîå ïî ïðåäûäóùèì (ãîòîâûì) áàðàì
//---- Ìàññèâ äàííûõ èíäèêàòîðà
double MLS_Angel[];
//datetime LastTime;
//+------------------------------------------------------------------+
//|                Ôóíêöèÿ èíèöèàëèçàöèè èíäèêàòîðà                  |
//+------------------------------------------------------------------+
int init()
  {
//---- x äîïîëíèòåëüíûõ áóôåðà, èñïîëüçóåìûõ äëÿ ðàñ÷åòà
   IndicatorBuffers(1);
//---- ïàðàìåòðû ðèñîâàíèÿ (óñòàíîâêà íà÷àëüíîãî áàðà)
   SetIndexDrawBegin(0,MyPeriod);
   //SetIndexDrawBegin(1,MyPeriod);
//---- x ðàñïðåäåëåííûõ áóôåðà èíäèêàòîðà
   SetIndexBuffer(0,MLS_Angel);
   //SetIndexBuffer(1,MLS_b);
//---- èìÿ èíäèêàòîðà è ïîäñêàçêè äëÿ ëèíèé
   IndicatorShortName("MLS-HL4 ("+MyPeriod+") = ");
   SetIndexLabel(0,"a");
   //SetIndexLabel(1,"b");
   //SetIndexStyle(1,DRAW_NONE, EMPTY, EMPTY, CLR_NONE);
   return(0);
  }
//+------------------------------------------------------------------+
//|                Ôóíêöèÿ èíäèêàòîðà                                |
//+------------------------------------------------------------------+
int start() {
   int limit, RD;
   if(ReDraw) RD=1;
   // Ïðîïóùåííûå áàðû
   int counted_bars=IndicatorCounted();
//---- îáõîäèì âîçìîæíûå îøèáêè
   if(counted_bars<0) return(-1);
//---- íîâûå áàðû íå ïîÿâèëèñü è ïîýòîìó íè÷åãî ðèñîâàòü íå íóæíî
   limit=Bars-counted_bars-1+RD;
//---- îñíîâíûå ïåðåìåííûå
   double k1, i1, j1, k2, i2, j2;
   double a, b, y, S, H, L;
   int x;
//---- îñíîâíîé öèêë
   for(int t=limit-RD; t>-RD; t--) {

      //if(LastTime==iTime(NULL,0,t)) return(0); //ëó÷øå íå âêëþ÷àòü
      //LastTime=iTime(NULL,0,t);
      //if(t<5) Print(t,"===== ",TimeToStr(LastTime)," =====");
      k1=0; i1=0; j1=0; k2=0; i2=0;
      for(x=t+MyPeriod-1; x>=t; x--)
        { // ñîñòàâëÿåì íîðìàëüíûå óðàâíåíèÿ k1=a*i1+b*j1 è k2=a*i2+b*j2
         H=High[x]/Point;
         L=Low[x]/Point;
         k1=k1+H*x;    k2=k2+H;
         k1=k1+L*x;    k2=k2+L;
         i1=i1+2*x*x;  i2=i2+2*x;
         j1=j1+2*x;
        }
      j2=MyPeriod*2;
      //Ðåøàåì ñèñòåìó óðàâíåíèé
      a=(k1*j2-j1*k2)/(i1*j2-j1*i2);
      //b=(k2-i2*a)/j2;
      //Òåïåðü âñå òî÷êè High è Low, íà äàííûé ìîìåíò âðåìåíè,
      //ïðèáëèçèòåëüíî ðàñïîëîæåíû âäîëü ïðÿìîé, îïèñàíîé óðàâíåíèåì y=ax+b,
      //ãäå x - ýòî íîìåð ñâå÷è, à y - çíà÷åíèå öåíû.
      MLS_Angel[t]=-a;
      if(!ReDraw && t==1) MLS_Angel[0]=-a;
      //MLS_b[t]=b*Point;
   }
   return(0);
}
//+------------------------------------------------------------------+
Comments