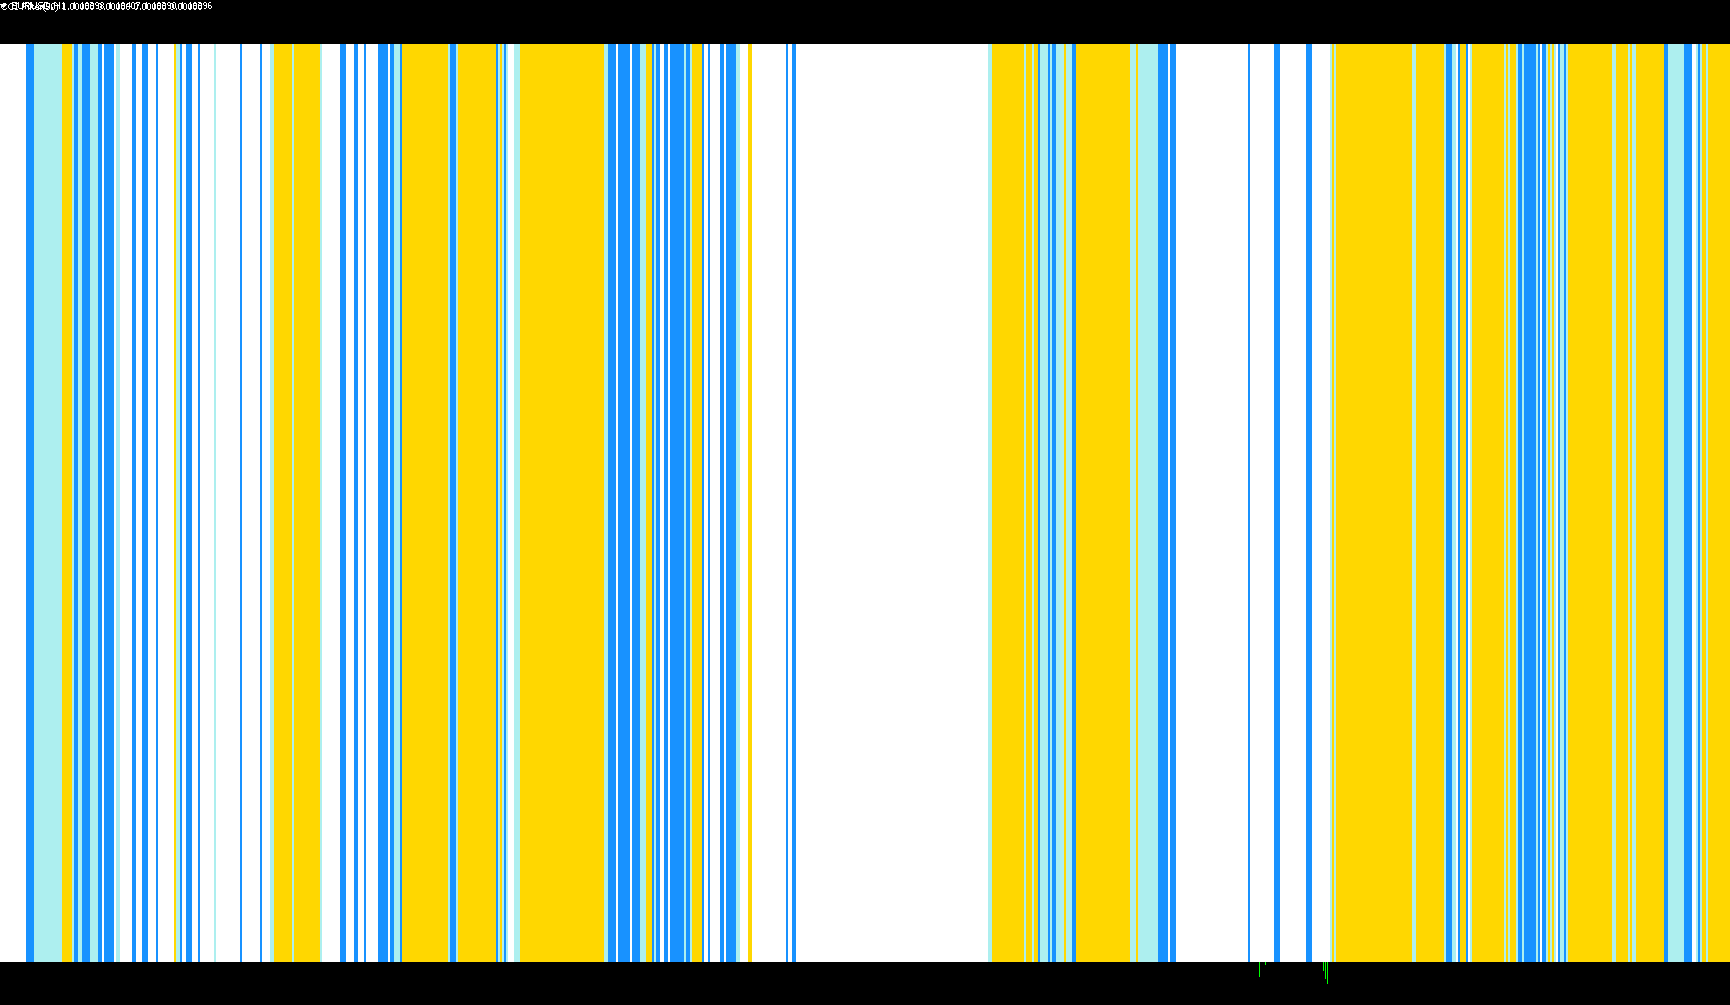
The CCI Filter is a visual trading tool designed to help market participants identify the prevailing direction of price momentum by categorizing market movement into four distinct states. Instead of showing raw numbers, it simplifies complex price data into a clear, color-coded histogram that distinguishes between strong and mild trends.
How the Logic Works
The script analyzes the Commodity Channel Index (CCI)—a technical indicator that measures how far the current price is deviating from its statistical average. By looking at these deviations over a specific timeframe (which you can customize), the tool classifies the market into one of four zones:
- Strong Upward Trend: When the momentum is significantly positive, the tool highlights a primary upward trend.
- Mild Upward Trend: When the price is moving up but with less intensity, it signals a softer bullish movement.
- Strong Downward Trend: When the momentum is significantly negative, it identifies a powerful move to the downside.
- Mild Downward Trend: When the price is declining with less force, it highlights a softer bearish movement.
Visual Interpretation
The logic translates these four mathematical states into a visual histogram on your chart:
- Trend Identification: The script constantly scans the most recent price history to see where the CCI value sits relative to specific "thresholds" (0 and 50).
- State Assignment: Based on where the price falls within those thresholds, the tool "switches on" one of the four categories.
- Color Coding: By using different colors for each state (such as Blue, Red, Light Blue, and Light Coral), the indicator allows you to see at a glance whether the market is experiencing a heavy push in one direction or a more stabilized, mild drift.
Summary for the Trader
Essentially, this script acts as a "filter." It removes the noise of constant price fluctuations and tells you what the "mood" of the market is. It helps you distinguish between a high-conviction move (Strong Trend) and a period of lower-energy movement (Mild Trend), allowing for more informed decisions on when to align with the current market flow.
//+------------------------------------------------------------------+
//|                                                mj_CCIFilter_v1.0 |
//|                                  Copyright © 2007, Forex-TSD.com |
//|                                               Written by mj_bolt |
//|                                                                  |
//+------------------------------------------------------------------+
#property copyright "Copyright © 2007, Forex-TSD.com "
#property link      "http://www.forex-tsd.com/"

#property indicator_separate_window
#property indicator_minimum -0.05
#property indicator_maximum 1.05
#property indicator_buffers 4
#property indicator_color1 Blue
#property indicator_color2 Red
#property indicator_color3 LightBlue
#property indicator_color4 LightCoral


//---- input parameters
extern int PeriodCCI=50;
//---- indicator buffers
double UpBuffer1[];
double DnBuffer1[];
double UpBuffer2[];
double DnBuffer2[];
//+------------------------------------------------------------------+
//| Custom indicator initialization function                         |
//+------------------------------------------------------------------+
  int init()
  {
   string short_name;
//---- indicator line
   SetIndexStyle(0,DRAW_HISTOGRAM,STYLE_SOLID,2);
   SetIndexStyle(1,DRAW_HISTOGRAM,STYLE_SOLID,2);
   SetIndexStyle(2,DRAW_HISTOGRAM,STYLE_SOLID,2);
   SetIndexStyle(3,DRAW_HISTOGRAM,STYLE_SOLID,2);

   SetIndexBuffer(0,UpBuffer1);
   SetIndexBuffer(1,DnBuffer1);
   SetIndexBuffer(2,UpBuffer2);
   SetIndexBuffer(3,DnBuffer2);

   IndicatorDigits(MarketInfo(Symbol(),MODE_DIGITS));
//---- name for DataWindow and indicator subwindow label
   short_name="CCI Filter("+PeriodCCI+")";
   IndicatorShortName(short_name);
   SetIndexLabel(0,"UpTrend");
   SetIndexLabel(1,"DownTrend");
   SetIndexLabel(2,"Mild UpTrend");
   SetIndexLabel(3,"Mild DownTrend");

//----
   SetIndexDrawBegin(0,PeriodCCI);
   SetIndexDrawBegin(1,PeriodCCI);
   SetIndexDrawBegin(2,PeriodCCI);
   SetIndexDrawBegin(3,PeriodCCI);
//----
   return(0);
  }

//+------------------------------------------------------------------+
//| RSIFilter                                                         |
//+------------------------------------------------------------------+
int start()
  {
   int shift,trend;
   double CCI0;


   for(shift=Bars-PeriodCCI-1;shift>=0;shift--)
   {
   CCI0=iCCI(NULL,0,PeriodCCI,PRICE_CLOSE,shift);

	  if (CCI0>0 && CCI0<50)  trend=1;
	  if (CCI0>50)  trend=2;
	  if (CCI0<0 && CCI0>-50) trend=-1;
	  if (CCI0<-50)  trend=-2;

	  if (trend==1)
	  {

	  UpBuffer1[shift]=0;
	  UpBuffer2[shift]=1;
	  DnBuffer1[shift]=0;
	  DnBuffer2[shift]=0;

	  }
	  if (trend==2)
	  {

	  UpBuffer1[shift]=1;
	  UpBuffer2[shift]=0;
	  DnBuffer1[shift]=0;
	  DnBuffer2[shift]=0;

	  }
	  if (trend==-1)
	  {

	  UpBuffer1[shift]=0;
	  UpBuffer2[shift]=0;
	  DnBuffer1[shift]=0;
	  DnBuffer2[shift]=1;
	  }

	  if (trend==-2)
	  {

	  UpBuffer1[shift]=0;
	  UpBuffer2[shift]=0;
	  DnBuffer1[shift]=1;
	  DnBuffer2[shift]=0;

	  }
	}
	return(0);
 }
Comments