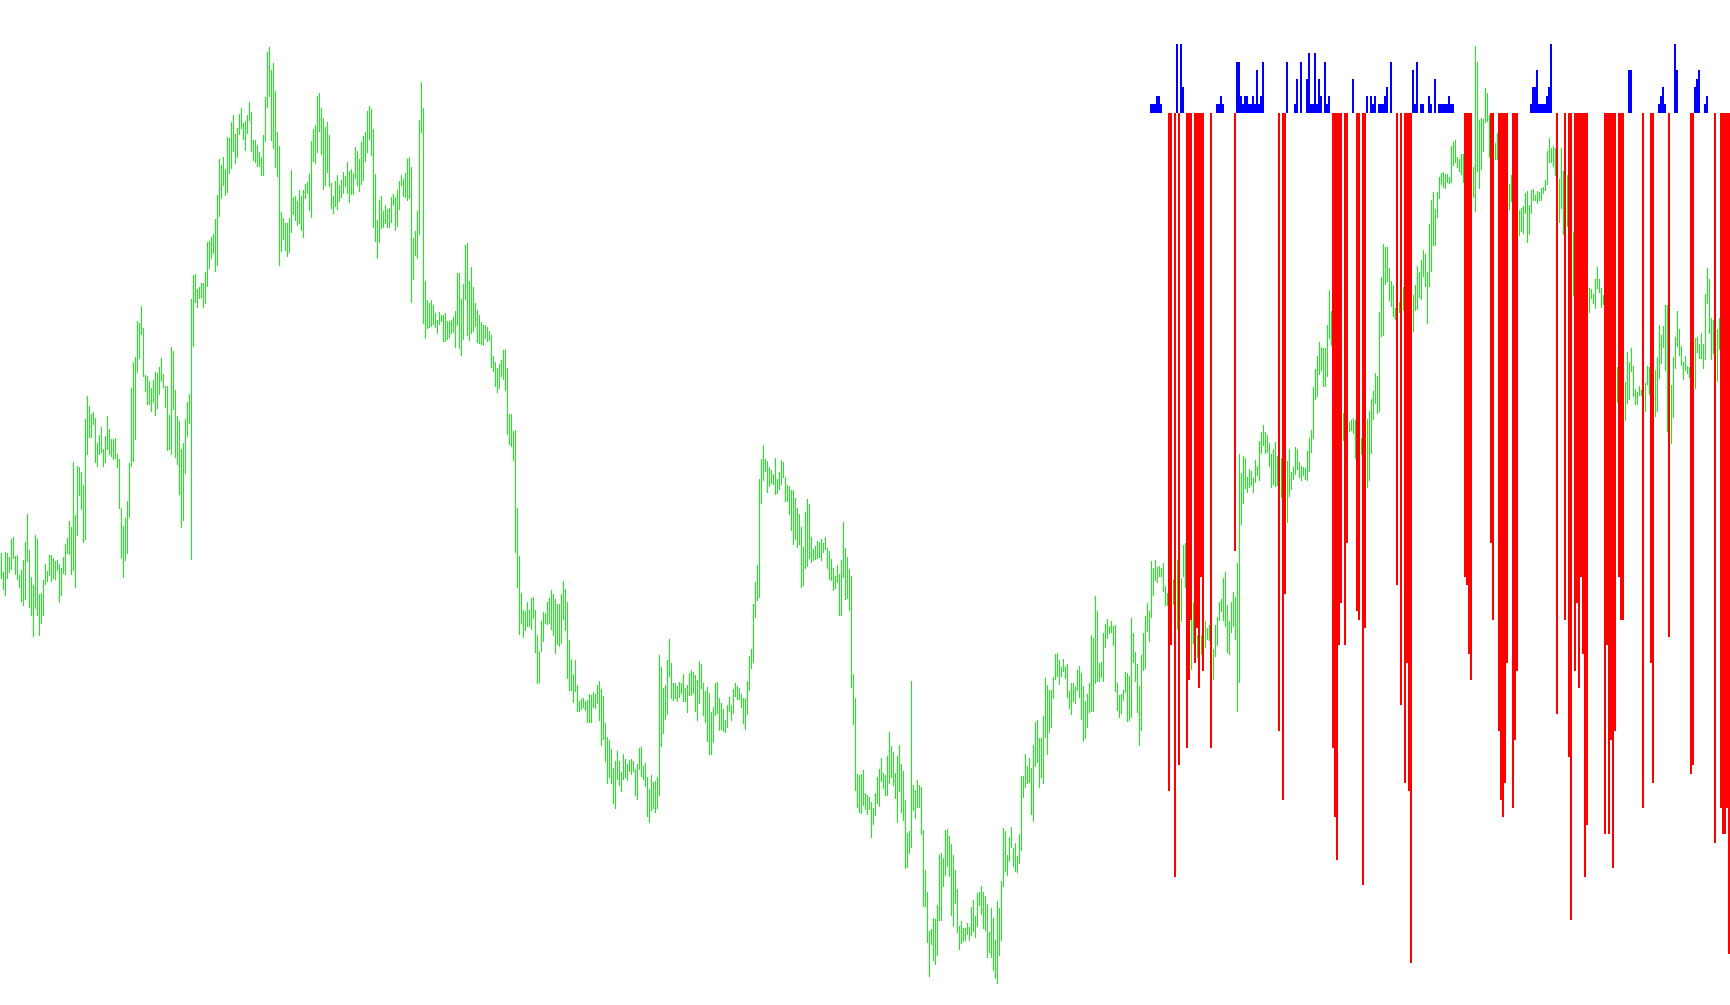
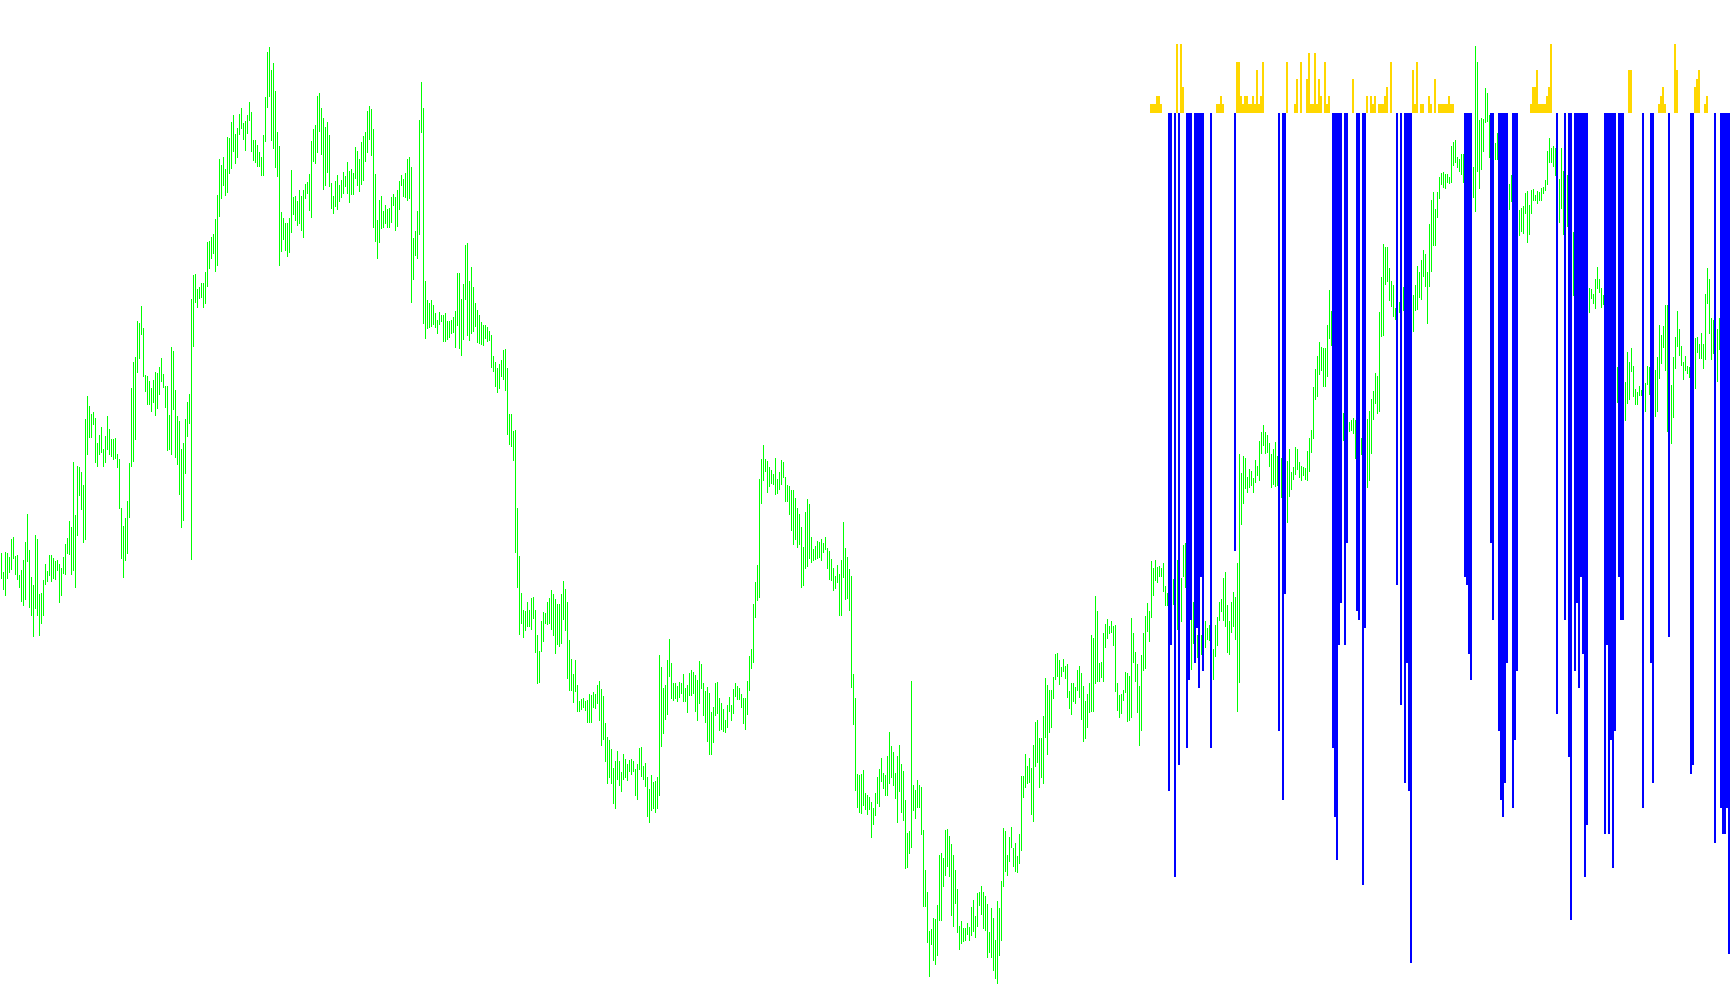
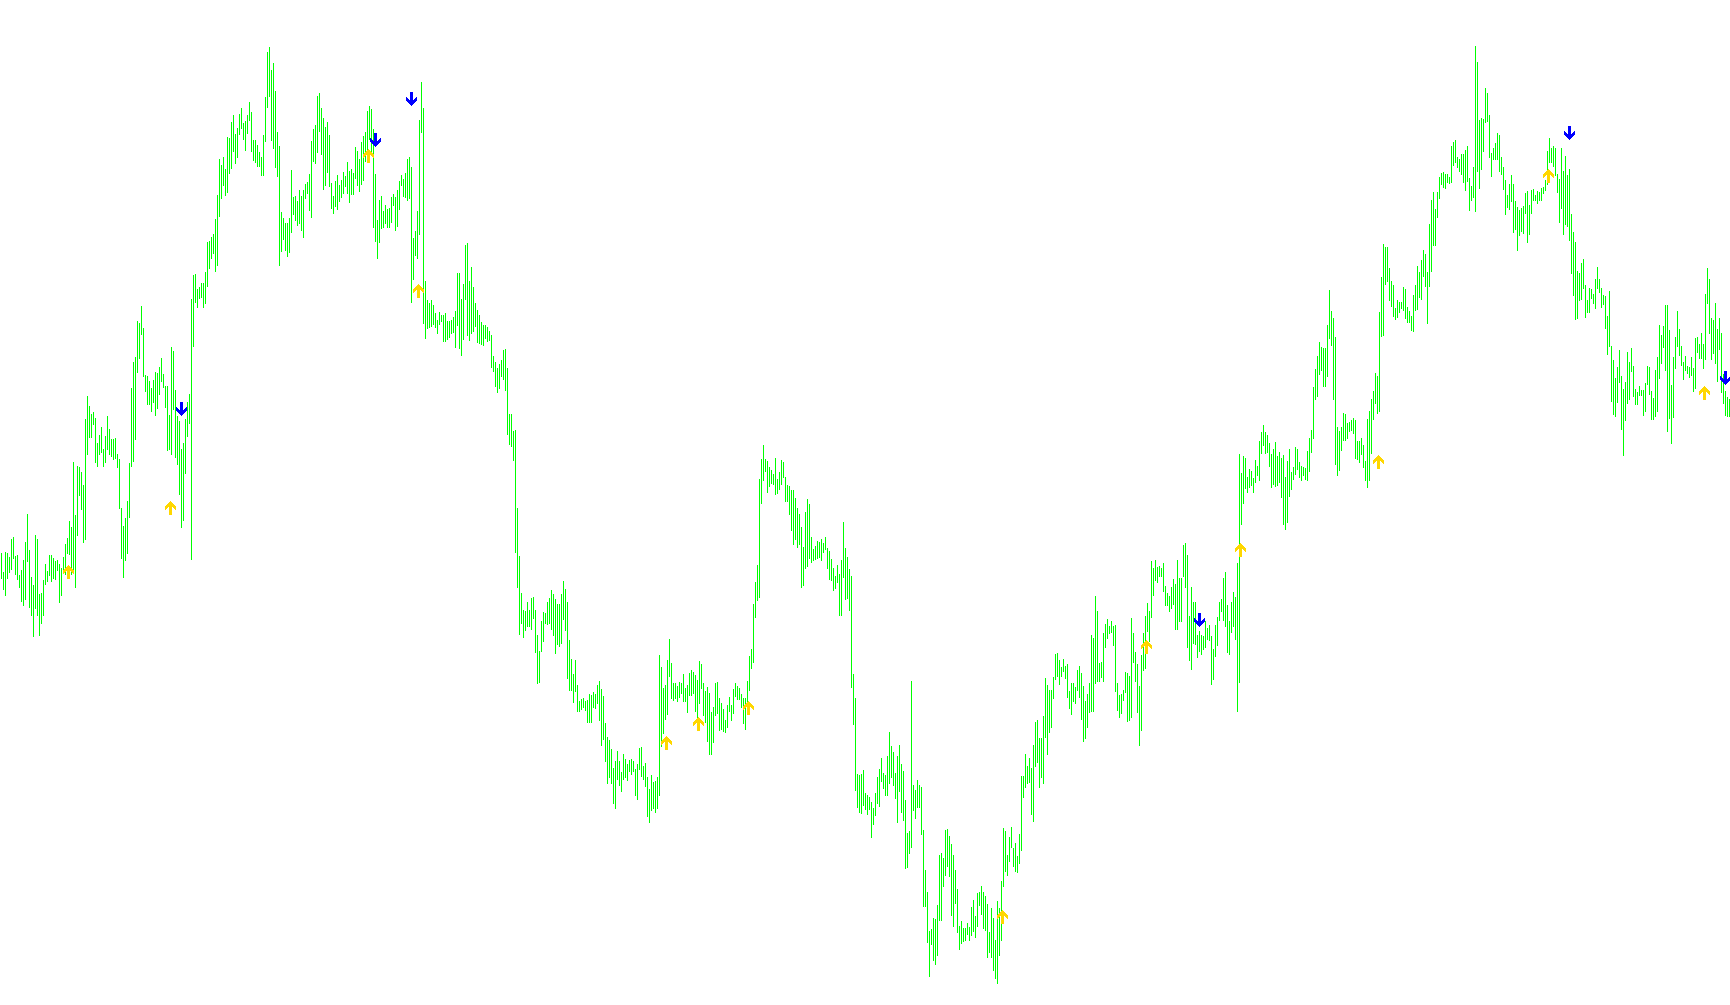
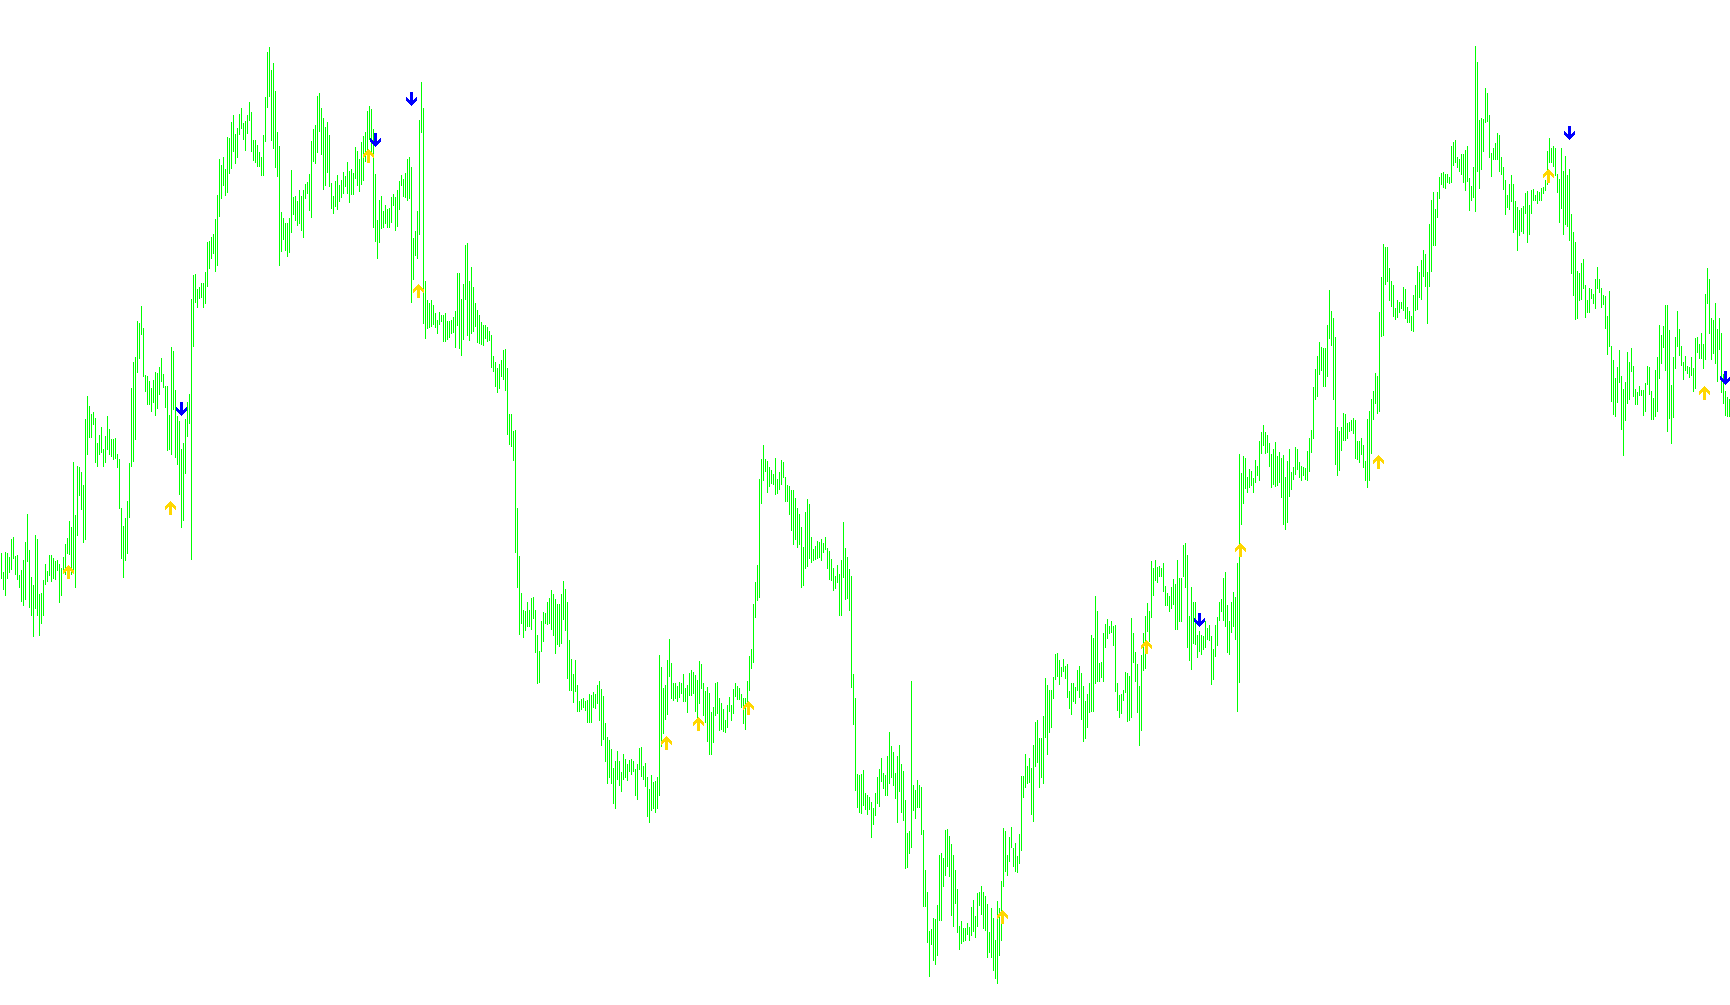
SmWPR_test
Indicator

SmWPR_test

iWPR

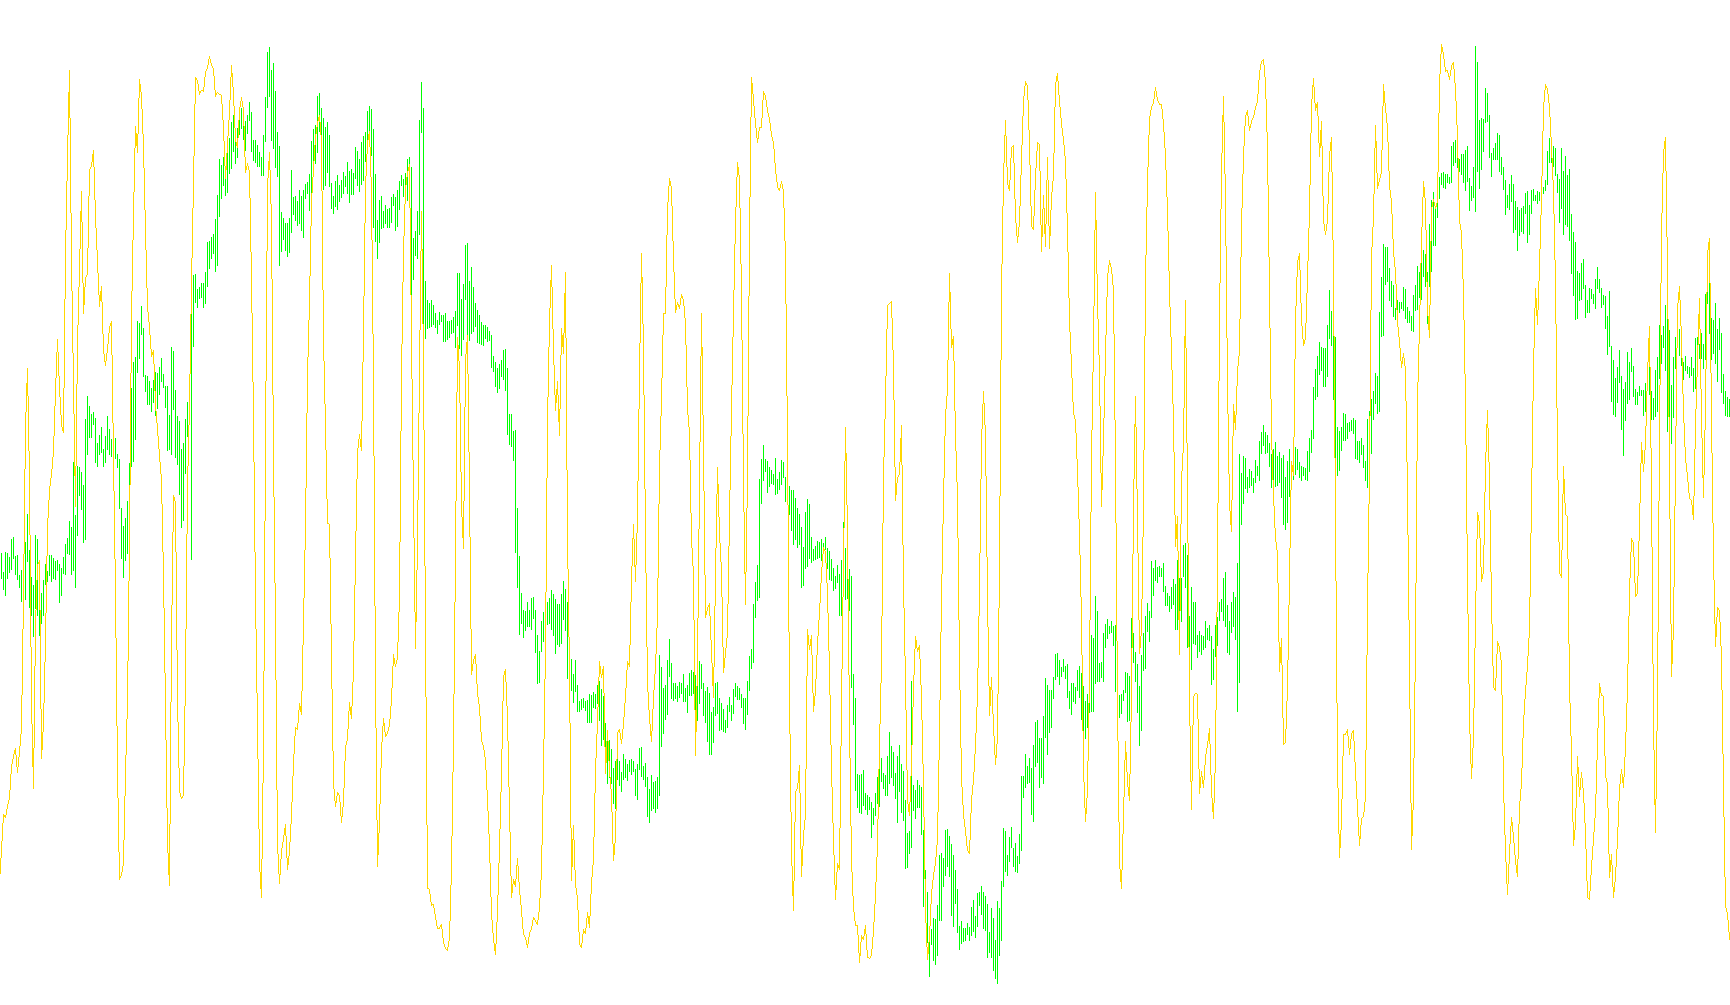
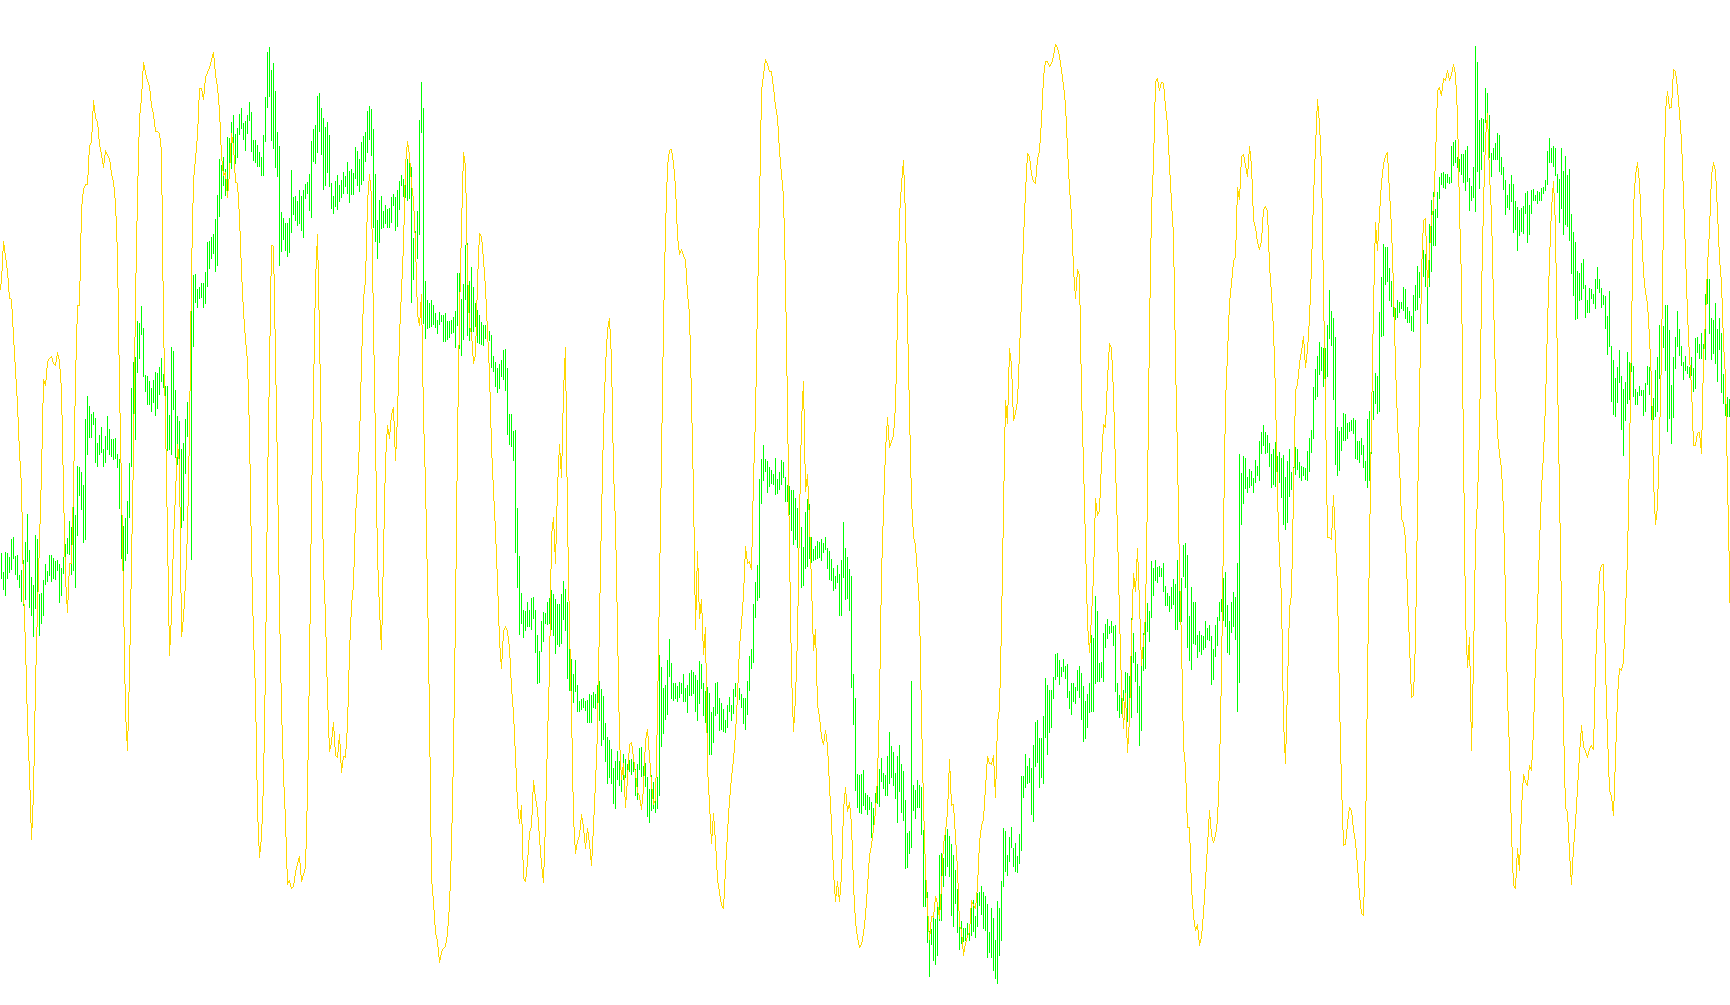
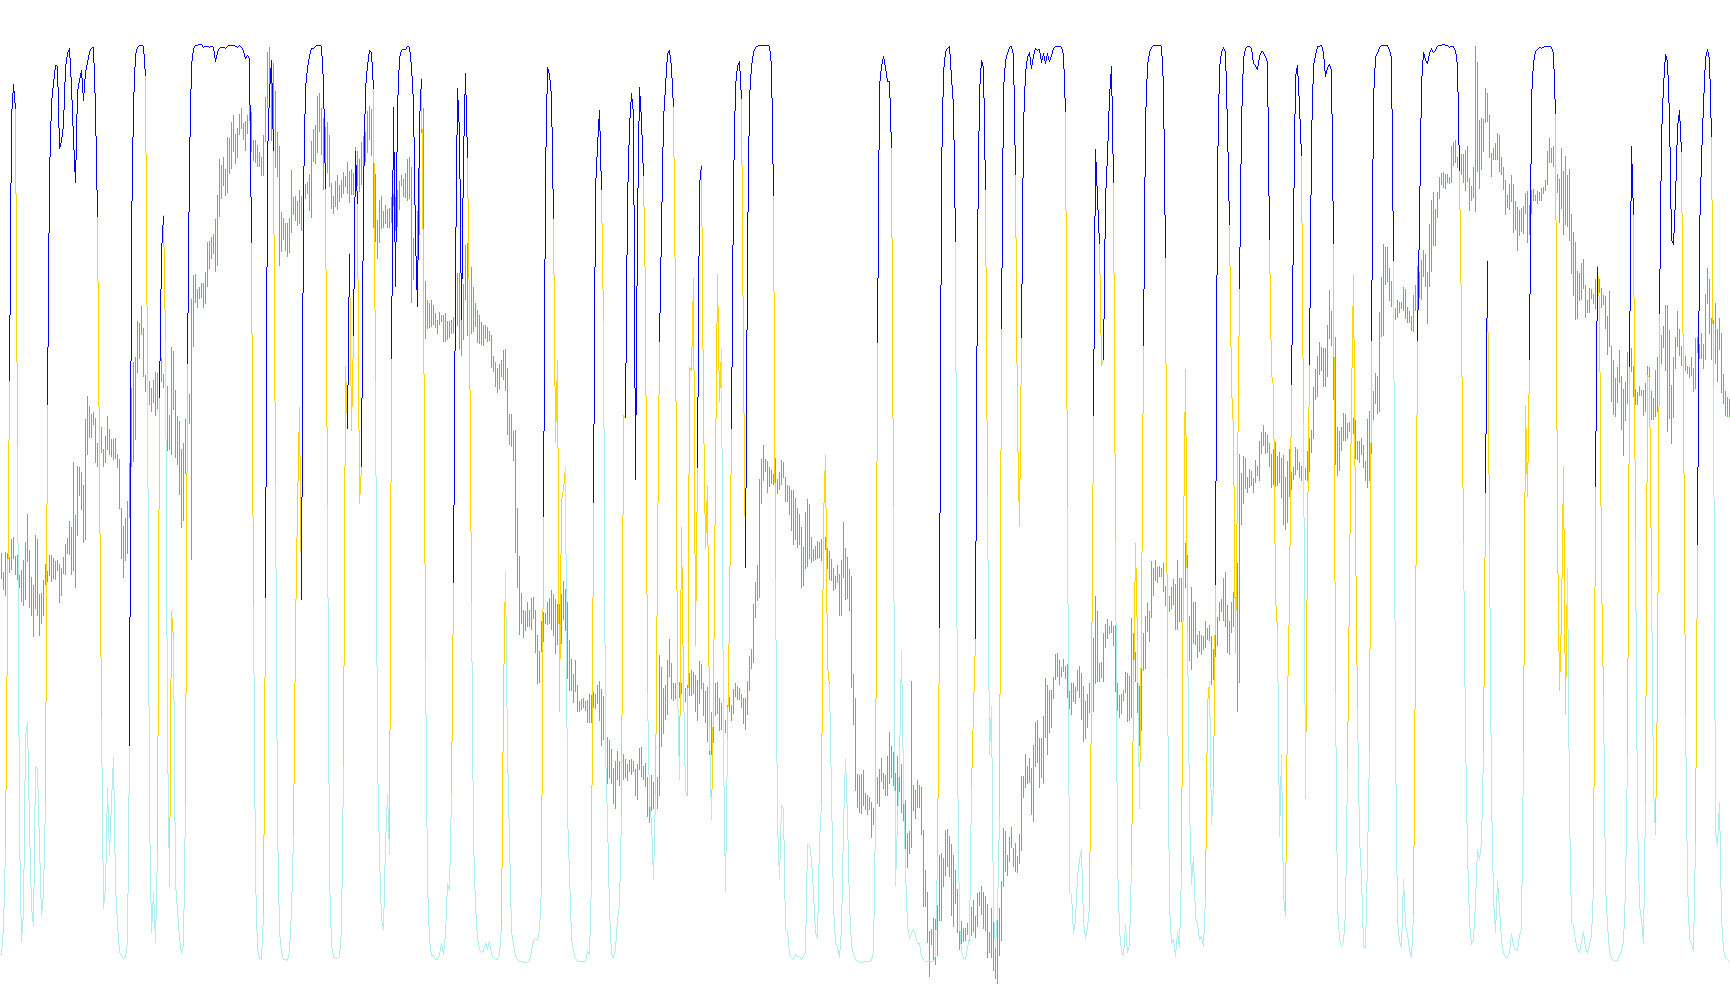
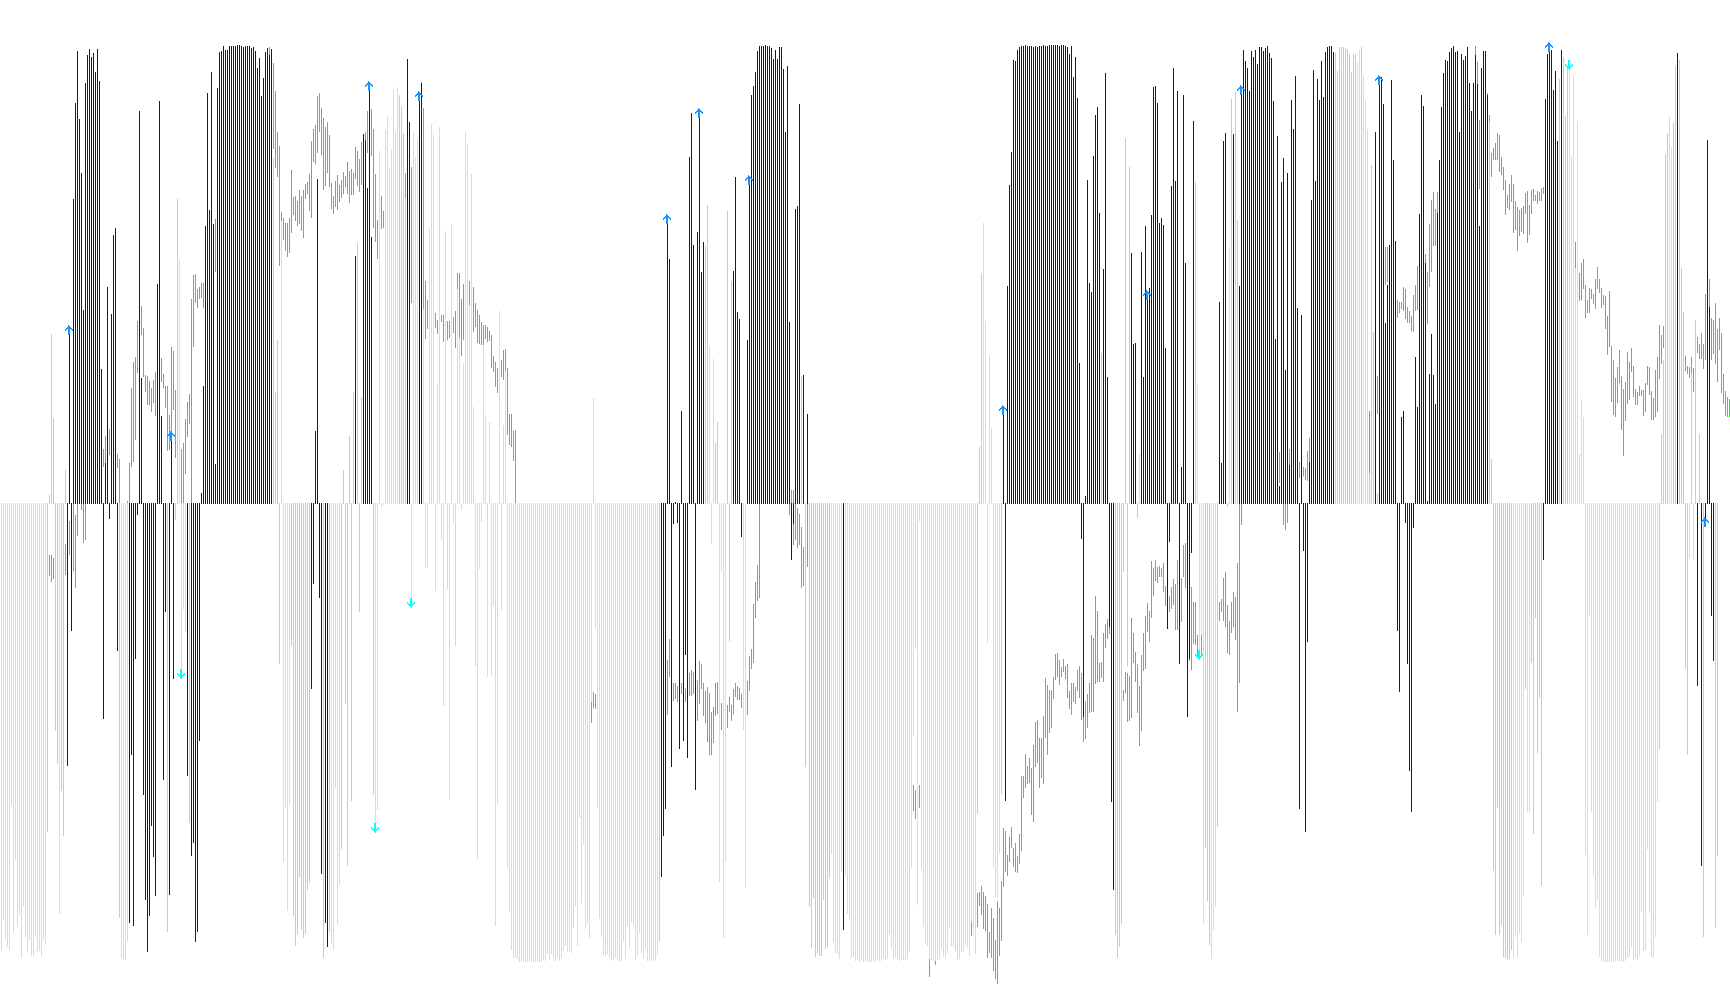
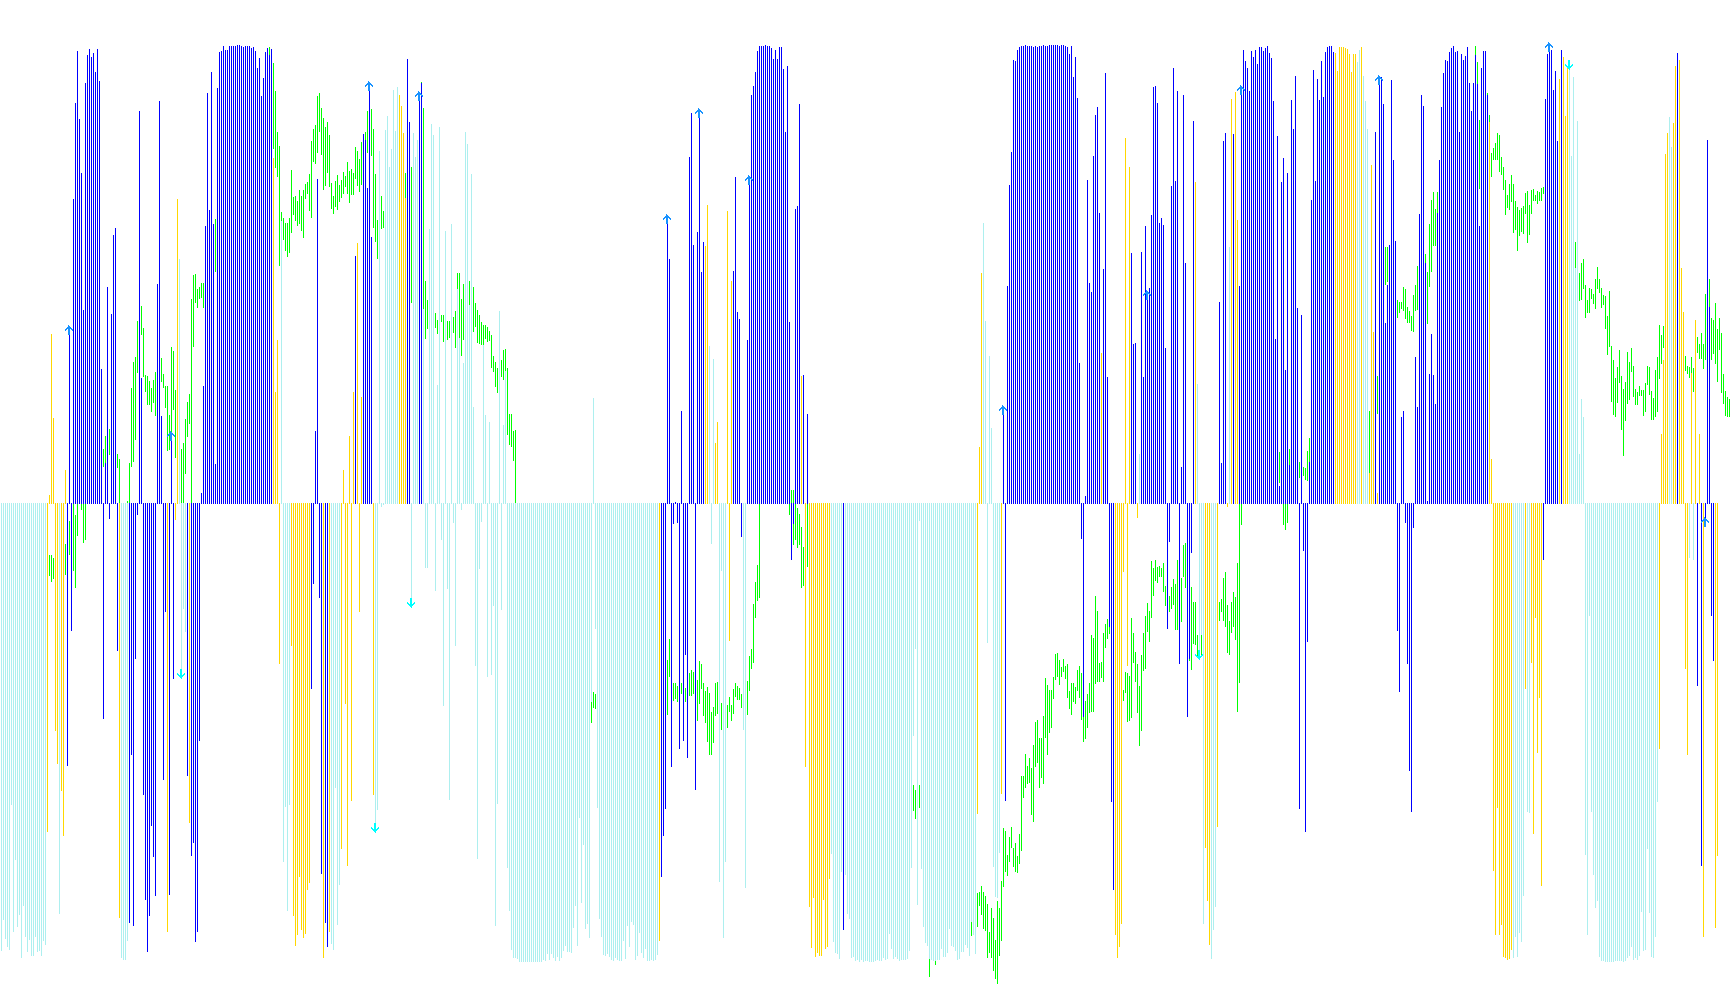
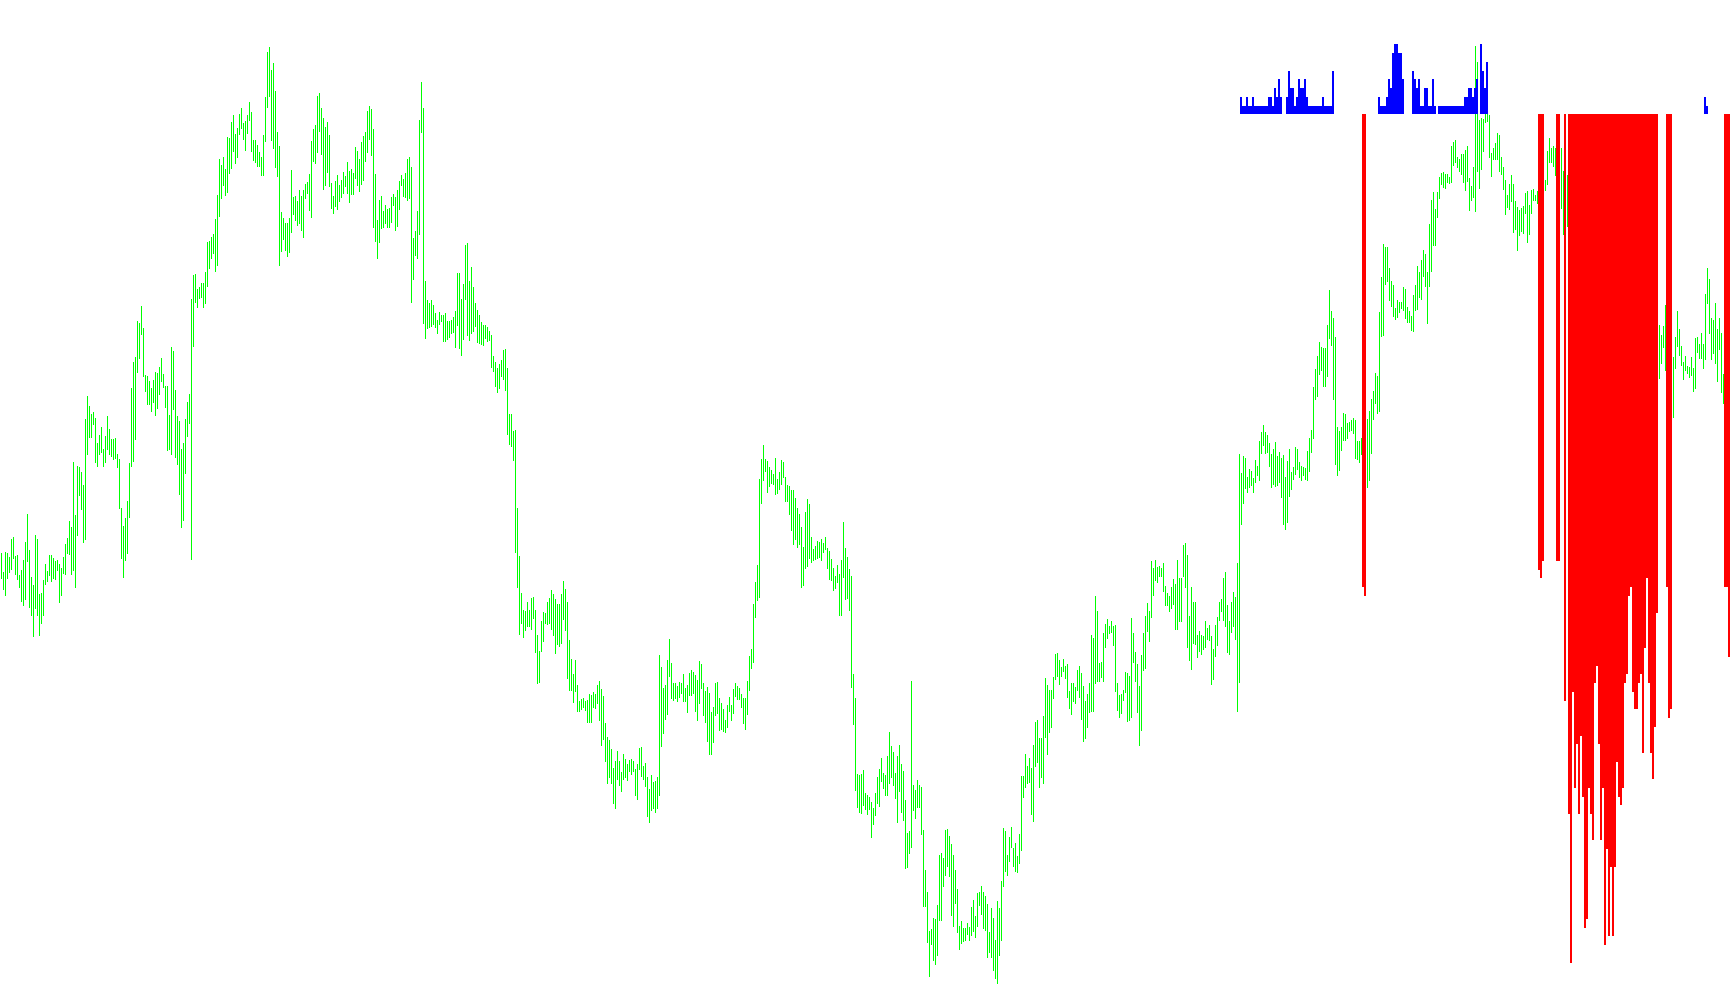
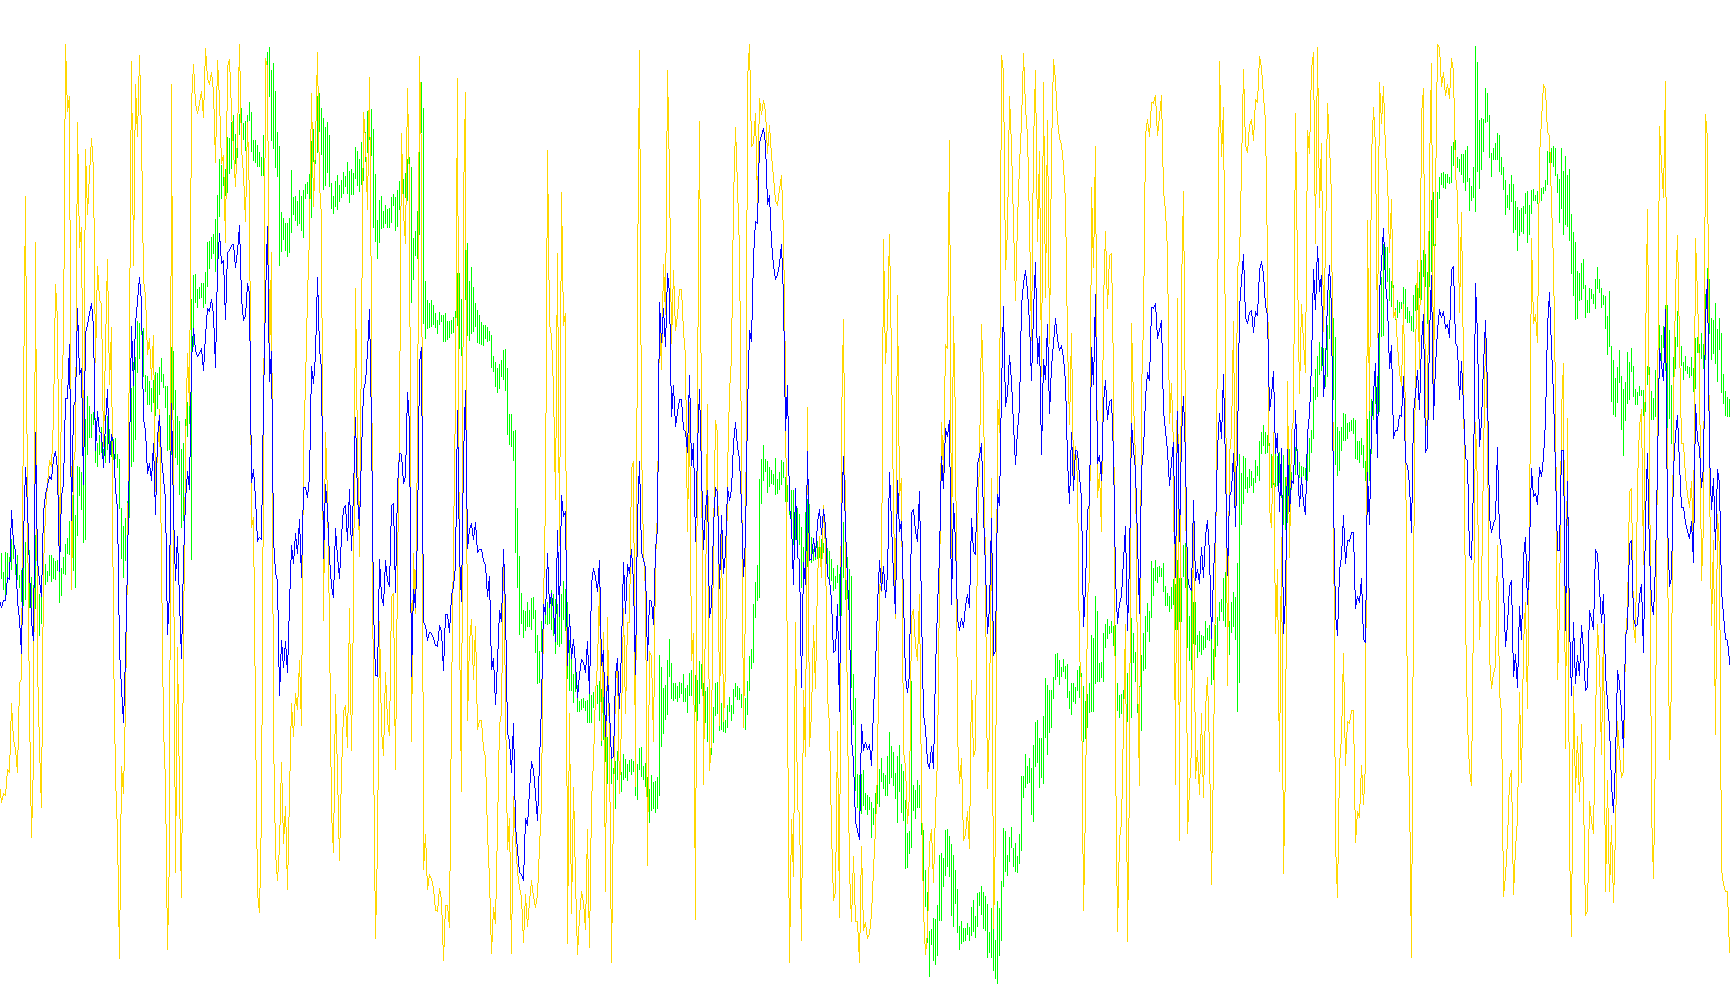
This indicator utilizes a multi-stage weighted smoothing algorithm on the Williams Percent Range to identify extreme overbought and oversold price momentum thresholds.

StochR% Super Position
Indicator

StochR% Super Position

iWPRiMAOnArrayiStochastic
Indicator

Tabelka_kontrolna_PL

iADiACiAlligatoriFractals
Trend-Table-1v1
Indicator

Trend-Table-1v1

iWPRiMAiSAR

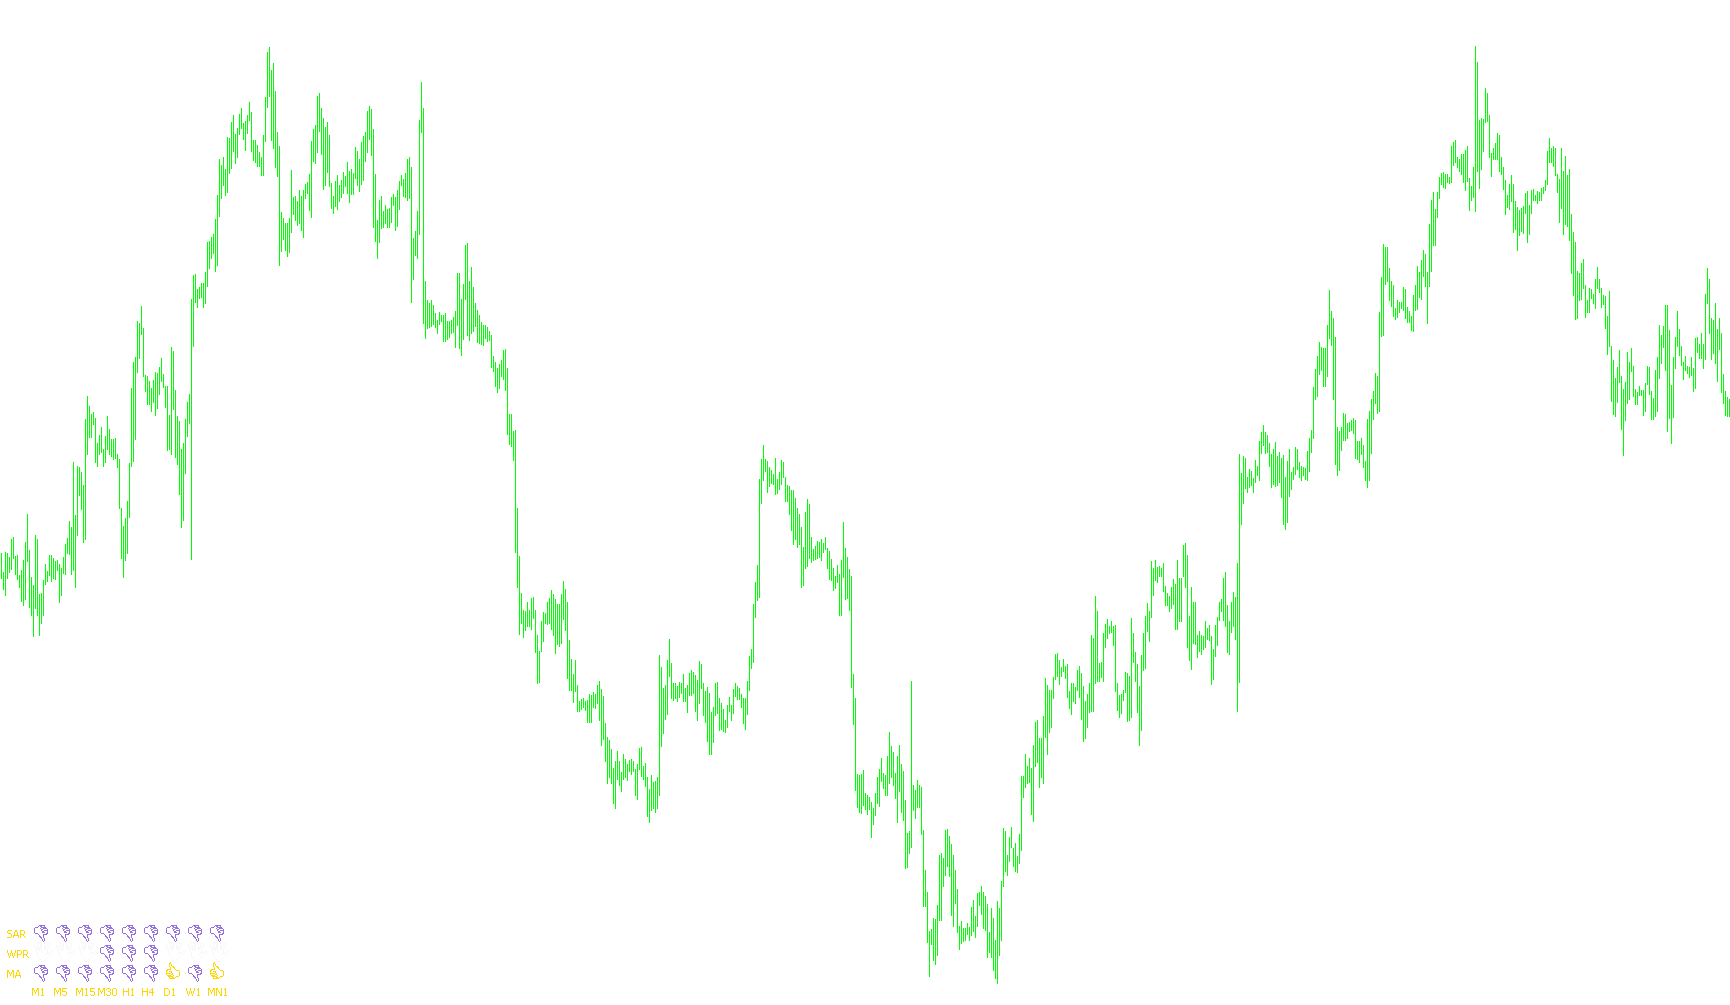
A comprehensive dashboard that visualizes concurrent trend strength and momentum signals across nine timeframes using Moving Average crossovers, Williams Percent Range extremes, and Parabolic SAR positionings.

Trendsignal
Indicator

Trendsignal

iWPR

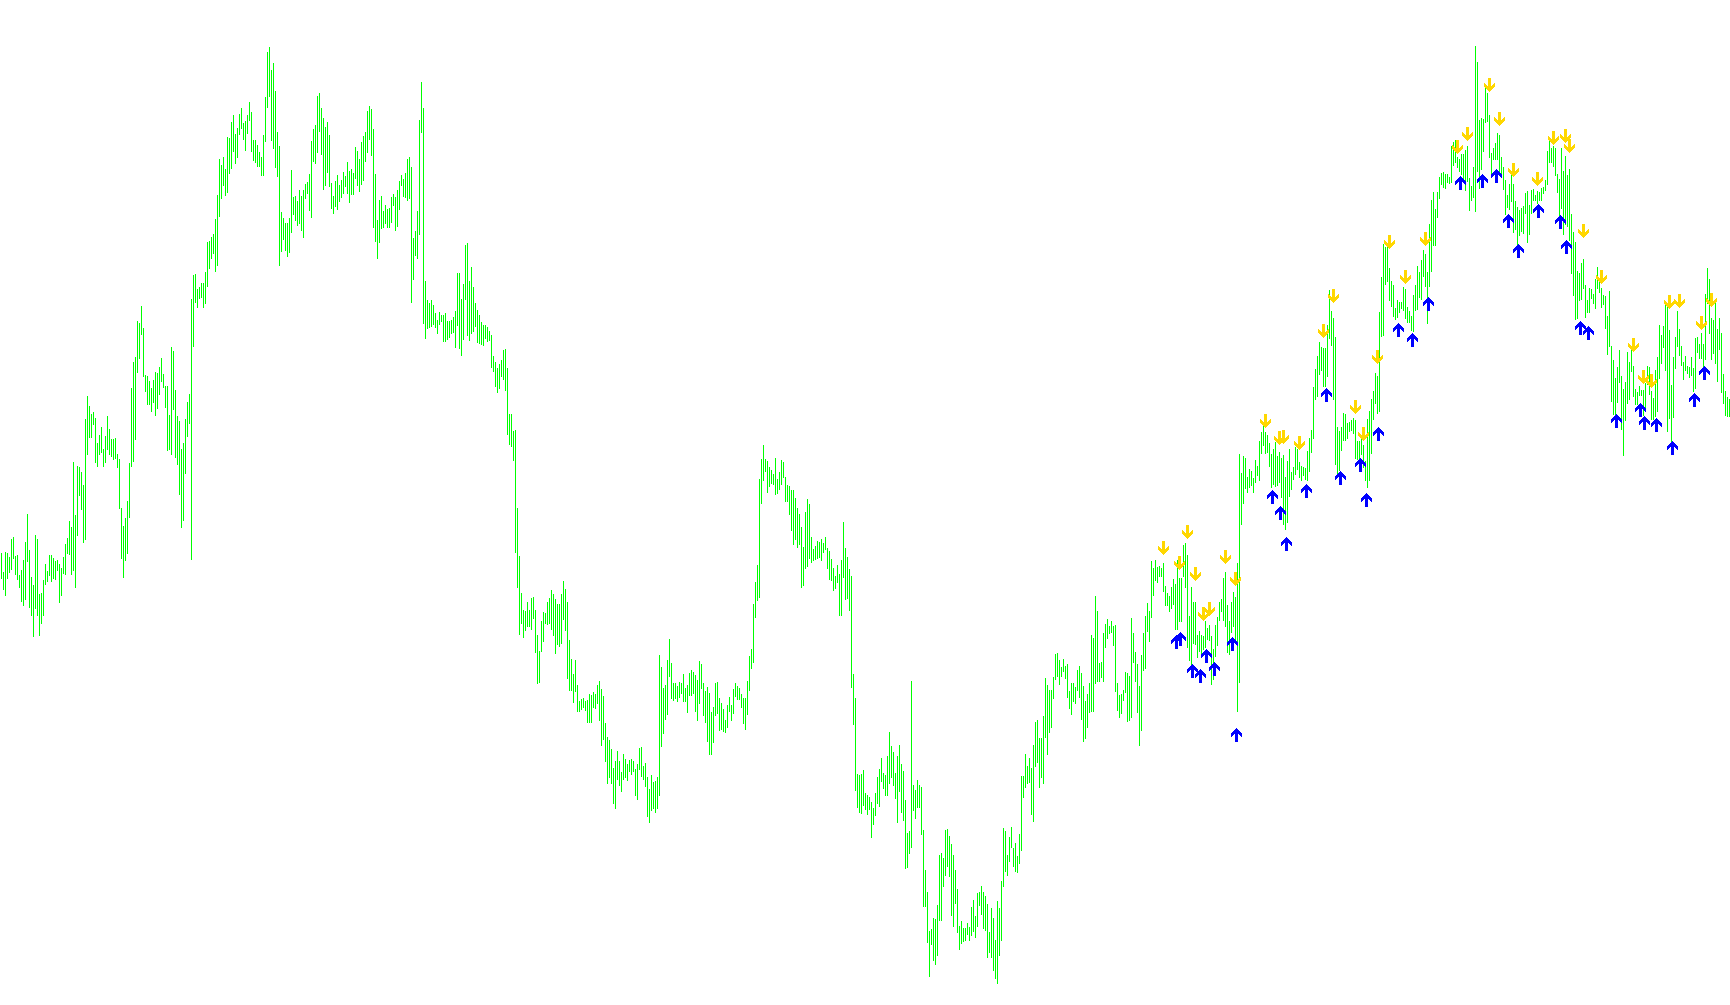
This indicator identifies trend reversal points by detecting significant price gaps and velocity shifts relative to rolling average ranges using a weighted percentage oscillator.

Trendsignal_(1)
Indicator

Trendsignal_(1)

iWPR

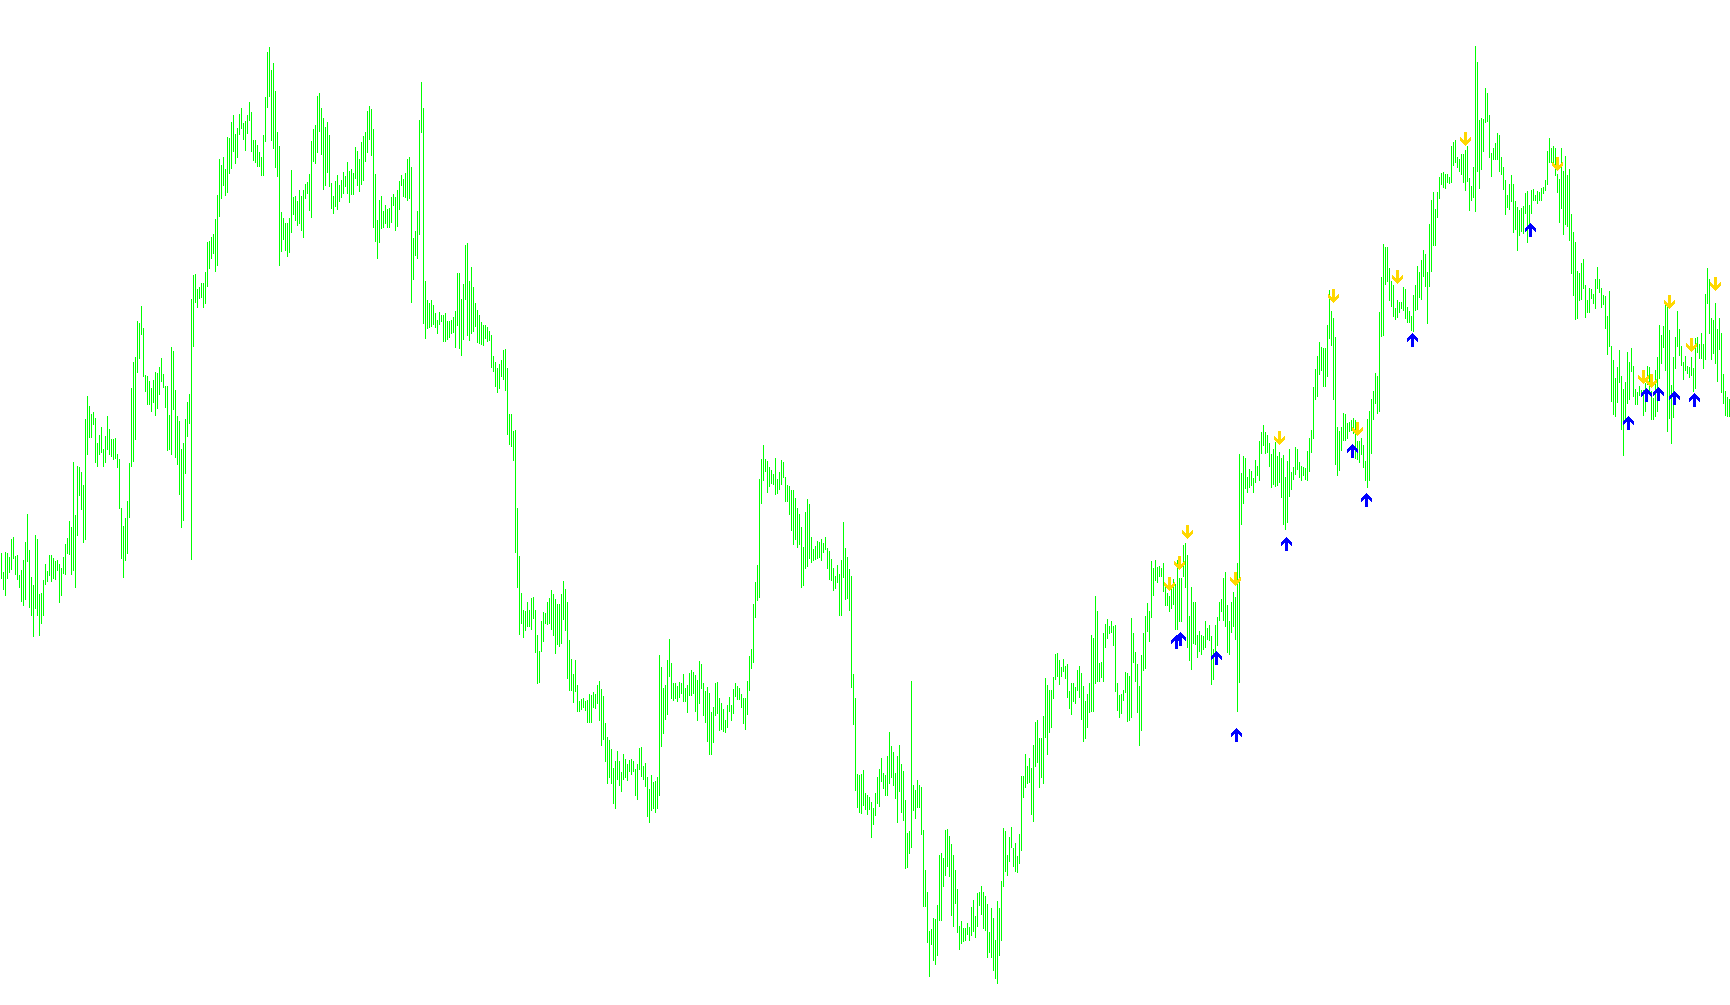
Identifies potential trend exhaustion points by detecting significant price deviations relative to average volatility ranges using a weighted momentum oscillator.

Trendsignal_001
Indicator

Trendsignal_001

iWPR

This indicator identifies trend exhaustion by detecting significant price gaps relative to average volatility and filtering for momentum shifts using a modified Williams Percent Range.

Trendsignal_v1
Indicator

Trendsignal_v1

iWPR
VininI_BB_MA_WPR(v1)
Indicator

VininI_BB_MA_WPR(v1)

iWPRiMAOnArray

This indicator transforms the Williams Percent Range into a normalized scale and overlays Bollinger Bands with a Moving Average to identify volatility extremes and trend shifts in momentum.

VininI_MA_WPR(v1)
Indicator

VininI_MA_WPR(v1)

iWPRiMAOnArray

This indicator transforms the Williams Percent Range into a centered scale and applies a moving average to filter out noise for smoother momentum tracking.

VininI_MV_MA_WPR(v1)
Indicator

VininI_MV_MA_WPR(v1)

iWPRiMAOnArray

This indicator normalizes the Williams %R oscillator to a 0-100 scale and applies a moving average filter to identify smoothed momentum trends across disparate currency pairs.

VininI_MV_WPR(v1)
Indicator

VininI_MV_WPR(v1)

iWPR

This indicator synchronizes and normalizes the Williams Percent Range of a secondary currency pair to detect overbought and oversold extremes relative to the primary chart.

VininI_Trend_MA_WPR
Indicator

VininI_Trend_MA_WPR

iWPRiMAOnArray

The logic evaluates the relative frequency of Williams %R values exceeding a multi-step moving average to quantify momentum distribution strength.

VininI_Trend_WPR
Indicator

VininI_Trend_WPR

iWPRiMAOnArray

This indicator calculates the Root Mean Square Deviation of normalized Williams Percent Range values to quantify volatility and trend stability.

VininI_Trend_WPR_MA
Indicator

VininI_Trend_WPR_MA

iWPRiMAOnArray

This indicator quantifies the prevalence of WillRogers Price Range values relative to a multi-point moving average array to identify momentum distribution trends.

VininI_WPR_FO
Indicator

VininI_WPR_FO

iWPRiMAOnArray

The logic transforms Williams Percent Range data into a smoothed hyperbolic tangent oscillation to identify extreme bullish and bearish momentum thresholds.

VininI_WPR_FOhisto
Indicator

VininI_WPR_FOhisto

iWPRiMAOnArray

This indicator transforms Williams Percent Range data into a smoothed hyperbolic tangent oscillator to identify overextended momentum extremes and directional shifts.

W%R_MA_LC
Indicator

W%R_MA_LC

iWPR

This indicator synchronizes a Williams Percent Range oscillator with its moving average through linear normalization to facilitate clear momentum trend identification.

WilliamsPR_alert
Indicator

WilliamsPR_alert

iWPR

This indicator monitors the Williams Percent Range to identify oversold and overbought exhaustion points, triggering notifications when price momentum hits extreme boundary thresholds.

Wilson Channels
Indicator

Wilson Channels

iDeMarkeriMFIiRSIiStochastic

This indicator maps various momentum oscillators to absolute price coordinates to project potential exhaustion zones and reversal levels directly on the chart.

Indicator

WPR ALERT

iWPR
WPR Candles
Indicator

WPR Candles

iWPR

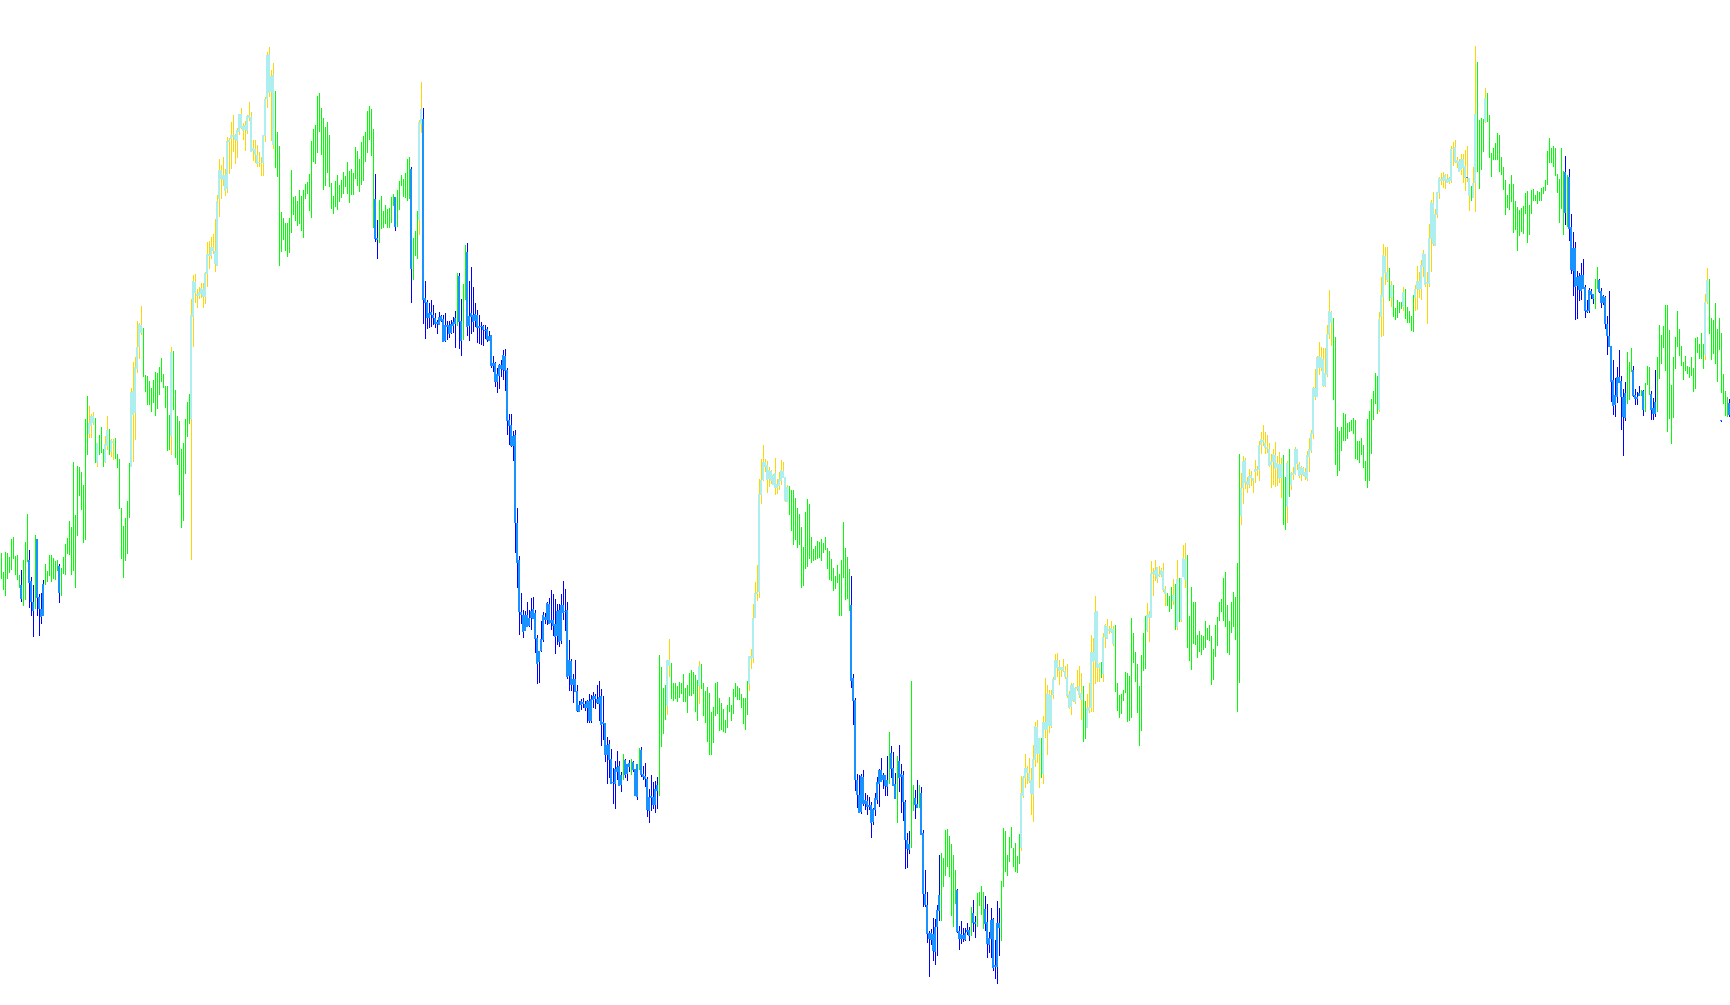
This indicator dynamically maps Williams %R values onto the price chart by color-coding candle bodies and wicks based on predefined overbought and oversold thresholds.

WPRfast
Indicator

WPRfast

iWPR

This indicator identifies extreme momentum zones by squaring and scaling the Will Rogers Percentage (WPR) to highlight price overextension beyond specific numeric boundaries.

WPRfast_v1
Indicator

WPRfast_v1

iWPR

This indicator captures extreme price momentum by applying a quadratic scaling transformation to the Williams %R, highlighting significant deviations from the mean range.

WPRfast_v2
Indicator

WPRfast_v2

iWPR

This indicator transforms the standard Williams %R into a dual-histogram signal by squaring normalized values and isolating extreme momentum shifts beyond specific user-defined upper and lower bounds.

WPROnChart
Indicator

WPROnChart

iWPRiMA

This indicator projects the Williams Percent Range (WPR) oscillator onto a price chart by calculating an offset based on the EMA of the median price.

WPRSI_signal(SoundAlarm)
Indicator

WPRSI_signal(SoundAlarm)

iWPRiRSI

The script identifies bullish and bearish reversals by detecting specific crossovers of the Williams Percent Range relative to extreme levels, validated by RSI median position and a multi-bar lookback confirmation filter.

WPRSI_signal
Indicator

WPRSI_signal

iWPRiRSI

This indicator identifies potential trend reversals by detecting simultaneous crossings of the Williams %R extremes combined with RSI momentum filters and historical price action validation.

WPRSI_signal_V.2(SoundAlarm)
Indicator

WPRSI_signal_V.2(SoundAlarm)

iWPRiRSI

This indicator identifies trend reversals and momentum shifts by cross-referencing Williams Percent Range and RSI values with a hyperbolic tangent transformation of cumulative price action.

WPRSI_signal_V.2
Indicator

WPRSI_signal_V.2

iWPRiRSI

This indicator identifies trend reversals and momentum shifts by evaluating the divergence between Williams Percent Range and RSI levels, coupled with a hyperbolic tangent transformation of cumulative price action.

WPRslow
Indicator

WPRslow

iWPR

This indicator projects momentum extremes by mapping scaled Williams Percent Range values into distinct upward and downward histogram bars based on specific boundary thresholds.

WPRslow_v1
Indicator

WPRslow_v1

iWPR

This indicator captures extreme price momentum by filtering the squared Williams Percent Range values against two distinct boundary thresholds to highlight significant overbought and oversold conditions.

WPRslow_v2
Indicator

WPRslow_v2

iWPR

The logic filters the squared Williams Percent Range to isolate price action deviations that exceed specific upper and lower thresholds.

WPR_Filter_mtf
Indicator

WPR_Filter_mtf

iWPR

This indicator categorizes market sentiment into four distinct states—bullish trend, overbought exhaustion, bearish trend, and oversold exhaustion—by analyzing the Williams Percent Range across higher timeframes.

WPR_RSI_cross_alert
Indicator

WPR_RSI_cross_alert

iWPRiRSI

This indicator monitors the convergence and divergence between the Williams Pivot Range and Relative Strength Index to trigger alerts upon their directional intersection.

yRDS2689SignalAlerts
Indicator

yRDS2689SignalAlerts

iCCIiWPRiMA

This indicator identifies dynamic support and resistance zones by synthesizing WPR, CCI, and EMA trends across multiple timeframes to generate real-time level breach alerts.

Indicator

_2523MTF_WPR (1)

iWPR
Indicator

_MTF_WPR__1_fixed

iWPR
Indicator

_PerkyAsctrend1WPR_mtf

iWPR