Trend-Table-1v1
Download script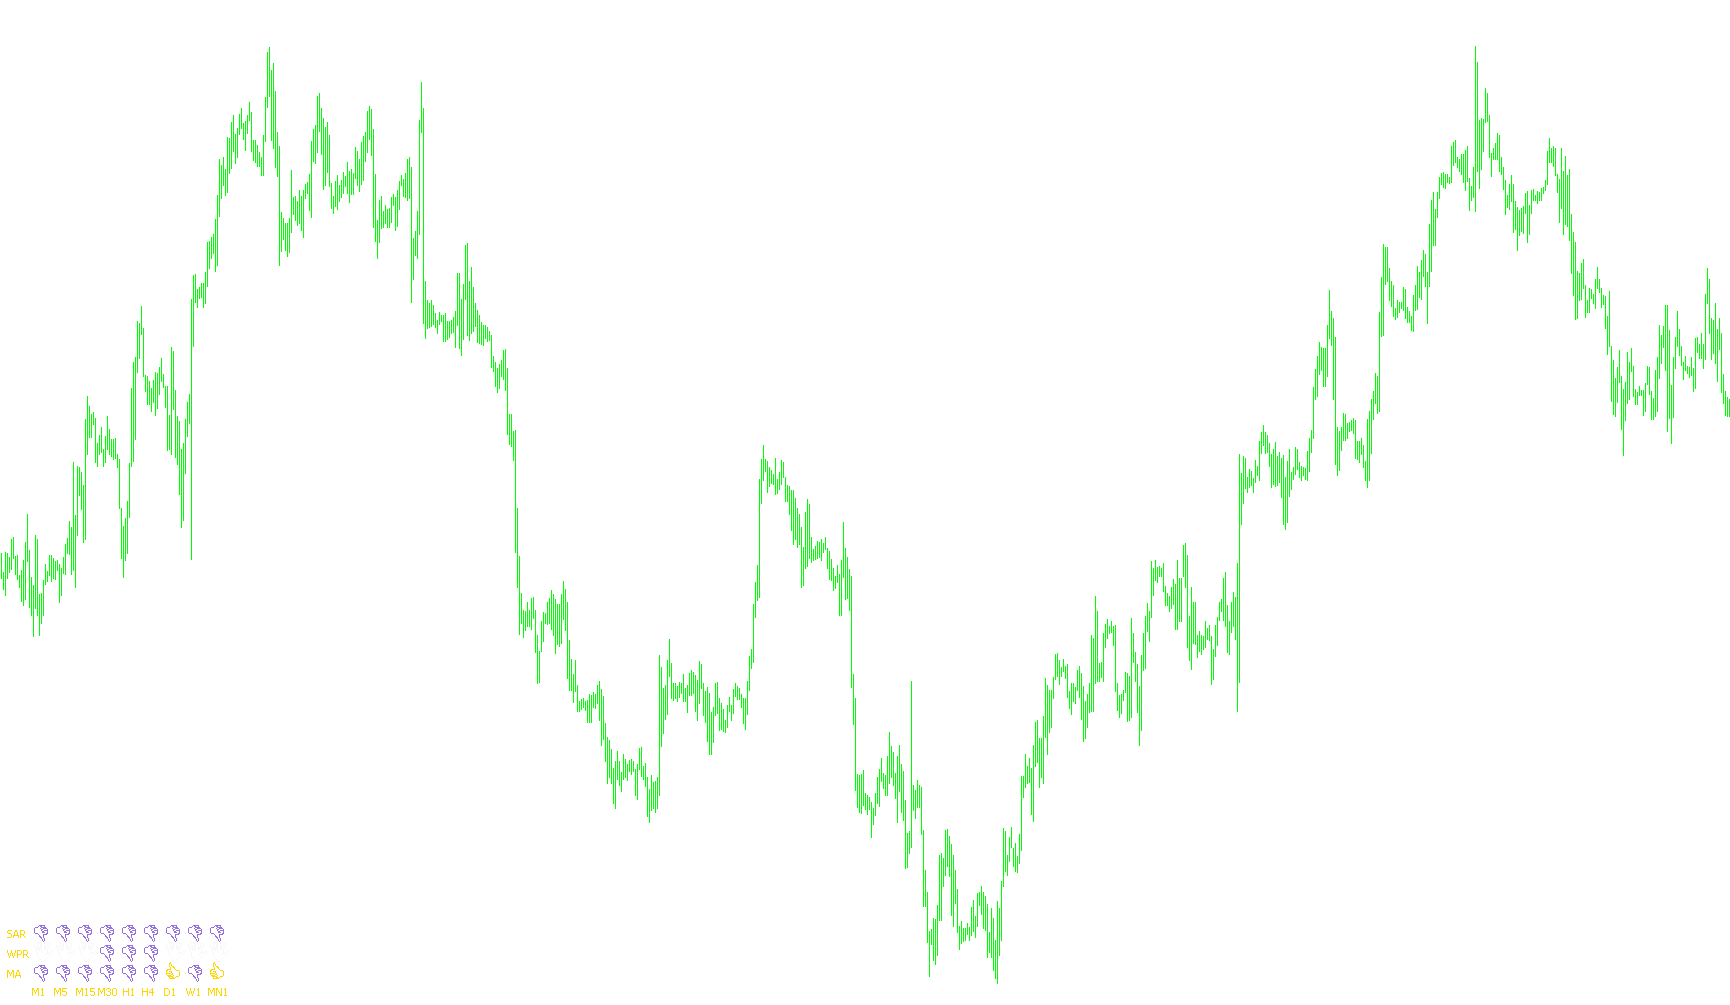
This script functions as a comprehensive multi-timeframe visual dashboard designed to provide traders with an at-a-glance overview of market conditions across various intervals. Instead of making you switch between different charts, it consolidates the technical status of multiple timeframes into a single, organized table directly on your primary trading screen.
How the Dashboard Works
The tool organizes data into a structured grid where each row and column represents a specific dimension of market analysis:
- Timeframe Coverage: The dashboard tracks nine different time periods simultaneously, ranging from very short-term scales (like 1-minute charts) to long-term horizons (such as monthly and yearly views).
- Technical Indicators: For every timeframe listed, the script monitors three distinct types of technical analysis:
- Moving Averages (MA): Used to identify the general trend direction.
- Williams Percent Range (WPR): Used to gauge momentum and potential overbought or oversold conditions.
- Parabolic SAR: Used to identify trend reversals and entry/exit points.
Visual Logic & Signals
The core logic of the script translates complex mathematical data into simple color-coded icons for immediate recognition:
- Trend Identification: The script compares different moving average speeds. If the short-term momentum is higher than the long-term average, it displays a "Buy" signal; otherwise, it signals a "Sell" position.
- Momentum Awareness: It analyzes the Williams Percent Range to see if the market is reaching extremes. It provides specific signals for when prices are at significant lows (Buy) or highs (Sell), and remains neutral (no signal) when the market is in a "sideways" or undecided state.
- Reversal Detection: It monitors the Parabolic SAR relative to current price action to determine if the current trend is still healthy or if a reversal is likely, updating the icons accordingly.
User Experience
The dashboard is designed for efficiency and clarity:
- Dynamic Updates: The icons update in real-time as new price data arrives, ensuring the dashboard always reflects the most current market state.
- Color Coding: It uses distinct colors (such as Gold for Buys and Medium Purple for Sells) so you can instantly spot discrepancies or convergences between different timeframes.
- Clean Interface: The script automatically manages its own "footprint" on your chart—creating the table when loaded and cleaning it up completely when removed, ensuring your workspace remains tidy.
In short, this tool acts as a "Command Center," allowing you to see if the 1-minute, 1-hour, and Daily charts are all in agreement before you make a trade decision.
//+------------------------------------------------------------------+
//|                                                  signalTable.mq4 |
//|                                                     Antonuk Oleg |
//|                                            antonukoleg@gmail.com |
//+------------------------------------------------------------------+
#property copyright "Antonuk Oleg"
#property link      "antonukoleg@gmail.com"
//----
#property indicator_chart_window
extern int scaleX=22,
           scaleY=20,
           offsetX=35,
           offsetY=20,
           fontSize=20,
           corner=2,
           symbolCodeBuy=67,
           symbolCodeSell=68,
           symbolCodeNoSignal=73;
extern color signalBuyColor=Gold,
             signalSellColor=MediumPurple,
             noSignalColor=WhiteSmoke,
             textColor=Gold;
int period[]={1,5,15,30,60,240,1440,10080,43200};
string periodString[]={"M1","M5","M15","M30"," H1","H4","D1","W1","MN1"},
       // ñîçäàåì åùå îäèí ìàññèâ ñ íàçâàíèÿìè èíäèêàòîðîâ
       signalNameString[]={"MA","WPR","SAR"};
//+------------------------------------------------------------------+
//|                                                                  |
//+------------------------------------------------------------------+
int init()
  {
   // òàáëèöà ñèãíàëîâ
   for(int x=0;x<9;x++)
      for(int y=0;y<3;y++)
        {
         ObjectCreate("signaltrend"+x+y,OBJ_LABEL,0,0,0,0,0);
         // èçìåíÿåì óãîë ïðèâÿçêè
         ObjectSet("signaltrend"+x+y,OBJPROP_CORNER,corner);
         ObjectSet("signaltrend"+x+y,OBJPROP_XDISTANCE,x*scaleX+offsetX);
         ObjectSet("signaltrend"+x+y,OBJPROP_YDISTANCE,y*scaleY+20);
         ObjectSetText("signaltrend"+x+y,CharToStr(symbolCodeNoSignal),
                       fontSize,"Wingdings",noSignalColor);
        }
   // íàçâàíèÿ òàéìôðåéìîâ
   for(x=0;x<9;x++)
     {
      ObjectCreate("textPeriodtrend"+x,OBJ_LABEL,0,0,0,0,0);
      // èçìåíÿåì óãîë ïðèâÿçêè
      ObjectSet("textPeriodtrend"+x,OBJPROP_CORNER,corner);
      ObjectSet("textPeriodtrend"+x,OBJPROP_XDISTANCE,x*scaleX+offsetX);
      ObjectSet("textPeriodtrend"+x,OBJPROP_YDISTANCE,offsetY-10);
      ObjectSetText("textPeriodtrend"+x,periodString[x],8,"Tahoma",textColor);
     }
   // íàçâàíèÿ èíäèêàòîðîâ
   for(y=0;y<3;y++)
     {
      ObjectCreate("textSignaltrend"+y,OBJ_LABEL,0,0,0,0,0);
      // èçìåíÿåì óãîë ïðèâÿçêè
      ObjectSet("textSignaltrend"+y,OBJPROP_CORNER,corner);
      ObjectSet("textSignaltrend"+y,OBJPROP_XDISTANCE,offsetX-25);
      ObjectSet("textSignaltrend"+y,OBJPROP_YDISTANCE,y*(scaleY)+offsetY+8);
      ObjectSetText("textSignaltrend"+y,signalNameString[y],8,"Tahoma",textColor);
     }
   return(0);
  }
//+------------------------------------------------------------------+
//|                                                                  |
//+------------------------------------------------------------------+
int start()
  {
   for(int x=0;x<9;x++)
     {
      // ñèãíàë íà ïîêóïêó
      if(iMA(Symbol(),period[x],13,0,0,0,0)>iMA(Symbol(),period[x],24,0,0,0,0))
         ObjectSetText("signaltrend"+x+"0",CharToStr(symbolCodeBuy),fontSize,"Wingdings",signalBuyColor);
      // ñèãíàë íà ïðîäàæó
      else
         ObjectSetText("signaltrend"+x+"0",CharToStr(symbolCodeSell),fontSize,"Wingdings",signalSellColor);
     }
   for(x=0;x<9;x++)
     {
      // ñèãíàë íà ïîêóïêó
      if(MathAbs(iWPR(Symbol(),period[x],13,0))<20.0)
         ObjectSetText("signaltrend"+x+"1",CharToStr(symbolCodeBuy),fontSize,"Wingdings",signalBuyColor);
      // ñèãíàë íà ïðîäàæó
      else if(MathAbs(iWPR(Symbol(),period[x],13,0))>80.0)
            ObjectSetText("signaltrend"+x+"1",CharToStr(symbolCodeSell),fontSize,"Wingdings",signalSellColor);
      // íåò ñèãíàëà
         else
            ObjectSetText("signaltrend"+x+"1",CharToStr(symbolCodeNoSignal),fontSize,"Wingdings",noSignalColor);
     }
   for(x=0;x<9;x++)
     {
      // ñèãíàë íà ïîêóïêó
      if(iSAR(Symbol(),period[x],0.02,0.2,0)<Close[0])
         ObjectSetText("signaltrend"+x+"2",CharToStr(symbolCodeBuy),fontSize,"Wingdings",signalBuyColor);
      // ñèãíàë íà ïðîäàæó
      else
         ObjectSetText("signaltrend"+x+"2",CharToStr(symbolCodeSell),fontSize,"Wingdings",signalSellColor);
     }
   return(0);
  }
//+------------------------------------------------------------------+
//|                                                                  |
//+------------------------------------------------------------------+
int deinit()
  {
   // ïðè óäàëåíèè íàøåãî èíäèêàòîðà íóæíî óäàëèòü âñå îáúåêòû,
   // êîòîðûå ìû óæå ñîçäàëè
  // ObjectsDeleteAll();

     for(int x=0;x<9;x++)
      for(int y=0;y<9;y++)
      {

 //  ObjectsDeleteAll();
 ObjectDelete("signaltrend"+x+y);
 ObjectDelete("textPeriodtrend"+x);
 ObjectDelete("textSignaltrend"+y);
 ObjectDelete("signaltrend"+x+"0");
 ObjectDelete("signaltrend"+x+"1");
 ObjectDelete("signaltrend"+x+"2");
 }
   return(0);
  }
//+------------------------------------------------------------------+
Comments