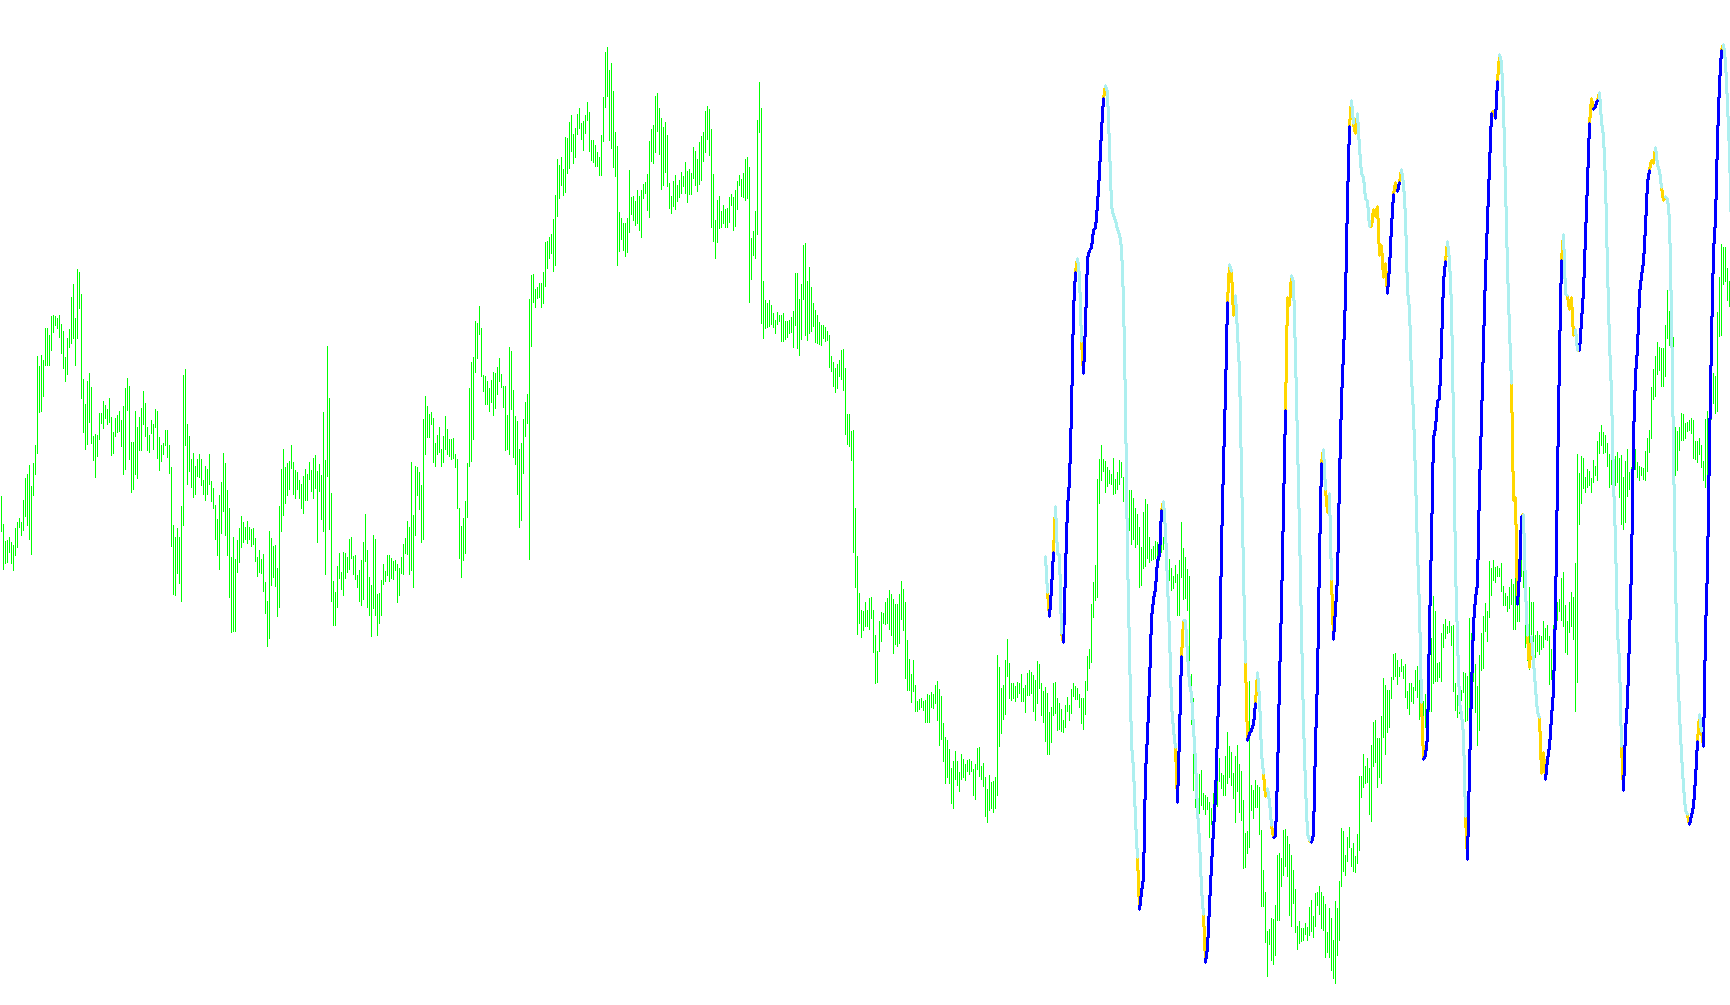
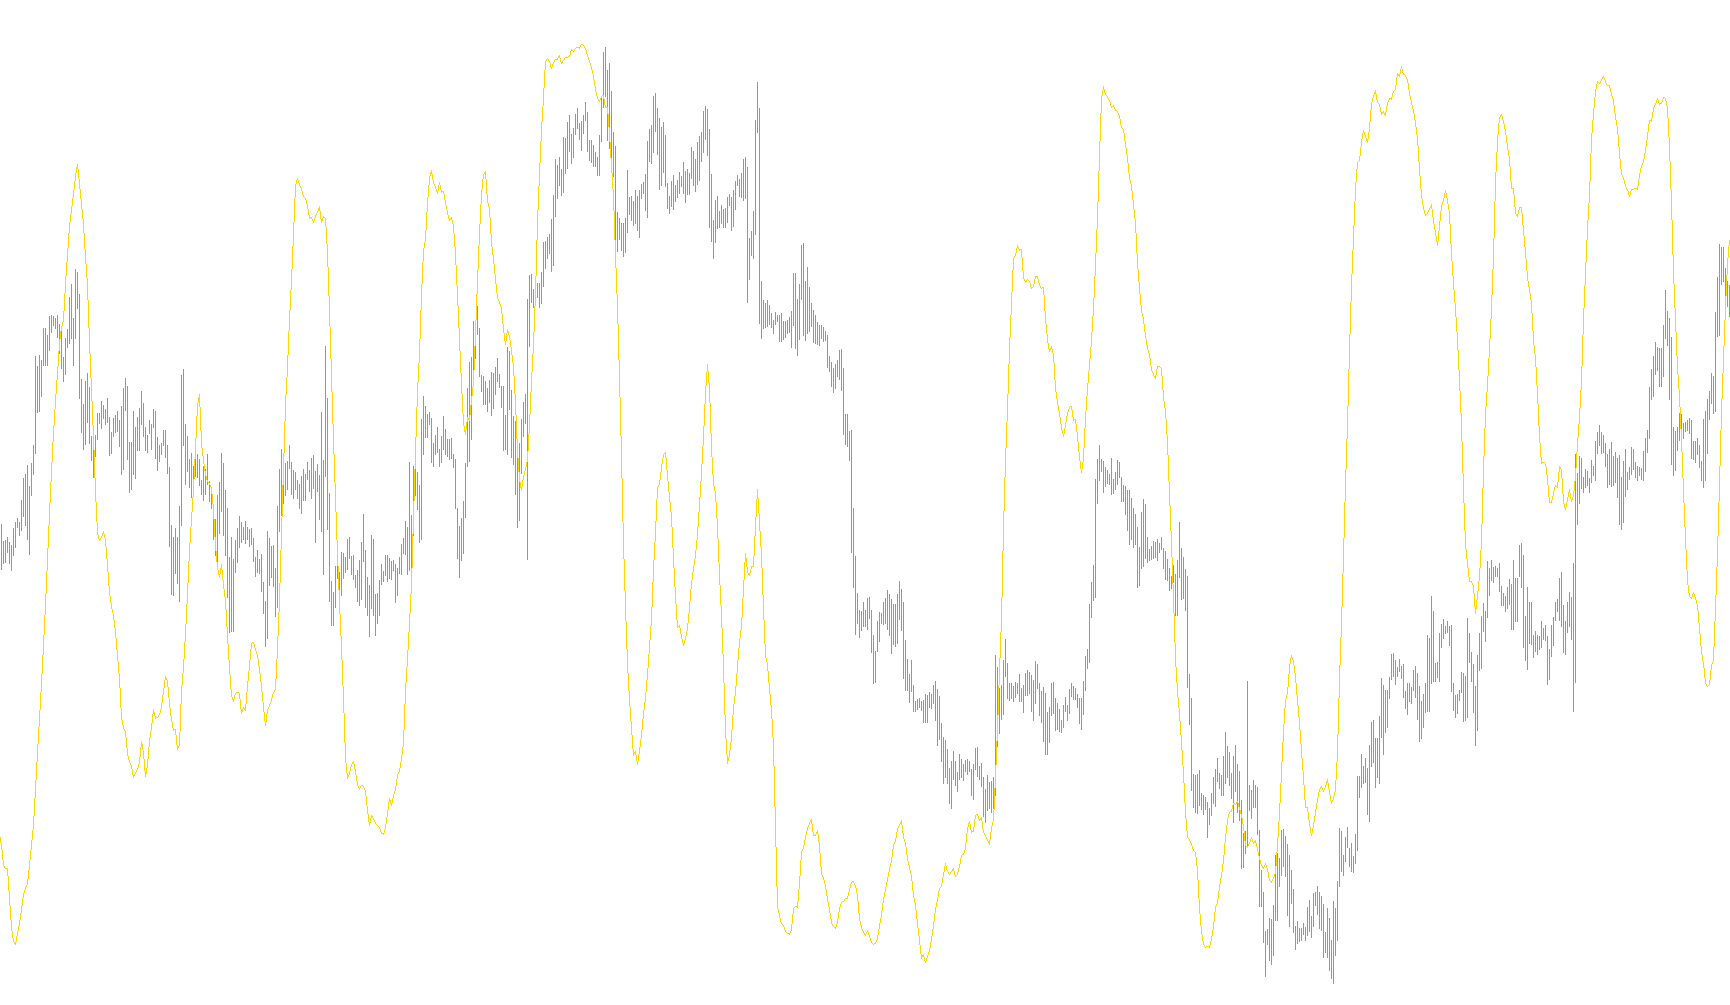
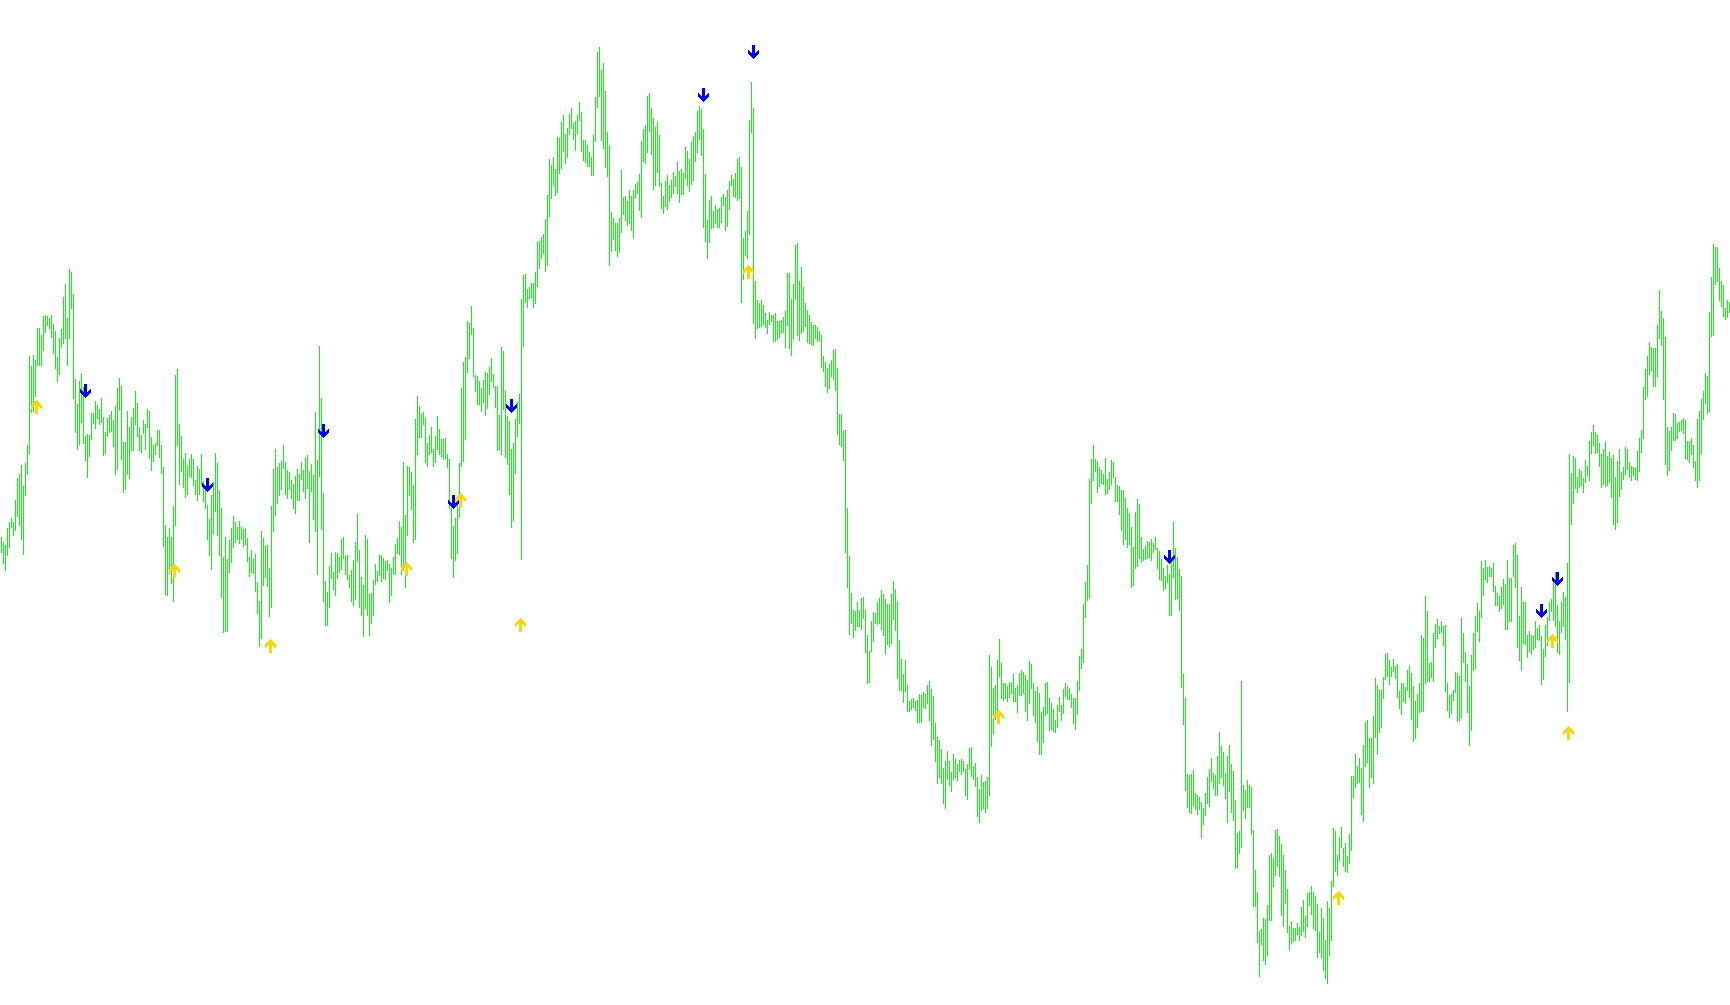
HLCrossSig for WPR
Indicator

HLCrossSig for WPR

iATRiWPRiMA
indi2csv
Indicator

indi2csv

iCCIiATRiMACDiRSI

Synchronizes historical price action and multiple technical oscillators into a structured CSV format for external quantitative analysis.

i_daywpr_v1_1
Indicator

i_daywpr_v1_1

iWPR

This indicator calculates the Williams %R oscillator by dynamically determining the count of candles within a specific multi-day window rather than using a fixed bar period.

JMA_WPR
Indicator

JMA_WPR

iWPR

This indicator applies a Jurik Moving Average (JMA) smoothing algorithm to the Williams Percent Range (WPR) to filter market noise and provide a more fluid momentum trajectory.

LSwpr_in+Color
Indicator

LSwpr_in+Color

iWPR

This indicator calculates a weighted sum of Williams Percent Range (WPR) values across a defined period to visualize momentum trends through color-coded price velocity.

LSwpr_in_Color
Indicator

LSwpr_in_Color

iWPR
LSwpr_in_Color_mtf
Indicator

LSwpr_in_Color_mtf

iWPR

This indicator calculates a Linear Smoothed Weighted oscillator based on the Williams Price Range to visualize momentum shifts across multiple timeframes with dynamic color coding.

ma-wpr
Indicator

ma-wpr

iWPR

This indicator calculates a rolling arithmetic average of the Williams Percent Range to filter out short-term volatility noise and identify trend momentum.

ma-wpr_001
Indicator

ma-wpr_001

iWPR

This indicator calculates a moving average of the Williams Percent Range to filter high-frequency noise and identify underlying trend momentum.

Indicator

MACD ASCTrend1sig Audible

iWPRiMACD
Indicator

MACD ASCTrend1sig Audible_v1

iWPRiMACD
MBKAsctrend3times
Indicator

MBKAsctrend3times

iWPR

This indicator identifies trend reversals by calculating a weighted average of three different Williams %R periods combined with a long-term structural filter.

MBKAsctrend3times1
Indicator

MBKAsctrend3times1

iWPR

This indicator identifies trend reversals by calculating a weighted average of three distinct Williams Percent Range periods combined with a long-term momentum filter.

MBKAsctrend3times1_v1
Indicator

MBKAsctrend3times1_v1

iWPR

This indicator identifies bullish and bearish reversals by calculating a weighted average of three distinct Williams Percent Range periods combined with a long-term trend filter.

MBKAsctrend3times_v1
Indicator

MBKAsctrend3times_v1

iWPR
MBKAsctrend3times_v2
Indicator

MBKAsctrend3times_v2

iWPR

This indicator identifies trend shifts by calculating a weighted average of three different Williams Percent Range (WPR) periods combined with a long-term structural filter.

Indicator

MPi-ASC

iWPR
Indicator

MPi-ASC_v1

iWPR
Indicator

MTF_WPR (1)

iWPR
Indicator

MTF_WPR3

iWPR
Indicator

MTF_WPR_1_fixed

iWPR
Indicator

Multi pair WPR + mtf

iWPR
Multiwprhist
Indicator

Multiwprhist

iWPR

This indicator aggregates Williams Percent Range values across four major currency pairs to derive a unified bullish or bearish bias based on collective momentum thresholds.

MultiwprhistUSD
Indicator

MultiwprhistUSD

iWPR

This indicator synchronizes Williams Percent Range data across multiple major currency pairs to derive a composite bullish or bearish sentiment histogram based on collective momentum shifts.

Indicator

Multi_Oscillator_v1

iCCIiMFIiRSIiStochastic
nd1
Indicator

nd1

iWPR

The algorithm identifies trend shifts by calculating an average price range and cross-referencing it against specific price gaps and the Williams Percent Range to trigger high-volatility boundary signals.

nd1_v1
Indicator

nd1_v1

iWPR

This indicator dynamically identifies trend shifts by calculating the relationship between price volatility ranges and Williams Percent Range extremes to filter market noise.

nd2
Indicator

nd2

iWPR

This indicator identifies trend exhaustion by calculating dynamic price range thresholds and applying a smoothed Williams Percent Range filter to trigger histogram signals.

nd2_v1
Indicator

nd2_v1

iWPR

This indicator identifies trend shifts by analyzing price volatility ranges and the Williams Percent Range to pinpoint overextended market movements.

Indicator

NeuroTrend_Indicator

iWPRiMAiRSIiStochastic
ninetfmovement
Indicator

ninetfmovement

iWPRiMAOnArray

This indicator evaluates price action across nine concurrent timeframes to visualize high-low volatility ranges and detect synchronized bullish or bearish momentum shifts.

NMAZZ
Indicator

NMAZZ

iCCIiWPR

This indicator identifies potential trend exhaustion by detecting simultaneous extreme oversold or overbought conditions across the CCI and Williams%R oscillators coinciding with ZigZag structural peaks.

NoName02
Indicator

NoName02

iWPR

This indicator identifies trend reversals by detecting breaches in the William's Percent Range extremes relative to a dynamic risk-adjusted threshold.

PerkyAsctrend1-2
Indicator

PerkyAsctrend1-2

iWPR

This indicator identifies trend exhaustion by monitoring price expansion relative to average volatility, utilizing a modified Williams %R and historical range calculations to signal peak reversals.

PerkyAsctrend1
Indicator

PerkyAsctrend1

iWPR

This indicator identifies momentum shifts by analyzing relative price expansion against average volatility and detecting specific breakout thresholds using a modified William's Percent Range calculation.

PerkyAsctrend11
Indicator

PerkyAsctrend11

iWPR

Identifies trend reversals by monitoring price action deviations against rolling average ranges combined with a smoothed Williams Percent Range filter.

PerkyAsctrend11_v1
Indicator

PerkyAsctrend11_v1

iWPR

The logic identifies trend reversals by calculating the average price volatility and scanning for significant expansion gaps relative to the Williams %R oscillator's momentum values.

PerkyAsctrend1_v1
Indicator

PerkyAsctrend1_v1

iWPR

The indicator identifies structural trend shifts by analyzing price expansion relative to average volatility using a dynamic Williams Percent Range calculation.

PerkyAsctrend1_v2
Indicator

PerkyAsctrend1_v2

iWPR

The indicator identifies trend reversals by correlating Weighted Price Range (WPR) exhaustion levels with significant price-action volatility spikes and multi-bar expansion thresholds.

PerkyAsctrend1_v3
Indicator

PerkyAsctrend1_v3

iWPR

This indicator identifies trend reversals by calculating dynamic volatility ranges to filter Williams Percent Range (WPR) extremes and pinpoint breakout levels.

PerkyAsctrend1_v4
Indicator

PerkyAsctrend1_v4

iWPR

This indicator identifies trend reversals by monitoring the William %R oscillator relative to dynamic volatility thresholds calculated from average bar ranges and price movement spikes.

RWM
Indicator

RWM

iWPR

This indicator utilizes triple exponential smoothing on the Williams Percent Range (WPR) to identify trend reversals and momentum extremes through specific threshold triggers.

SDX-TzPivots-alerts_test1
Indicator

SDX-TzPivots-alerts_test1

iACiCCIiDeMarkeriATR
Sem WPR
Indicator

Sem WPR

iWPR

This indicator visualizes directional momentum shifts by identifying trend reversals and strength fluctuations based on the Williams %R oscillator's movement relative to extreme boundary thresholds.

signalTable candle
Indicator

signalTable candle

iWPRiMAiSAR

This indicator visualizes real-time trend alignment by comparing Moving Average slopes, Williams Percent Range boundaries, and Parabolic SAR positions across nine distinct temporal scales.

signalTable
Indicator

signalTable

iWPRiMAiSAR
Indicator

signalTable_v1

iWPRiMAiSAR
SmWPR
Indicator

SmWPR

iWPR

This indicator applies a multi-stage recursive smoothing filter to the Williams Percent Range (WPR) to generate a stabilized momentum signal and dynamic entry triggers.

SmWPRExp
Indicator

SmWPRExp

iWPR

This indicator processes the Williams Percent Range (WPR) through a triple exponential moving average filter to identify overextended price boundaries and trigger discrete buy/sell levels.

SmWPRExp_nR
Indicator

SmWPRExp_nR

iWPR