Donchian%20Channels%20plus%20SD%20borders
Download script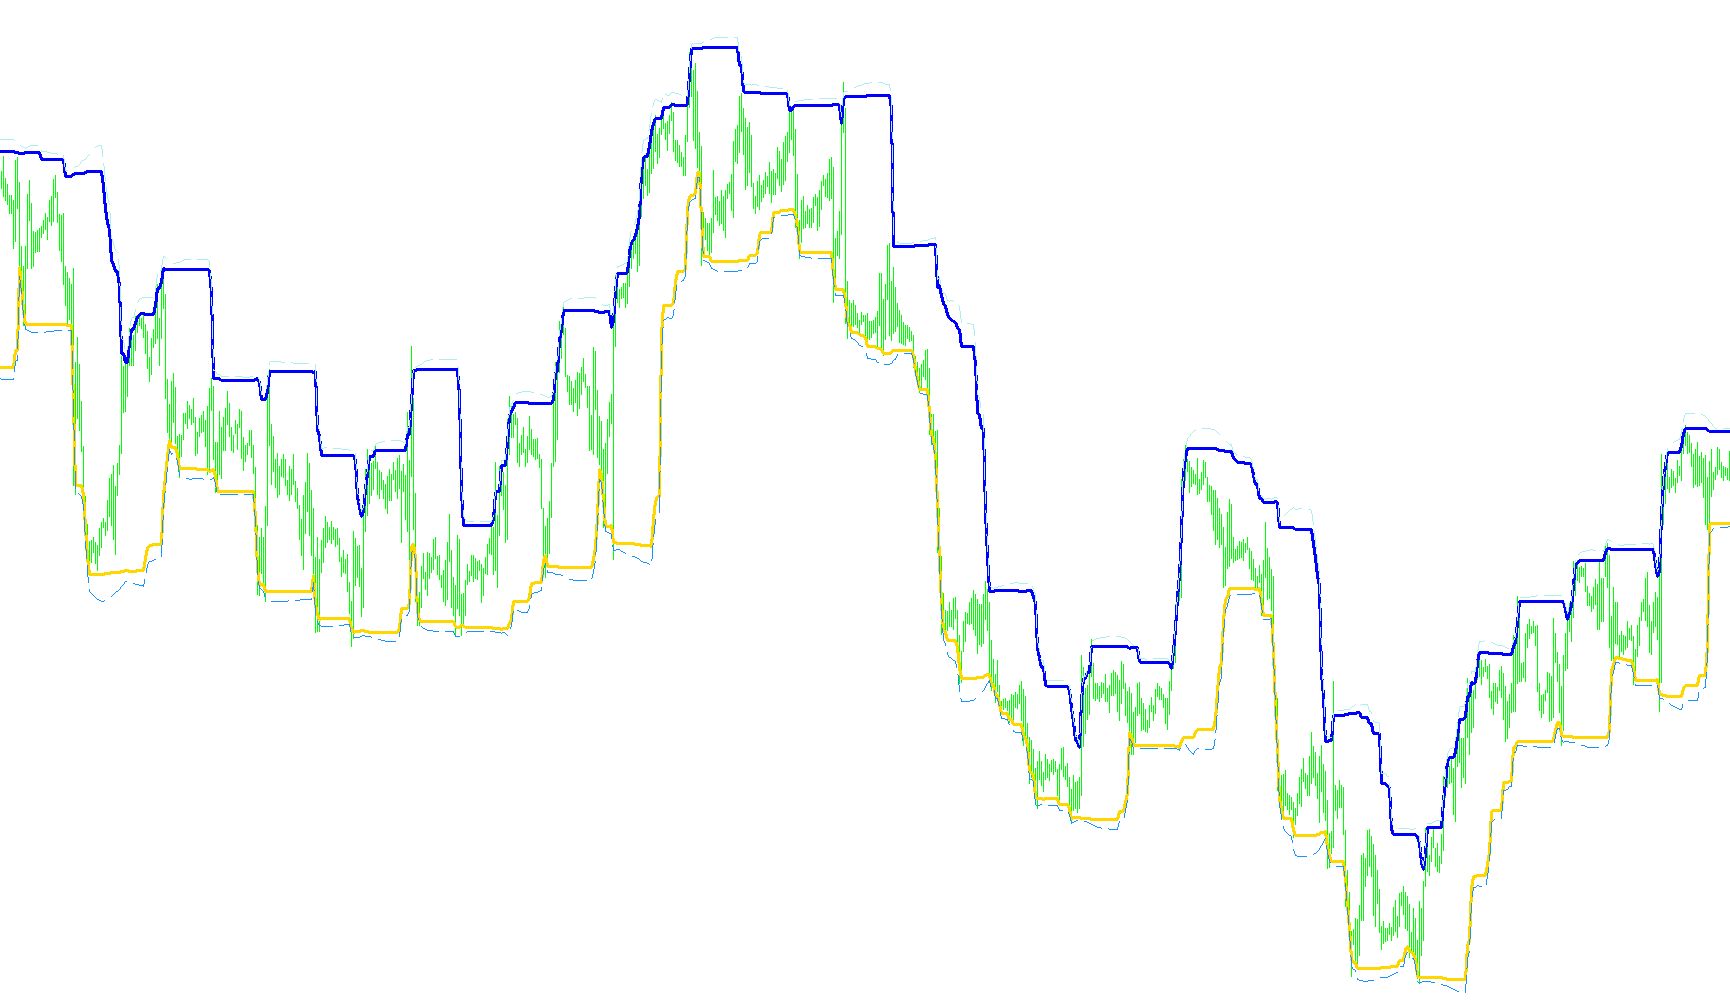
This tool is a specialized visual aid designed to help traders identify and visualize price boundaries on a financial chart. It functions by automatically plotting "channels" that track the historical movement of a currency or asset, helping users understand the range within which the price has recently been trading.
How the Logic Works
The script analyzes a specific number of past candles (the "Period") to determine the current market boundaries. Rather than just looking at the most recent price, it scans back through history to find significant highs and lows. Based on your settings, it calculates these boundaries using one of three different logic types:
- Extreme Points: It can identify the absolute highest and lowest prices reached during the period.
- Opening Prices: It focuses on the "Open" price of the candles where those highs and lows occurred, which is often used to find more stable points of concentration.
- Median Points: It calculates a balanced middle ground between the opening price and the extreme high or low of those specific candles.
Key Visual Features
The script provides several layers of information to give a more comprehensive view of the market:
1. Dynamic Boundaries (Margins) Once the highs and lows are identified, the tool applies a "Margin." This allows you to slightly expand or contract the visual boundaries. It essentially creates a buffer zone so that the lines aren't pinned exactly to the tip of a wick, making it easier to see the overall "corridor" of price action.
2. Standard Deviation Envelopes (SD Border) For traders who want to see volatility, there is an optional additional layer. This calculates the "Standard Deviation"—a mathematical measure of how much the price swings away from its average. It projects extra lines above and below the main channel. If the price breaks out of these outer boundaries, it often signals that the market is moving with unusual strength or volatility.
3. Forward Positioning (Advance) The logic includes a setting to shift the lines forward on the chart. This allows traders to adjust the visual placement of the data to better align with their specific viewing preferences or to account for differences in how they interpret "real-time" data.
Summary for the Trader
In simple terms, this script draws a "track" on your chart. By looking at where the price is currently trading relative to these lines, you can identify when a market is reaching its historical limits (resistance) or finding new support levels. The inclusion of the volatility envelopes adds an extra layer of protection, helping you see not just where the price is, but how aggressively it is moving toward those boundaries.
//+------------------------------------------------------------------+
//|                      Donchian Channels - Generalized version.mq4 |
//|                         Copyright © 2005, Luis Guilherme Damiani |
//|                                      http://www.damianifx.com.br |
//+------------------------------------------------------------------+
#property copyright "Copyright © 2005, Luis Guilherme Damiani"
#property link      "http://www.damianifx.com.br"

#property indicator_chart_window
#property indicator_buffers 4
#property indicator_color1 Magenta
#property indicator_color2 Magenta
#property indicator_color3 Purple
#property indicator_color4 Purple

//Periods: number of bars used for calculating the Donchian channel
//Extremes: if 1 uses the highest high and the lowest low -> I do not recomend using this
//			if 0 uses the open of the extremes bar -> the open point of a bar (as well as the close
//				are the points of maximum probability of concentration of the prices during the bar
//			if 3 uses the median point most extreme open and lowest low or highest high
//Margins: is the percent of the channel subtrated from the channel border before printing it, negative values are allowed
//Advance: the numbers of bars ahead
//---- input parameters
extern int       Periods=24;
extern int       Extremes=3;
extern int       Margins=-2;
extern int       Advance=0;
extern   int      max_bars=2000;
extern bool SD_border= true;
extern double SD_factor=0.2;

//---- buffers
double ExtMapBuffer0[];
double ExtMapBuffer1[];
double BorderSupBuffer2[];
double BorderInfBuffer3[];
//+------------------------------------------------------------------+
//| Custom indicator initialization function                         |
//+------------------------------------------------------------------+
int init()
  {
//---- indicators
   SetIndexStyle(0,DRAW_LINE,1,3);
   SetIndexBuffer(0,ExtMapBuffer0);
   SetIndexStyle(1,DRAW_LINE,1,3);
   SetIndexBuffer(1,ExtMapBuffer1);
   SetIndexStyle(2,DRAW_LINE,1,1);
   SetIndexBuffer(2,BorderSupBuffer2);
   SetIndexStyle(3,DRAW_LINE,1,1);
   SetIndexBuffer(3,BorderInfBuffer3);

//----
   return(0);
  }
//+------------------------------------------------------------------+
//| Custor indicator deinitialization function                       |
//+------------------------------------------------------------------+
int deinit()
  {
//----

//----
   return(0);
  }
//+------------------------------------------------------------------+
//| Custom indicator iteration function                              |
//+------------------------------------------------------------------+
int start()
{
   int    fixed_bars=IndicatorCounted();
   //----

   //int shift=0;//, cnt(0), loopbegin(0);
   double smin=0, smax=0, SsMax=0, SsMin=0;
   //Variables : bar(0), prevbars(0), start(0), cs(0), prevcs(0),commodt(0);

   for (int shift=0;shift< max_bars;shift++)
   {
	  if (Extremes ==1)
	  {
		 SsMax = High[Highest(NULL,0,MODE_HIGH,Periods,shift)];
		 SsMin = Low[Lowest(NULL,0,MODE_LOW,Periods,shift)];
	  }
	  else if (Extremes == 3)
	  {
		 SsMax = (Open[Highest(NULL,0,MODE_OPEN,Periods,shift)]+High[Highest(NULL,0,MODE_HIGH,Periods,shift)])/2;
		 SsMin = (Open[Lowest(NULL,0,MODE_OPEN,Periods,shift)]+Low[Lowest(NULL,0,MODE_LOW,Periods,shift)])/2;
	  }
	     else
	  {
		SsMax = Open[Highest(NULL,0,MODE_OPEN,Periods,shift)];
		SsMin = Open[Lowest(NULL,0,MODE_OPEN,Periods,shift)];
	  }
	  smin = SsMin+(SsMax-SsMin)*Margins/100;
	  smax = SsMax-(SsMax-SsMin)*Margins/100;


	  ExtMapBuffer0[shift-Advance]=smin;
	  ExtMapBuffer1[shift-Advance]=smax;
	  if(SD_border)
	  {
	     double sd=iStdDev(NULL,0,Periods,MODE_LWMA,0,PRICE_TYPICAL,shift-Advance);
	     BorderSupBuffer2[shift-Advance]=smax+sd*SD_factor;
	     BorderInfBuffer3[shift-Advance]=smin-sd*SD_factor;

	  }
   }
//----
   return(0);
  }
//+------------------------------------------------------------------+
Comments