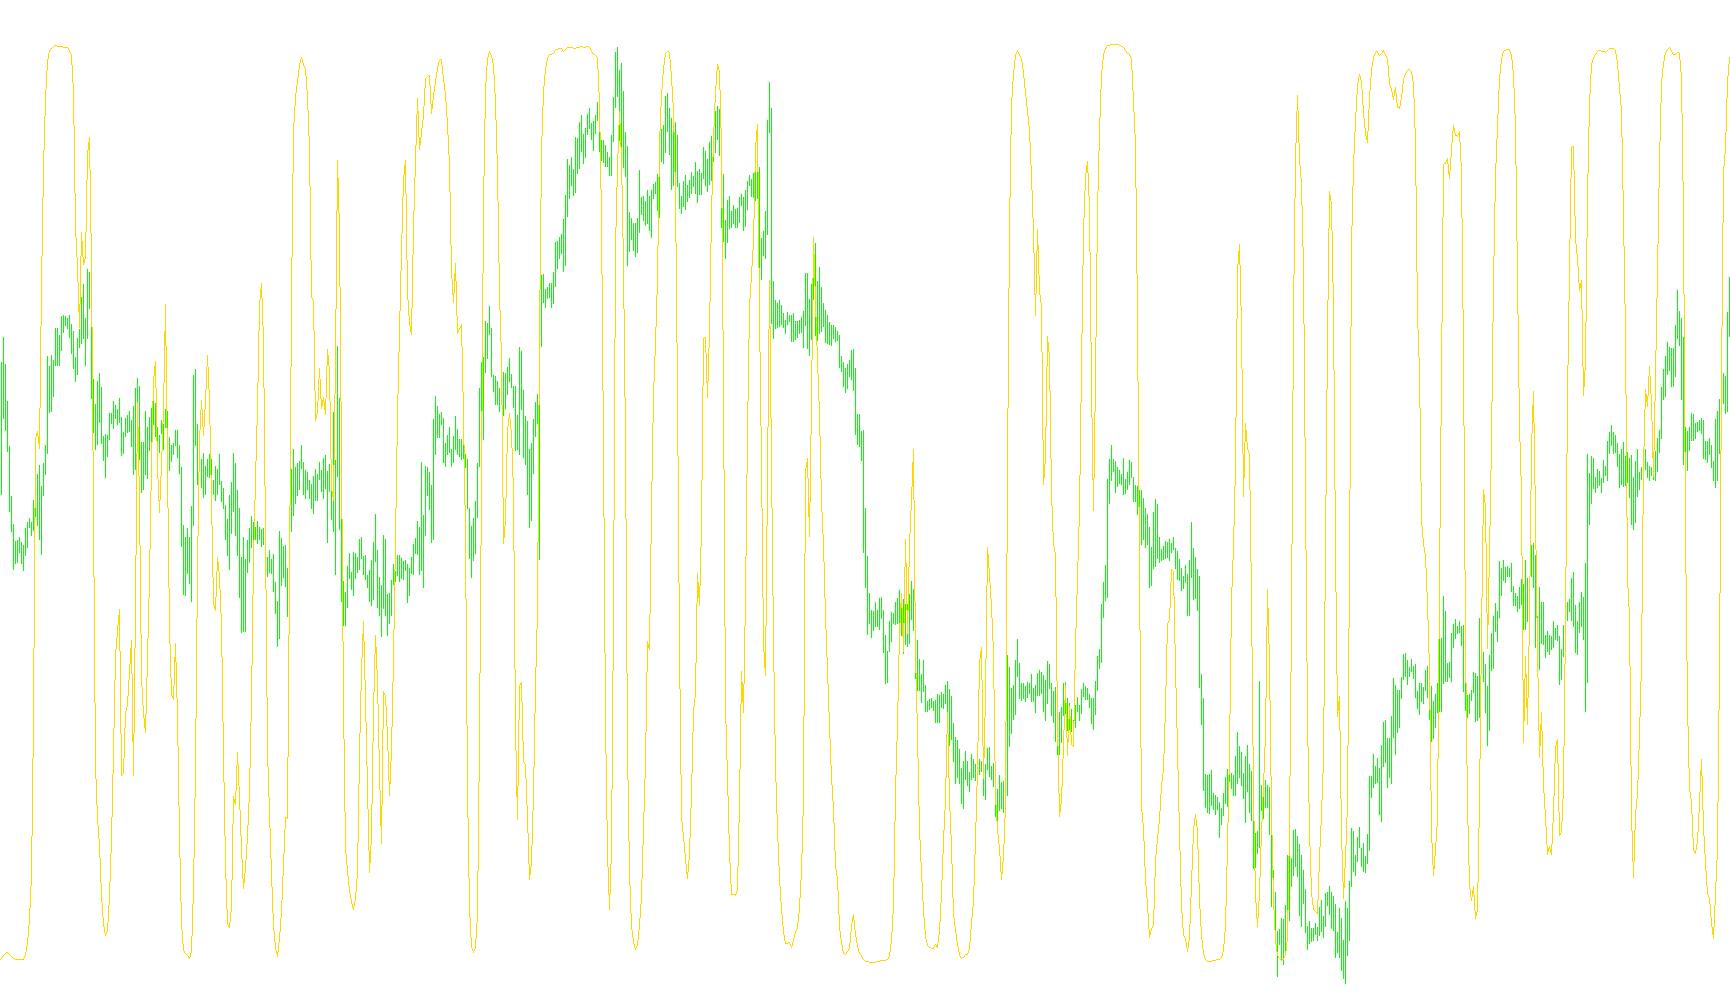
This tool is designed to monitor market momentum and identify specific points where a trend might be reaching an extreme, signaling a potential reversal or a need to exit a current position. It operates by transforming standard price data into a normalized coordinate system, allowing for more precise monitoring of "overbought" or "oversold" conditions.
How the Logic Works
1. Data Processing and Smoothing The script begins by analyzing the Relative Strength Index (RSI), a common tool used to measure the speed and change of price movements. Instead of using the raw RSI value, the script centers the data around a neutral midpoint. It then applies a specialized smoothing calculation (a Linear Weighted Moving Average) to this data. This step is crucial because it filters out "market noise," ensuring that the resulting signals are based on consistent trends rather than minor, erratic price fluctuations.
2. The Transformation Logic The core of the script involves a mathematical conversion that maps the smoothed momentum into a specific range. This converts the moving averages into a specialized value that fluctuates between specific boundaries. This allows the indicator to stay within a defined "window," making it much easier to identify when the market has pushed too far in one direction compared to its recent history.
3. Signal Detection and Alerts The script constantly monitors whether this transformed value crosses two primary thresholds:
- The Upper Boundary: When the value reaches or exceeds the top limit, it indicates that the upward momentum may be exhausted.
- The Lower Boundary: When the value falls to or below the bottom limit, it indicates that downward momentum may be reaching a turning point.
To ensure accuracy and prevent "false alarms," the script uses a memory logic system. It tracks the state of the previous bars to ensure that an alert is only triggered once per movement. Once a signal is captured, it resets its internal status so that it won't repeatedly notify you of the same price action until a new significant move occurs.
4. User Notifications When these specific thresholds are breached, the script provides real-time audible and visual alerts. These notifications are specifically framed as exit cues:
- A high-side alert suggests an opportunity to consider closing a "Buy" position.
- A low-side alert suggests an opportunity to consider closing a "Sell" position.
By distilling complex momentum data into these clear boundary triggers, the tool helps traders identify potential exhaustion points in the market at a glance.
//+------------------------------------------------------------------+
//|                                                        IFish.mq4 |
//|                                                          Kalenzo |
//|                                      bartlomiej.gorski@gmail.com |
//+------------------------------------------------------------------+
#property copyright "Kalenzo"
#property link      "bartlomiej.gorski@gmail.com"
//----
#property indicator_buffers 1
#property indicator_color1 Red
#property indicator_level1 0.5
#property indicator_level2 -0.5
//----
double value1[];
double value2[];
double ifish[];
double red[];
double green[];
double alertBar;
double prev;
double high=0.5;
double low=-0.5;
extern bool SoundON=true;
//----
#property indicator_separate_window
//+------------------------------------------------------------------+
//| Custom indicator initialization function                         |
//+------------------------------------------------------------------+
int init()
  {
//---- indicators
   IndicatorBuffers(3);
   SetIndexBuffer(0,ifish);
   SetIndexStyle(0,DRAW_LINE,STYLE_SOLID,1);
   SetIndexBuffer(1,value1);
   SetIndexBuffer(2,value2);
//----
   return(0);
  }
//+------------------------------------------------------------------+
//| Custom indicator deinitialization function                       |
//+------------------------------------------------------------------+
int deinit()
  {
//----
//----
   return(0);
  }
//+------------------------------------------------------------------+
//| Custom indicator iteration function                              |
//+------------------------------------------------------------------+
int start()
  {
   int limit;
   int counted_bars=IndicatorCounted();
   if(counted_bars<0) counted_bars=0;
   if(counted_bars>0) counted_bars--;
//----
   limit=Bars-counted_bars;
//----
   for(int i=0 ;i<=limit ;i++) value1[i]=0.1*(iRSI(Symbol(),0,5,PRICE_CLOSE,i)-50);
   for(int j=0 ;j<=limit ;j++) value2[j]=iMAOnArray(value1,0,9,0,MODE_LWMA,j);
   for(int f=0 ;f<=limit ;f++) ifish[f]=(MathExp(2*value2[f])-1)/(MathExp(2*value2[f])+1);
//----
   if(ifish[f]>=high && prev==0) prev=1;
   if(ifish[f]<=low && prev==0) prev=2;
   if(SoundON==true && prev==1 && ifish[f]>=high && Bars>alertBar) {Alert("IFISH Hit 0.5 or above exit Buy on ",Symbol()," Period ",Period());alertBar=Bars;prev=2;}
   if(SoundON==true && prev==2 && ifish[f]<=low && Bars>alertBar) {Alert("IFISH Hit -0.5 or below exit Sell on ",Symbol()," Period ",Period());alertBar=Bars;prev=1;}
//----
   return(0);
  }
//+------------------------------------------------------------------+
Comments