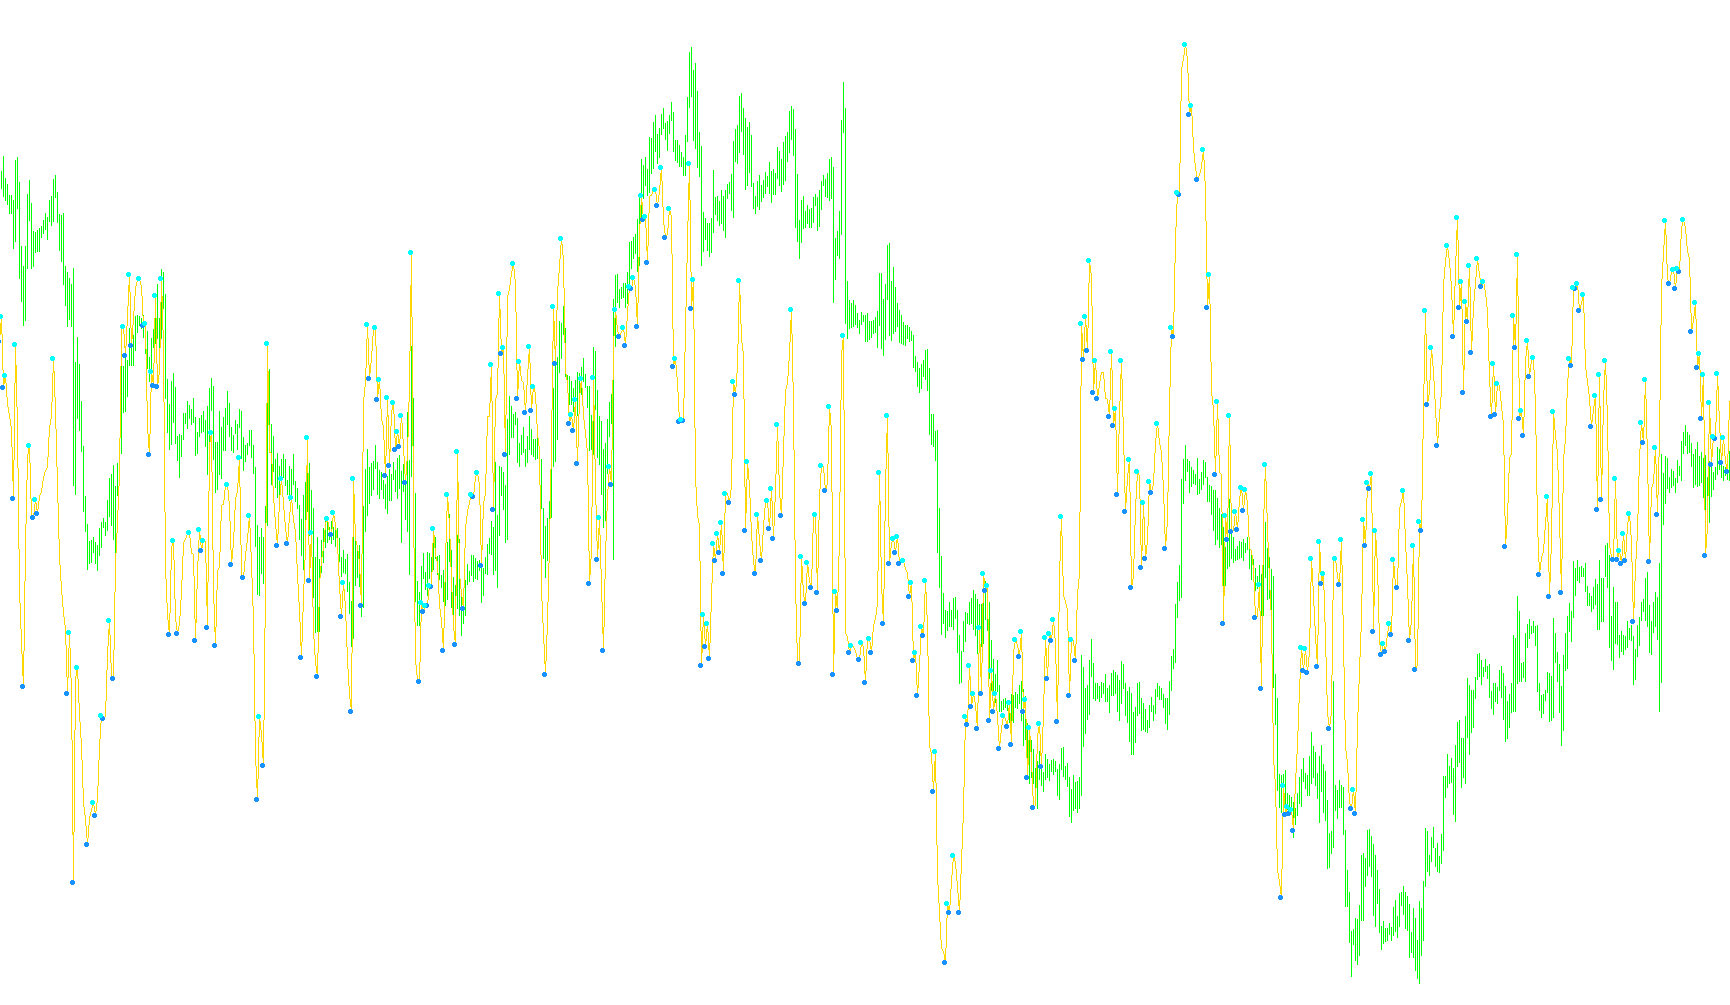
ATM_RSI_LiDo
Indicator

ATM_RSI_LiDo

iRSI

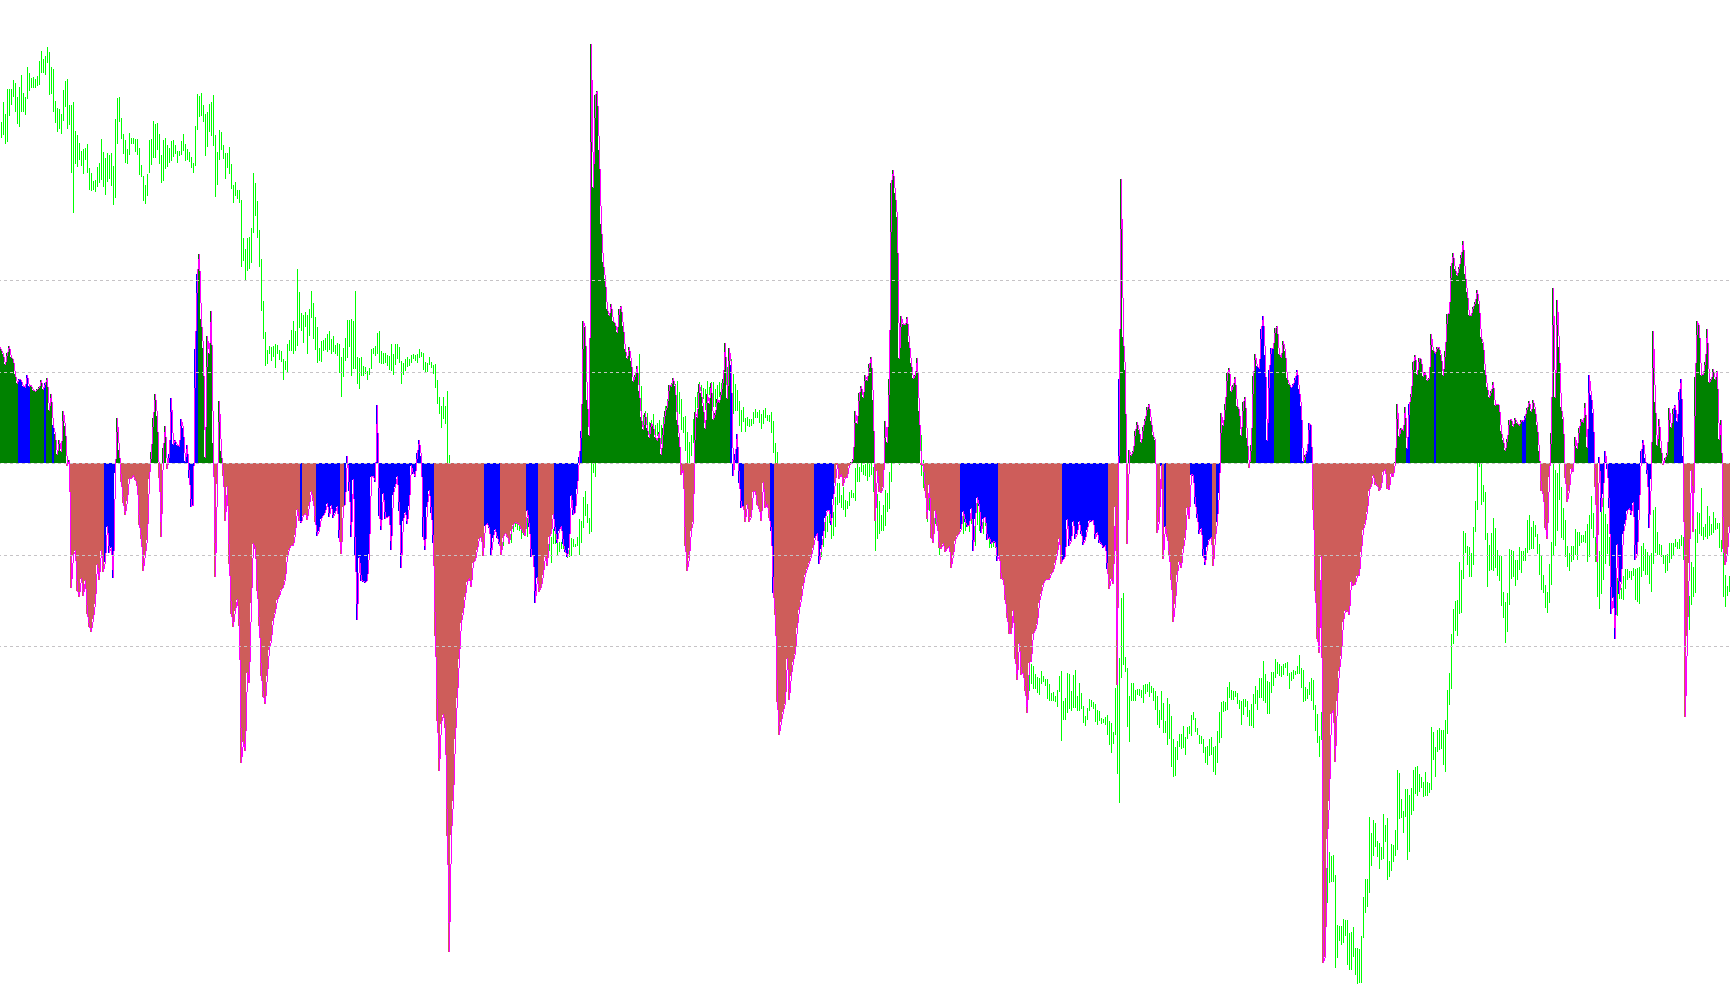
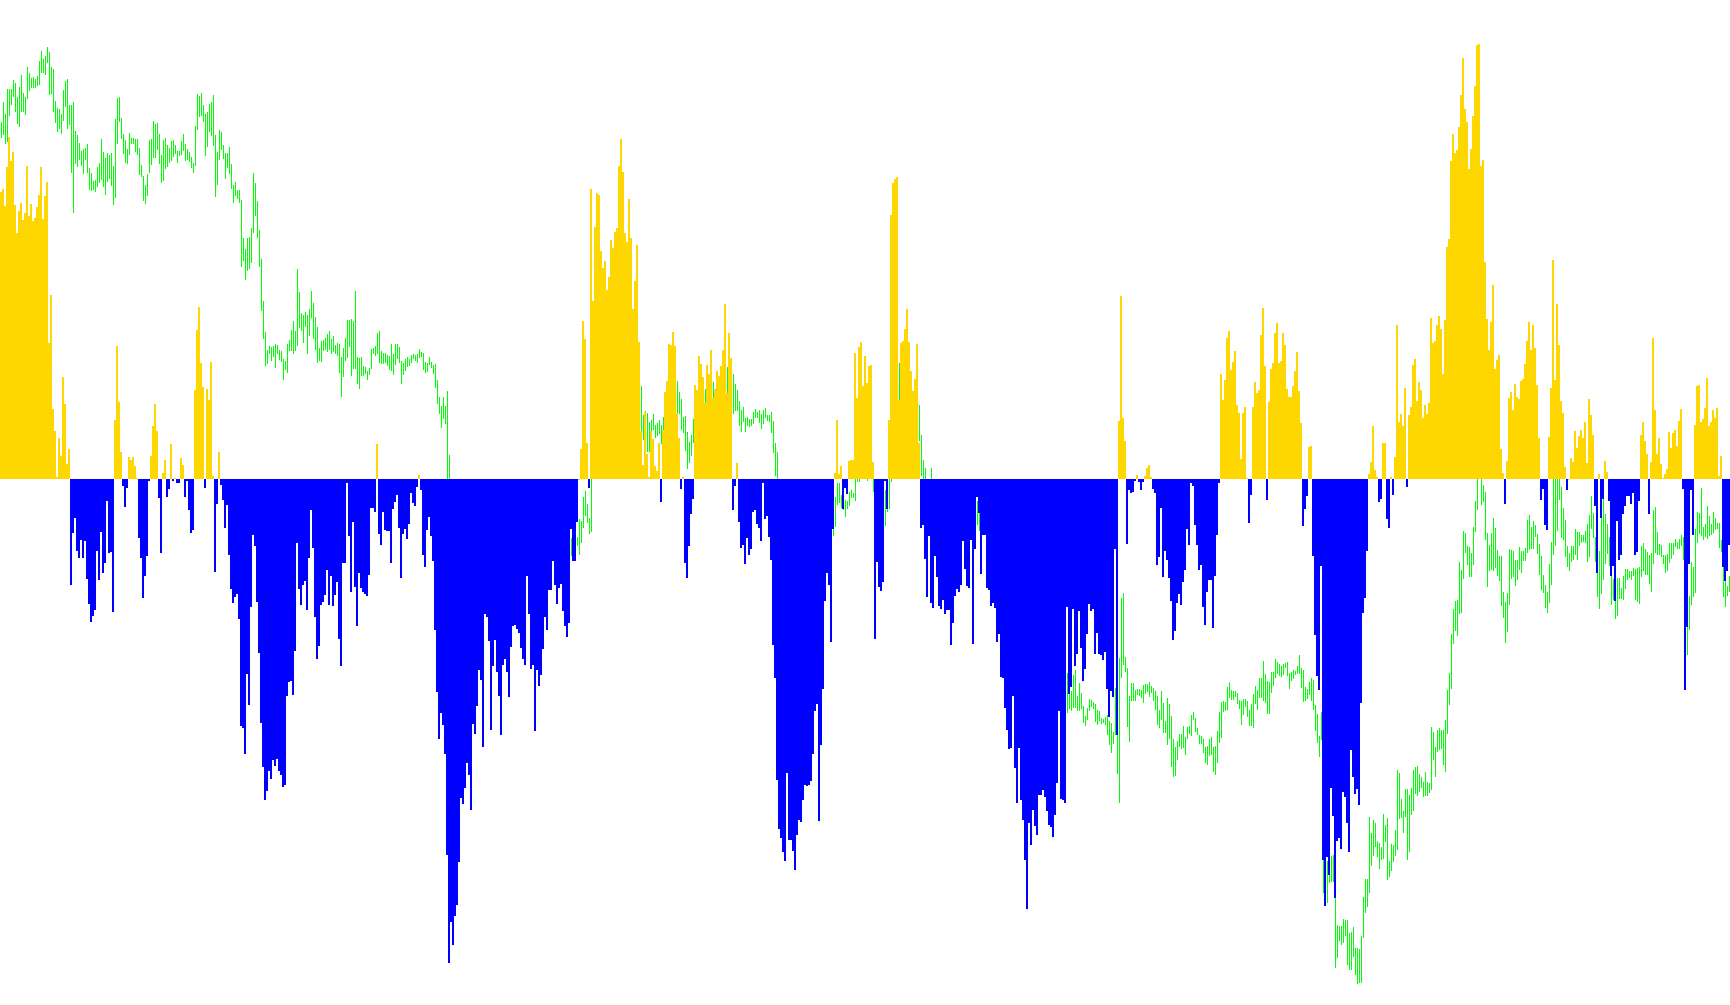
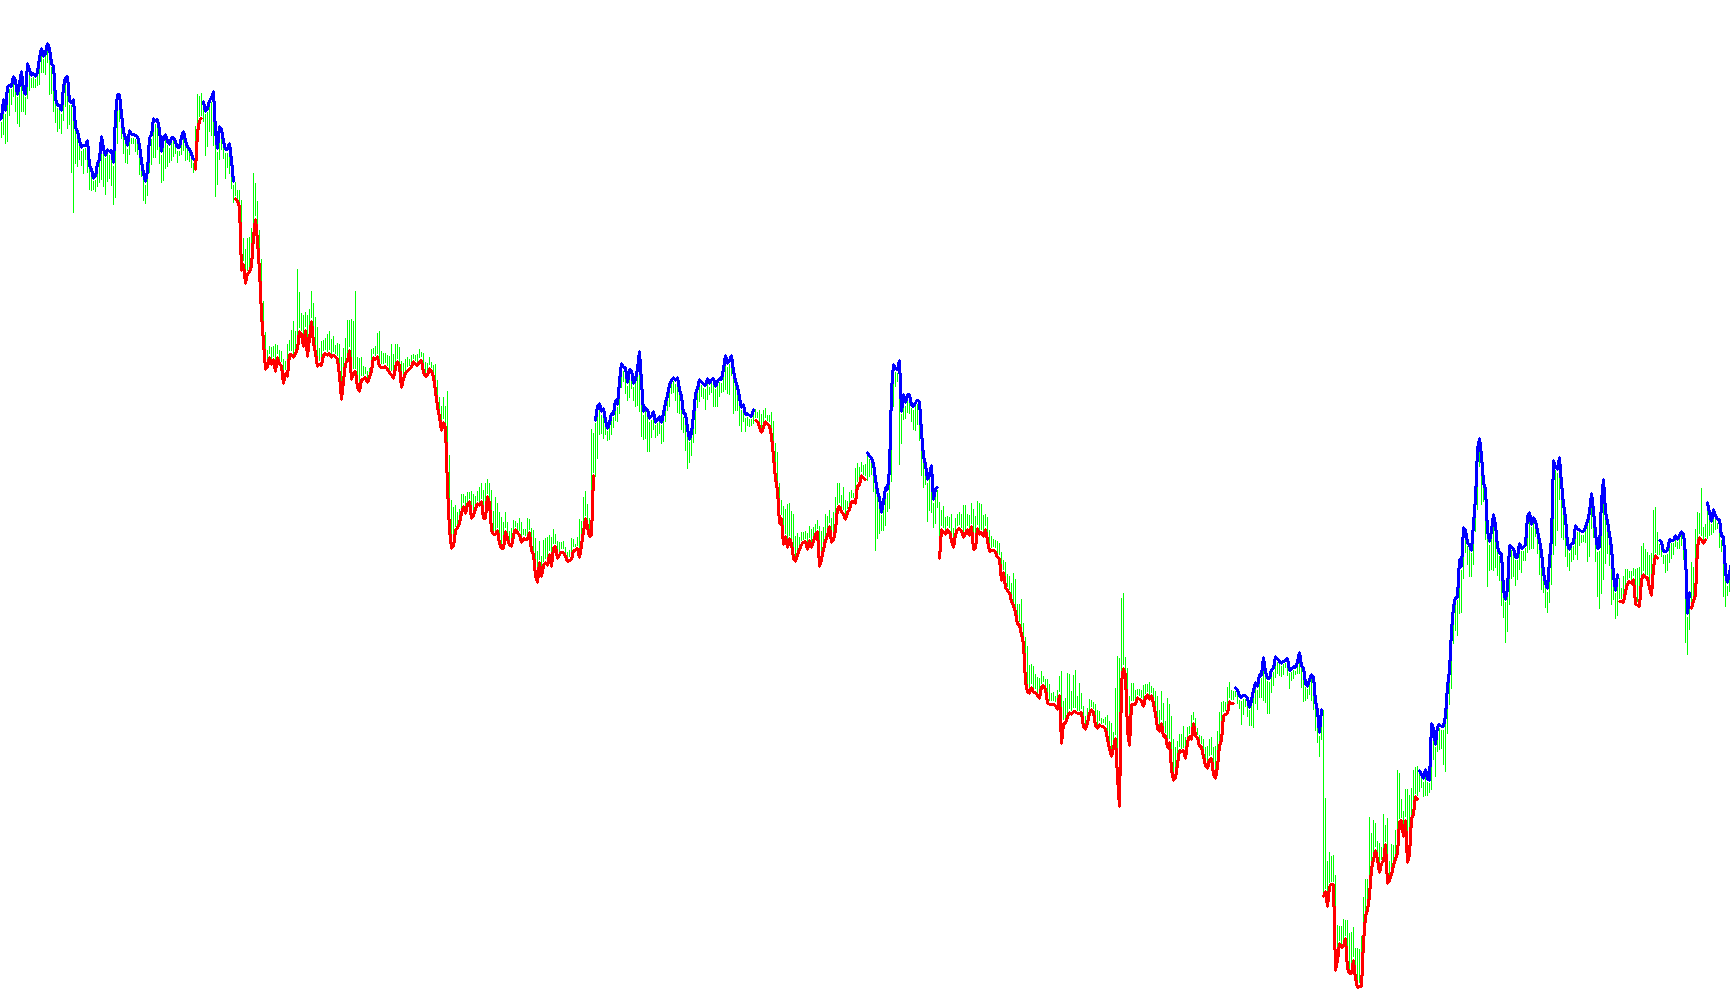
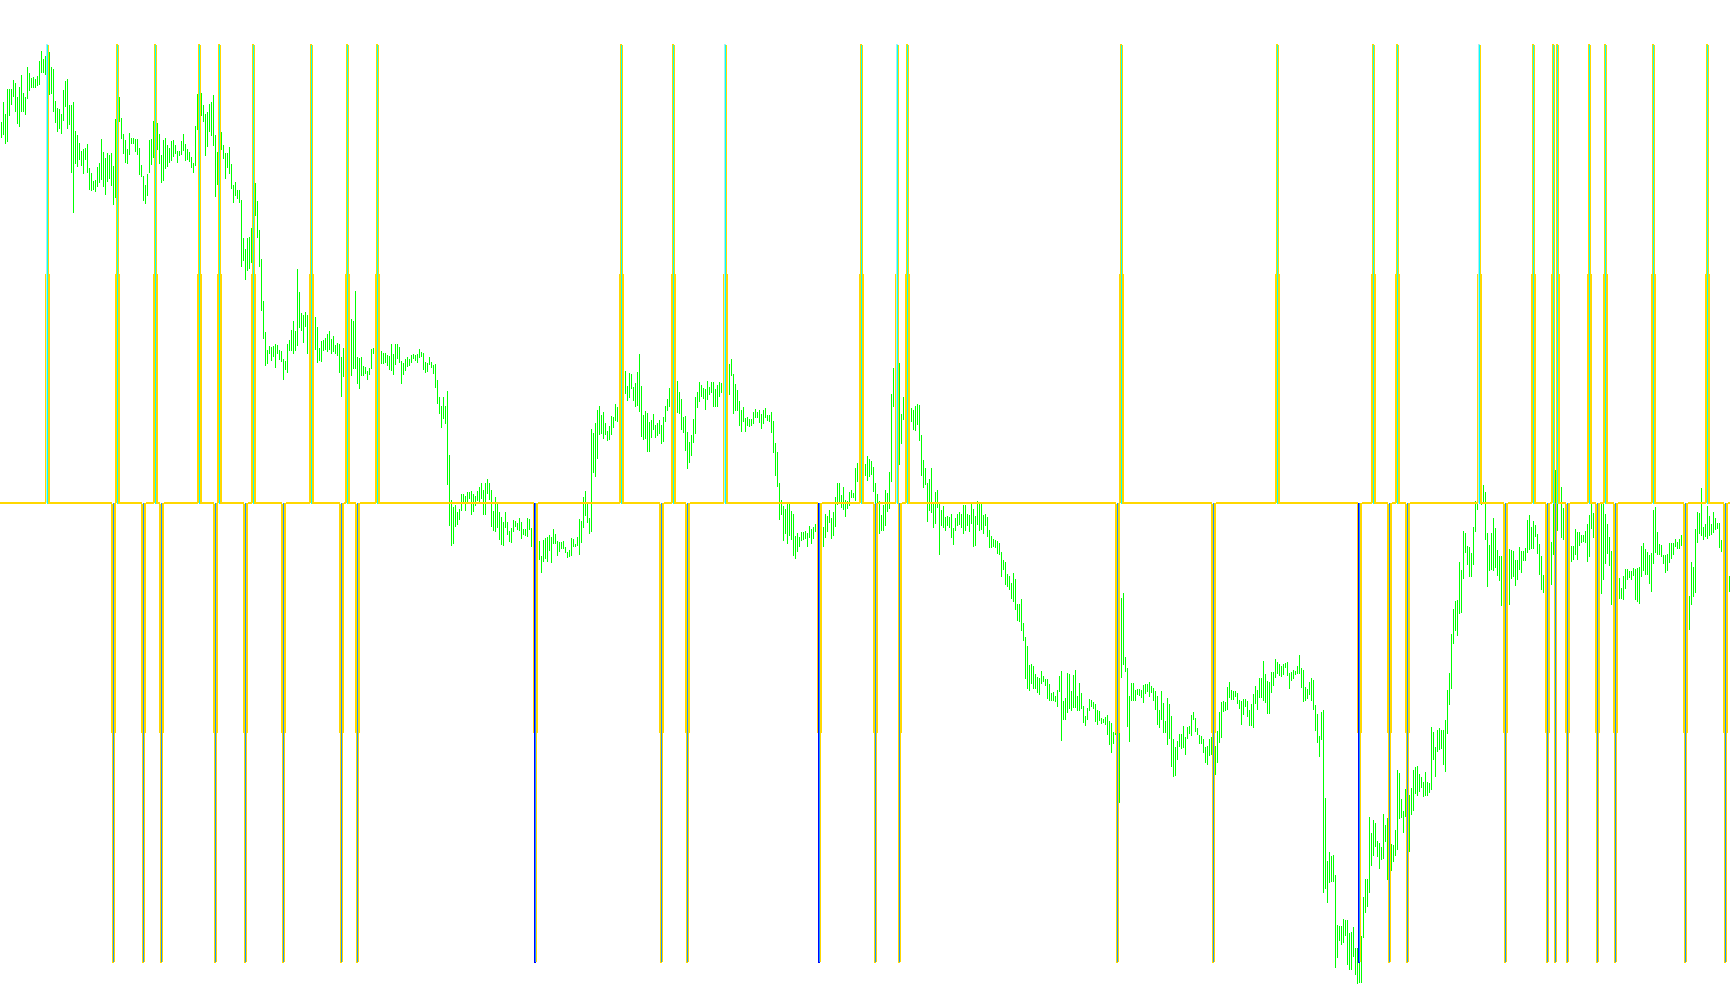
A dual-layered Relative Strength Index visualizer that maps smoothed price velocity against multi-tiered threshold zones to identify overextended market conditions.

BagavinoBar
Indicator

BagavinoBar

iRSI

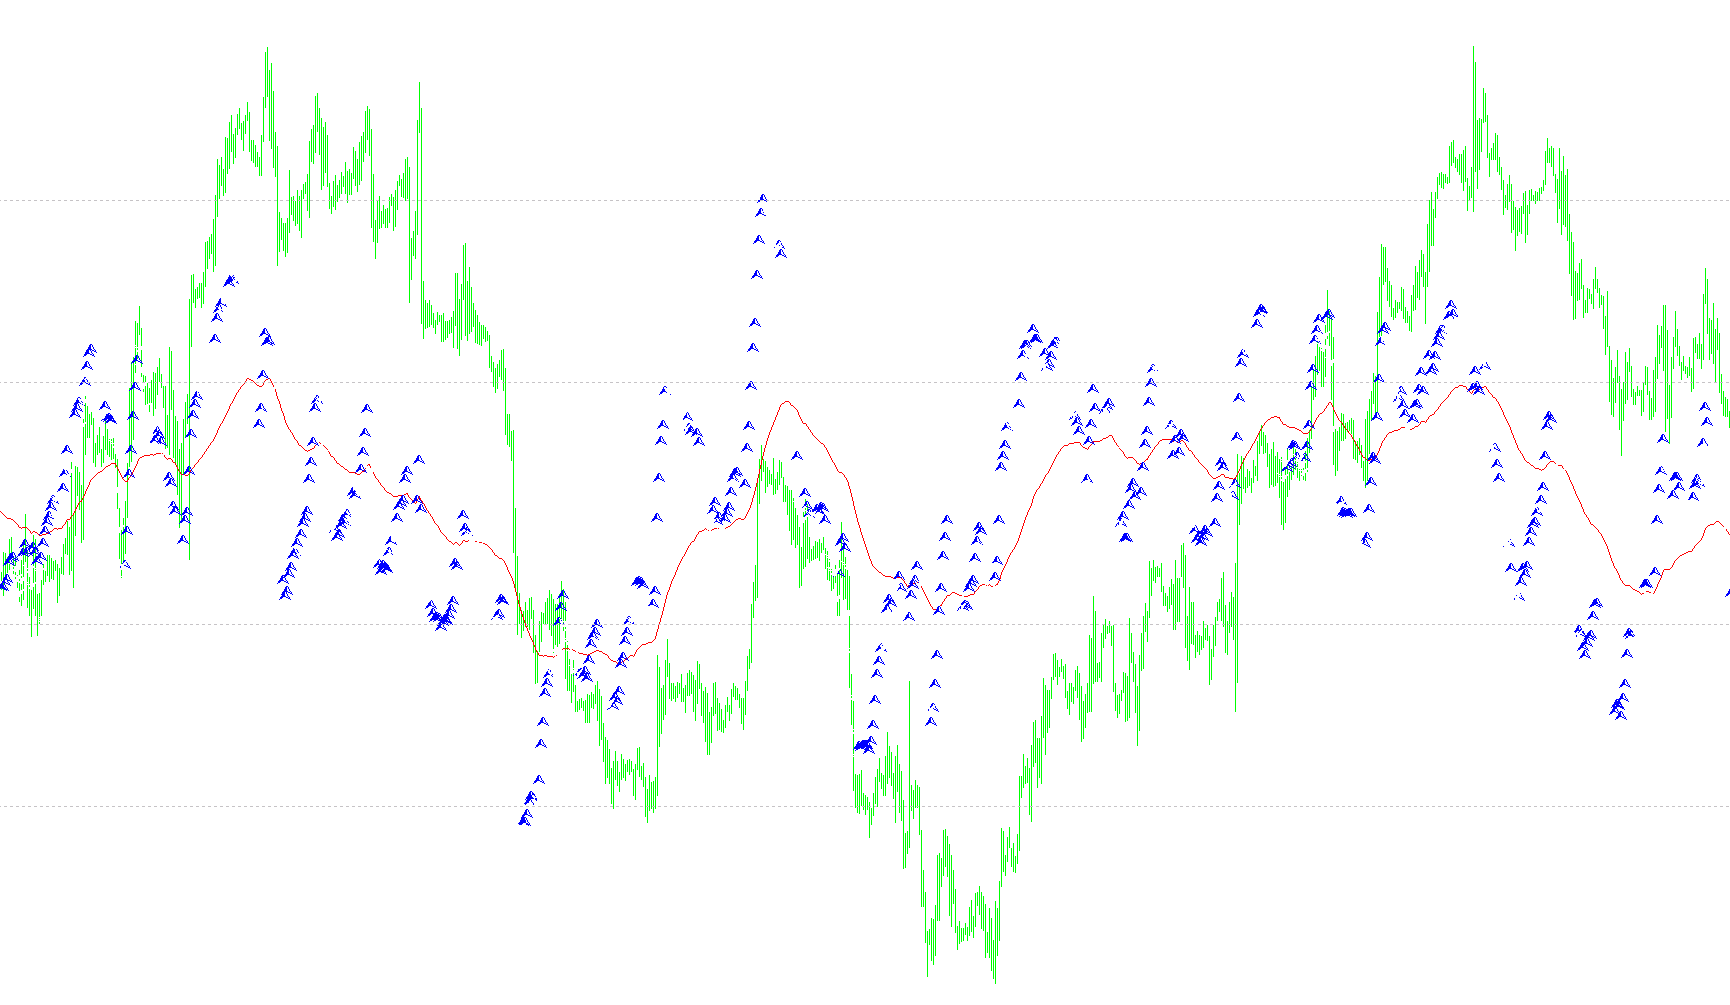
This MetaTrader indicator displays directional arrows based on RSI values calculated across multiple user-defined timeframes, visually indicating potential trend alignment or divergence.

BBR
Indicator

BBR

iBandsiRSI
Indicator

BB_Squeeze_Advanced_v2

iCCIiMACDiRSIiStochastic
Indicator

BB_Squeeze_Advanced_v2M

iCCIiMACDiRSIiStochastic
Indicator

BB_Squeeze_Advanced_v2M2

iCCIiMACDiRSIiStochastic
Indicator

BB_Squeeze_Advanced_v2M3

iCCIiMACDiRSIiStochastic
Indicator

BB_Squeeze_Advanced_v2M3B

iCCIiMACDiRSIiStochastic
Indicator

BB_Squeeze_Advanced_v2M3BC

iCCIiMACDiRSIiStochastic
Indicator

BB_Squeeze_Advanced_v2_v1

iCCIiMACDiRSIiStochastic
BinaryWave
Indicator

BinaryWave

iCCIiMACDiOsMAiMA
Blur's Prices&Time
Indicator

Blur's Prices&Time

iCCIiATRiRSIiStochastic
Bollinger Squeeze v6
Indicator

Bollinger Squeeze v6

iCCIiATRiRSIiStochastic

This indicator identifies potential explosive price movements by detecting periods of low volatility relative to historical averages and filtering them against momentum oscillators like CCI, RSI, or Stochastic.

Bollinger Squeeze v7
Indicator

Bollinger Squeeze v7

iCCIiATRiRSIiStochastic

This indicator identifies high-probability breakout points by filtering momentum oscillators through a normalized ratio of standard deviation against Average True Range to detect price squeezes.

Bollinger Squeeze v8
Indicator

Bollinger Squeeze v8

iCCIiATRiRSIiStochastic

This indicator detects low-volatility environments by comparing Bollinger Band width against ATR-derived expansion to filter momentum signals from Stochastic, CCI, or RSI oscillators.

BPNN Predictor with RSI
Indicator

BPNN Predictor with RSI

iRSI

This indicator utilizes a Backpropagation Neural Network to forecast future price movements by analyzing relative RSI fluctuations across multiple Fibonacci-sequenced time delays.

BreakOutRSI-1
Indicator

BreakOutRSI-1

iRSI
Brooky_Rsi_Ichimoku
Indicator

Brooky_Rsi_Ichimoku

iRSI

This indicator projects the traditional Ichimoku Kinko Hyo components onto Relative Strength Index (RSI) values to identify momentum-based trend reversals and equilibrium zones.

Brooky_Rsi_Ichimoku_V2
Indicator

Brooky_Rsi_Ichimoku_V2

iRSI
BS_RSI
Indicator

BS_RSI

iRSI
CCIRSIDOT
Indicator

CCIRSIDOT

iCCIiRSI

This indicator identifies trend shifts by detecting RSI zero-line equilibrium crossings while monitoring CCI momentum threshold breaches for entry signals.

CCIRSIDOT_v1
Indicator

CCIRSIDOT_v1

iCCIiRSI

This indicator identifies trend transitions by detecting RSI zero-line momentum shifts in conjunction with CCI threshold breaches.

Indicator

CCI_RSI

iACiCCIiRSI
cci_rsi_bar_FxPrime_Kino_All_inOne_v2m
Indicator

cci_rsi_bar_FxPrime_Kino_All_inOne_v2m

iCCIiRSI

This indicator identifies bullish and bearish momentum by synchronizing dual Commodity Channel Index (CCI) crossovers with specific Relative Strength Index (RSI) threshold filters.

chainpricersi
Indicator

chainpricersi

iMAiRSI

This indicator identifies directional entry points by correlating RSI smoothed moving averages with weighted price momentum shifts.

CheckMarkPattern_AD
Indicator

CheckMarkPattern_AD

iMACDiMomentumiRVIiRSI

This indicator identifies bullish and bearish patterns by detecting inverse price-to-oscillator extremums across multiple technical metrics.

Indicator

Color RSI with allert

iRSI
Indicator

Color RSI

iRSI
ColorRSI
Indicator

ColorRSI

iRSI

This indicator dynamically segregates the Relative Strength Index into two distinct visual buffers to differentiate bullish momentum above 50 from bearish pressure below 50.

ColorRSI1
Indicator

ColorRSI1

iRSI
ColorRSI_Histo_ZeroLine
Indicator

ColorRSI_Histo_ZeroLine

iRSI

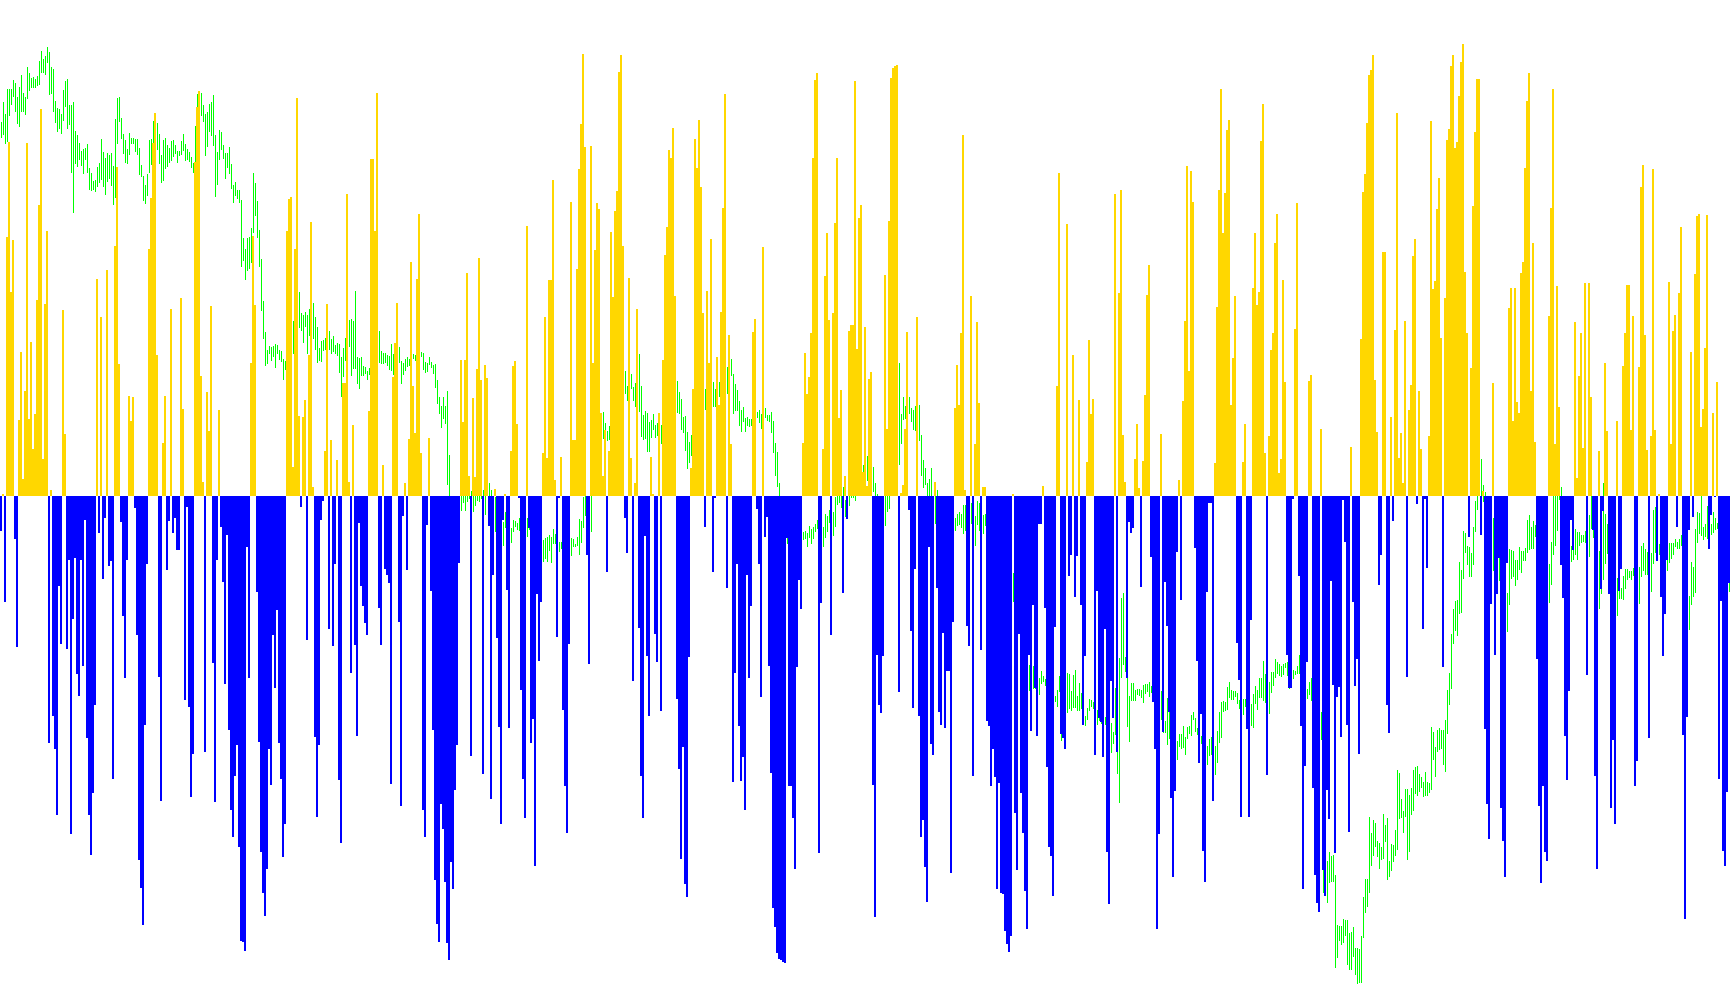
This indicator visualizes price momentum by measuring the deviation of the Relative Strength Index from a 50.0 centerline, rendering dual-colored histograms to signify directional strength shifts.

ColorRSI_Histo_ZeroLine1
Indicator

ColorRSI_Histo_ZeroLine1

iRSI

This indicator visualizes relative strength by calculating the deviation of the RSI value from a 50.0 midpoint, rendering directional histograms above and below the zero line.

Cowabunga
Indicator

Cowabunga

iMACDiMAiRSIiStochastic

This indicator identifies bullish and bearish momentum by synchronizing H4 timeframe trend filters—incorporating EMA crossovers, RSI levels, and Stochastic shifts—with real-time MACD and Stochastic trigger signals on lower timeframes.

Cronex T RSI GF
Indicator

Cronex T RSI GF

iRSI

This indicator applies a multi-period weighted RSI average smoothed through a Fibonacci curvature polynomial and overlaid with Bollinger Bands to identify volatility-adjusted momentum extremes.

Indicator

CurrencyDeviation-V1b04

iMACDiMAiRSI
CycleIdentifier
Indicator

CycleIdentifier

iMAiRSI

This indicator detects nested market fluctuations by identifying concurrent minor and major trend reversals using price action filters, zero-lag smoothing, and dynamic sweep thresholds.

CycleIdentifier2
Indicator

CycleIdentifier2

iMAiRSI
CycleIdentifier2[LW]
Indicator

CycleIdentifier2[LW]

iMAiRSI

This indicator identifies nested market structures by detecting multi-scale price oscillations and momentum shifts through zero-lag filtering and weighted moving average sweeps.

CycleIdentifier_001
Indicator

CycleIdentifier_001

iMAiRSI
Daily Forex Signal
Indicator

Daily Forex Signal

iMACDiMAiRSIiStochastic

This indicator identifies high-probability entries by synchronizing exponential moving average trends across M30, H1, H4, and D1 timeframes with RSI and MACD momentum filters.

DIGIRSI
Indicator

DIGIRSI

iRSI

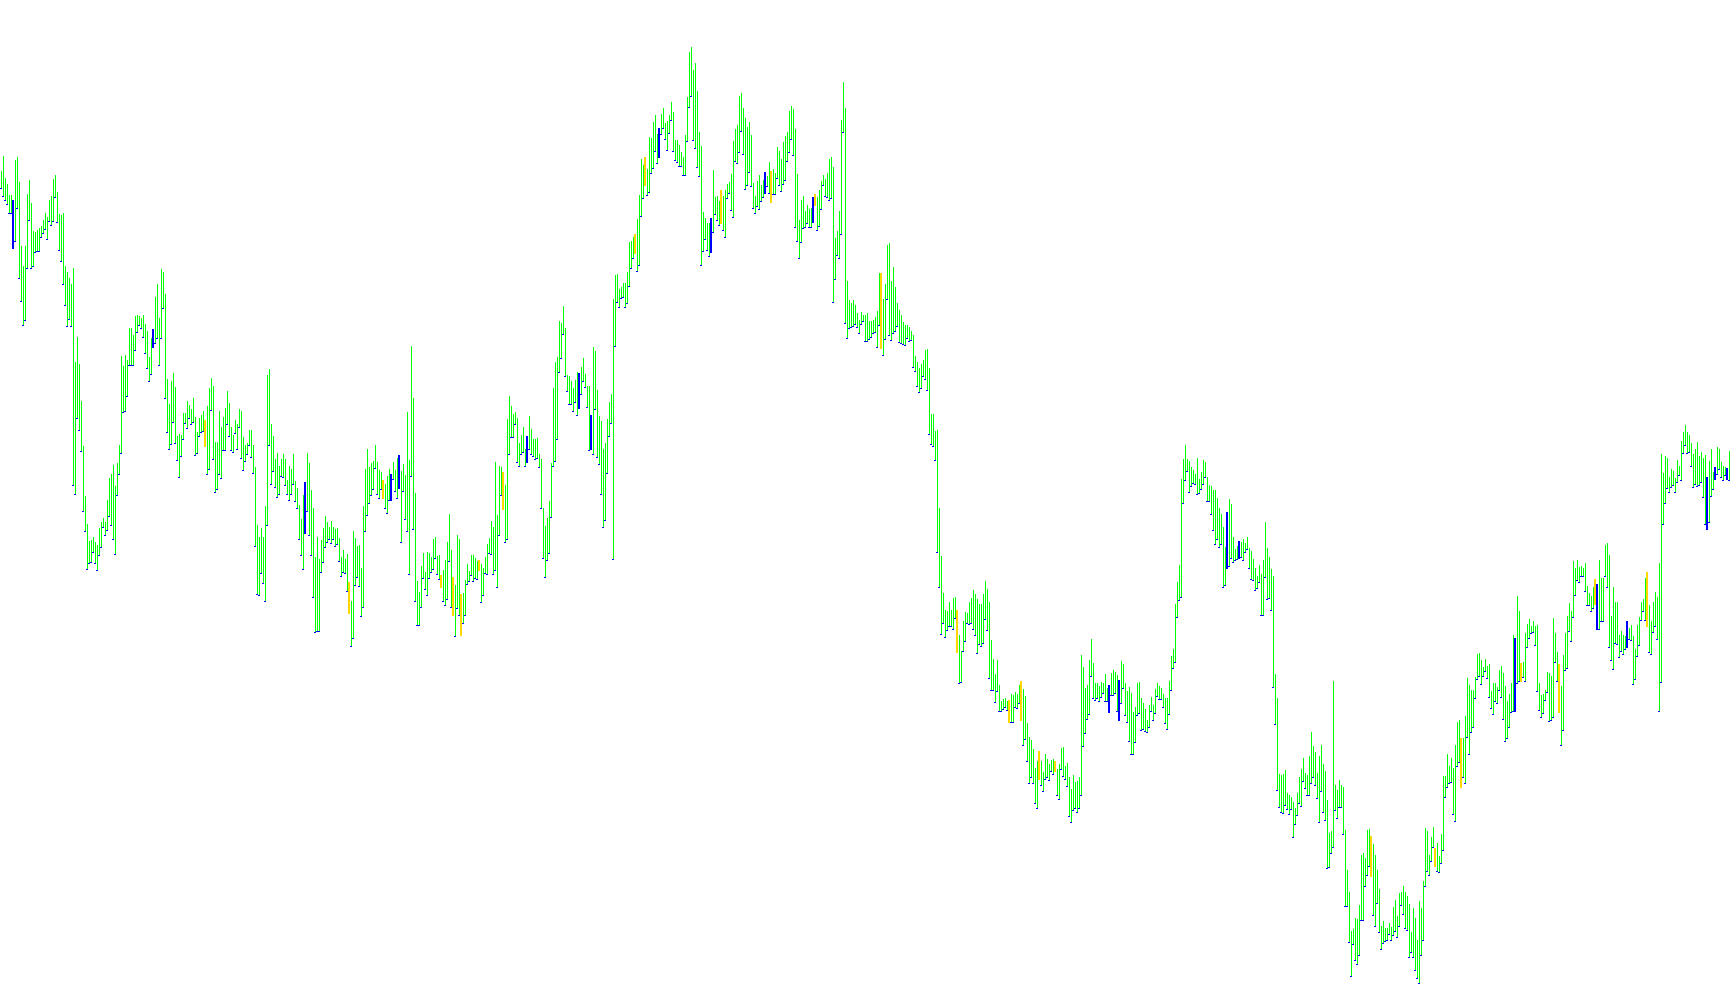
This indicator synchronizes Relative Strength Index values across six distinct timeframes (M1, M5, M15, M30, H1, H4) to provide a unified visual heatmap of market momentum and trend alignment.
Divergence
Indicator

Divergence

iMACDiMomentumiADXiRSI
divergencepetr_s7
Indicator

divergencepetr_s7

iADiACiATRiADX
divergenceviewer_ad
Indicator

divergenceviewer_ad

iMACDiMomentumiRVIiRSI

This indicator identifies and classifies complex price-momentum discrepancies by synchronizing market extremums with multiple technical oscillators, including William %R, RSI, MACD, and custom inputs.

Indicator

Divergence_Petr

iADiACiATRiADX
Divergence_v1
Indicator

Divergence_v1

iMACDiMomentumiADXiRSI

This indicator identifies price-momentum discrepancies by cross-referencing structural peaks and troughs against MACD, RSI, DMI, or Momentum oscillators to highlight potential trend reversals.

Divergence_v2
Indicator

Divergence_v2

iMACDiMomentumiADXiRSI
Divergence_v3
Indicator

Divergence_v3

iMACDiMomentumiADXiRSI
DT-RSI-Sig
Indicator

DT-RSI-Sig

iRSI
DT-RSI-Sig_v1
Indicator

DT-RSI-Sig_v1

iRSI

The indicator identifies bullish and bearish market reversals by detecting local RSI extrema relative to specific momentum thresholds and projecting linear trend segments for entry signals.