GBPUSD_sample
Download script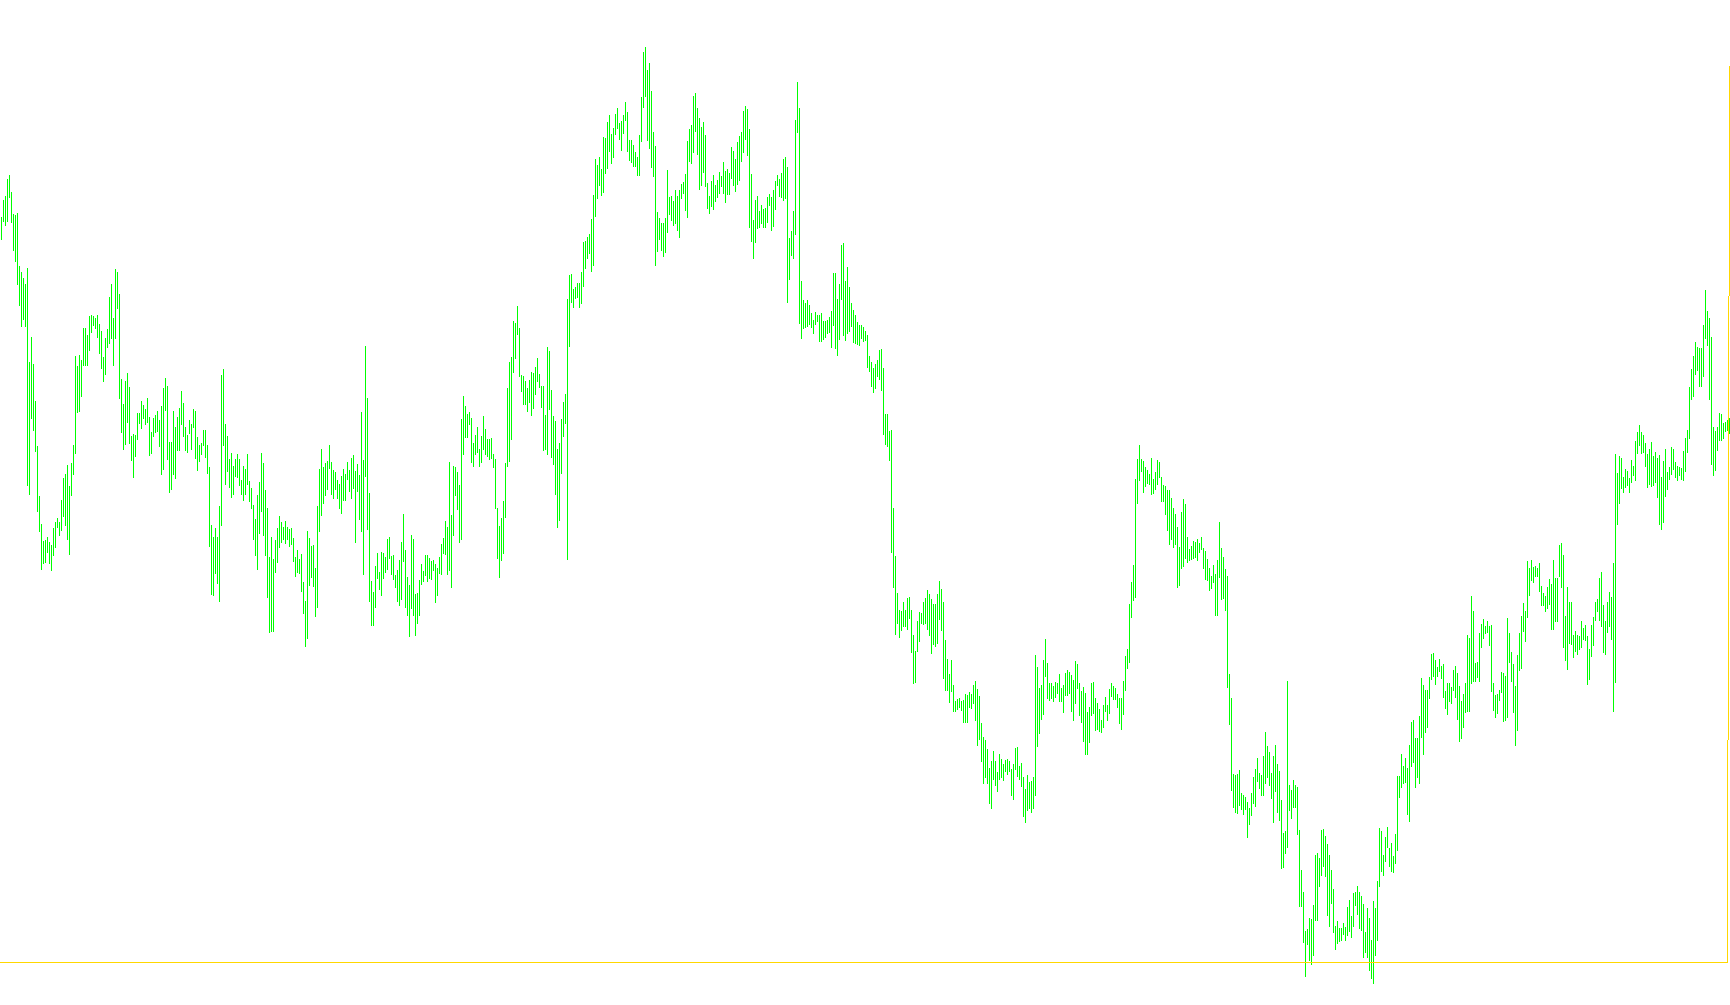
This script is designed as a visual financial tool for the MetaTrader platform to help traders monitor the relative momentum of two different currency movements simultaneously. Instead of looking at price charts directly, this indicator provides a streamlined way to observe market strength and weakness through two distinct lines plotted in a separate window.
How the Logic Works
The script operates by calculating a specific technical momentum value—known as the Relative Strength Index (RSI)—for two different currency pairs at once. While you might be trading one specific pair, this tool pulls data from GBPJPY and USDJPY to provide a broader context of market movement.
Here is the step-by-step logic of how it processes information:
- Data Collection: The script looks back at a specific window of recent price history (defined by a user-adjustable setting). It examines the "typical price" (an average of the high, low, and closing prices) to ensure the data reflects a fair representation of the market's activity.
- Dual Analysis: It runs two independent calculations simultaneously:
- It tracks the momentum of the British Pound against the Japanese Yen.
- It tracks the momentum of the US Dollar against the Japanese Yen.
- Visual Representation: The results are plotted as two separate lines on your screen:
- One line (Blue) represents the GBP component.
- The other line (Red) represents the USD component.
- Reference Benchmarking: The indicator includes a permanent horizontal reference line at the "50" level. This serves as a midpoint; when the lines move above or below this level, it helps traders quickly identify which currency is showing more strength or weakness relative to the Japanese Yen.
Summary for the User
Essentially, this tool acts like a "momentum thermometer." By watching how the Blue and Red lines interact with each other and the center reference line, you can get a clear, visual sense of which currency (GBP or USD) is gaining ground or losing steam in the current market environment without having to switch between multiple different charts.
//+------------------------------------------------------------------+
//|                                                       GBPUSD.mq4 |
//|                           Copyright © 2005-2006, tWiMC Computers |
//|                                               mchistyakov@wwf.ru |
//+------------------------------------------------------------------+
#property  copyright "Copyright © 2005-2006, Ìèõàèë ×èñòÿêîâ"
#property  link      "mchistyakov@wwf.ru"
#property  indicator_separate_window
#property  indicator_buffers 2
#property  indicator_color1  Blue
#property  indicator_color2  Red
#property indicator_level1 50
#property indicator_levelcolor Olive
#property indicator_levelwidth 1
extern int RSI=21;
double     ind_buffer1[];
double     ind_buffer2[];
int init()
  {
   SetIndexStyle(0,DRAW_LINE,STYLE_SOLID,1);
   SetIndexStyle(1,DRAW_LINE,STYLE_SOLID,1);
   SetIndexDrawBegin(0,0);
   SetIndexDrawBegin(1,0);
   IndicatorDigits(MarketInfo(Symbol(),MODE_DIGITS)+4);
   if(!SetIndexBuffer(0,ind_buffer1) && !SetIndexBuffer(1,ind_buffer2))
   Print("cannot set indicator buffers!");
   IndicatorShortName("GBPUSD");
   SetIndexLabel(0,"GBP");
   SetIndexLabel(1,"USD");
   return(0);
  }
int start()
  {
   int limit;
   int counted_bars=IndicatorCounted();
   if(counted_bars<0) return(-1);
   if(counted_bars>0) counted_bars--;
   limit=Bars-counted_bars;
   for(int i=0; i<limit; i++)
      ind_buffer1[i]=iRSI("GBPJPY",0,RSI,PRICE_TYPICAL,i);
   for(int j=0; j<limit; j++)
      ind_buffer2[j]=iRSI("USDJPY",0,RSI,PRICE_TYPICAL,j);
return(0);
  }
Comments